


Kameleon007/E+ via Getty Images
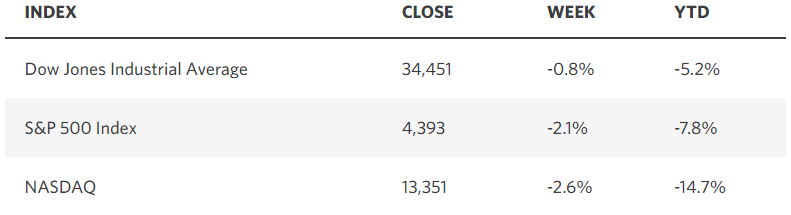
It was another difficult week for the Nasdaq Composite and technology shares, as the 10-year Treasury yield continued its march higher, reaching a new pandemic-era high of 2.83%. Fueling the rise were two reports showing inflation readings for March hit multi-decade highs. The Consumer Price Index (CPI) rose 8.5% year-over-year, while the Producer Price Index (PPI) soared 11.2% over the past year. The only solace is that we have likely seen the peak in both rates, but it will be a long road before either rate falls within the Fed’s targeted range. Countering these valuation headwinds were better-than-expected earnings reports and retail sales numbers that showed the resiliency of the American consumer.
Edward Jones
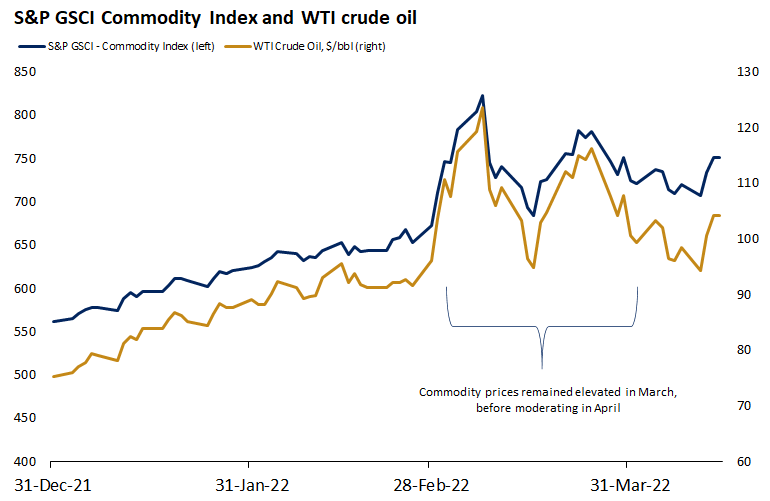
There are a countless number of negative datapoints and geopolitical developments that have been absorbed by financial markets this year, while the positive ones are few and far between. This is evident in some of the most depressed consumer and investor sentiment numbers on record. Yet the major market averages are holding above their February and March lows, and we are starting to see rates of change move in a positive direction. That is why I have swung from a bearish tilt at the beginning of the year to a bullish one today. A prime example is that the average price for crude oil in March was $108, while the average so far in April is $99, which suggests we will see some moderation in the headline inflation number when we receive the May report. New and used car prices are also falling, and other categories will follow, which is why I expect to see the CPI and PPI gradually decline throughout the remainder of this year. as year-over-year comparisons become more difficult.
Edward Jones
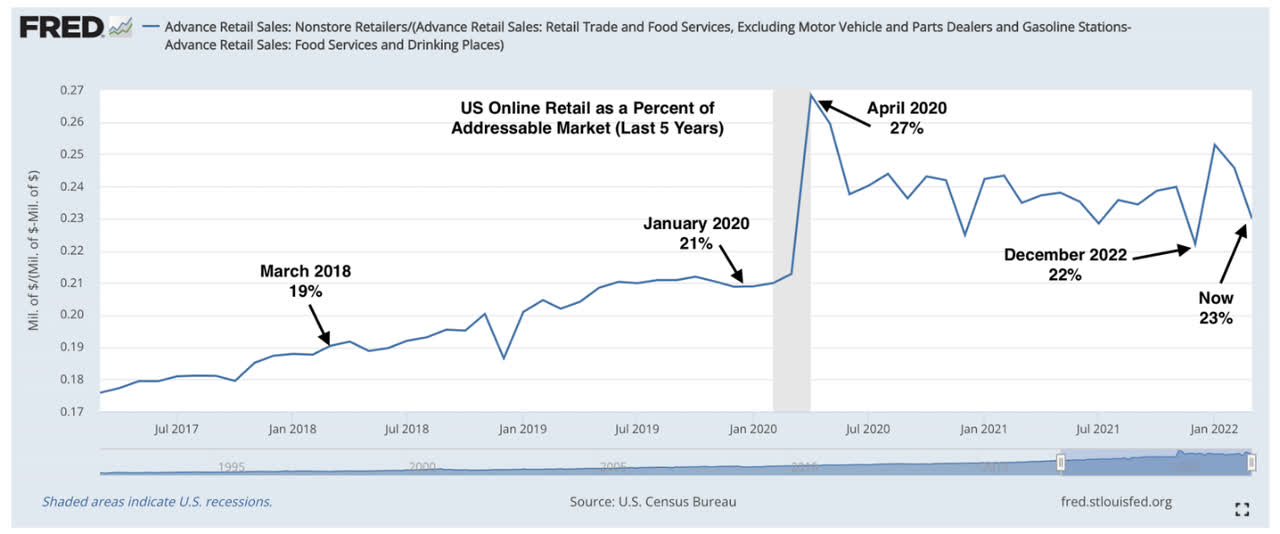
In light of the highest inflation rate in 40 years, it is all the more impressive that retail sales increased 0.5% from February to March. Granted, sales declined 0.3% when we exclude gasoline, which means that consumers cut back in other categories of spending, but not by much. In fact, sales at electronics and appliance stores (+3.3%) and general merchandise stores (+5.4%) rose more than the 1.2% monthly increase in inflation. Internet sales slumped more than any other category with a decline of 6.4%, but this was largely due to a normalization of the steady uptrend in online sales after we saw a 21.2% increase in January. Internet sales spiked during the omicron wave of the pandemic at the beginning of the year. Overall, this was a strong report given the circumstances and it bodes well for the rate of economic growth in the first quarter.
DataTrek
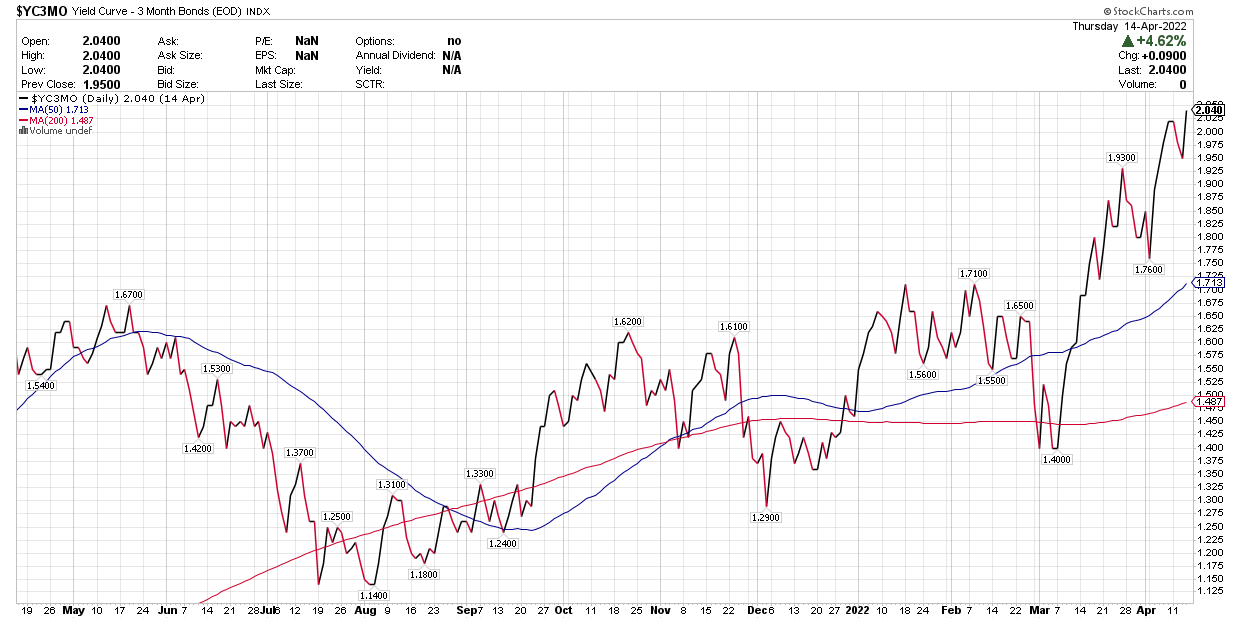
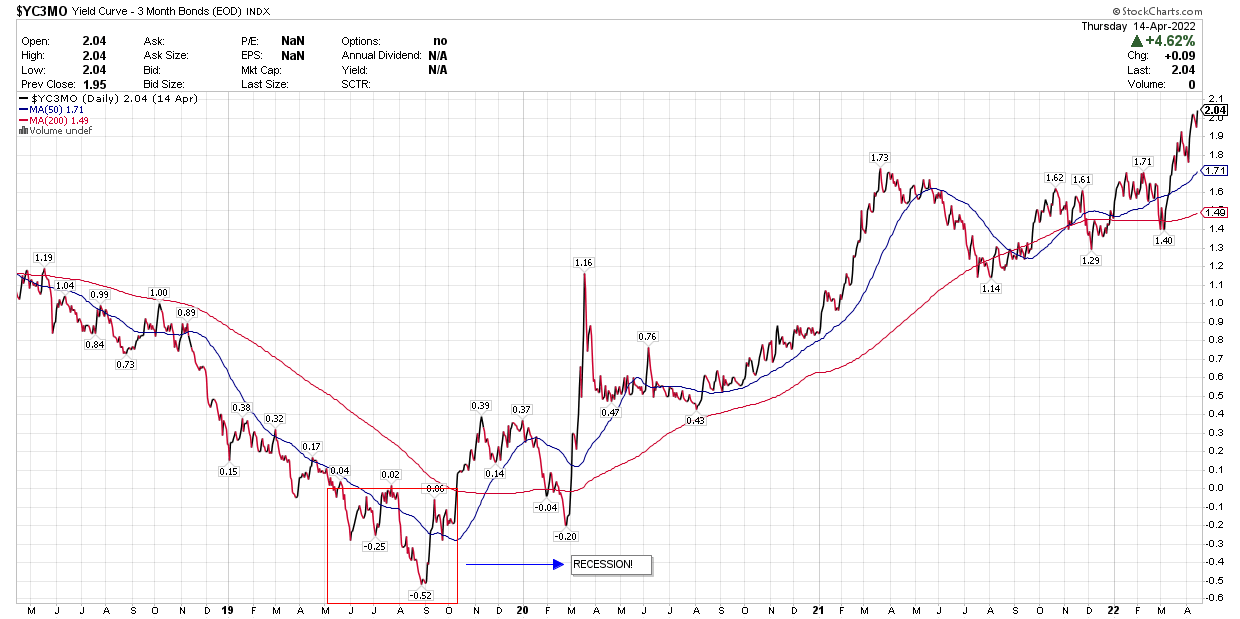
With respect to the rate of economic growth, there has been a lot of discussion about yield curves this year after the inversions we saw in both the 2- and 5-year Treasury yields with the 10-year yield, stoking recession fears. Yet it is the spread between the 3-month bill and 10-year Treasury that has the highest correlation to the rate of economic growth over the coming year. On that front the economy looks to be strengthening, as this curve has steepened dramatically.
stockcharts
It gave us an early warning sign during the summer of 2019, suggesting that something was amiss when it inverted for a period of six months. I doubt the bond market knew that a pandemic was coming, but the inversion was a clear indication that the economy was weakening. It appears to be the exact opposite today.
stockcharts
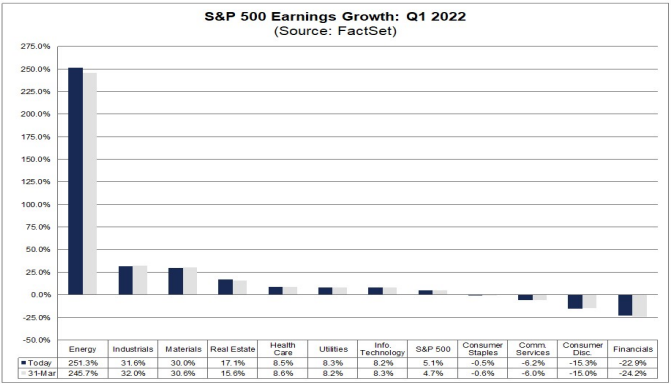
I expect first quarter earnings to confirm that strength. So far, with 7% of S&P 500 companies reporting first quarter results and 77% of those companies beating estimates, the earnings growth rate has risen from 4.7% to 5.1%. It comes as no surprise that earnings are above estimates, as that’s the norm, but we need to see year-over-year growth of 13% to exceed the fourth quarter number of $55.37 for the S&P 500 and maintain sequential growth. I am optimistic, but it is too early to confirm on this front. Again, we are moving in a positive direction.
FactSet
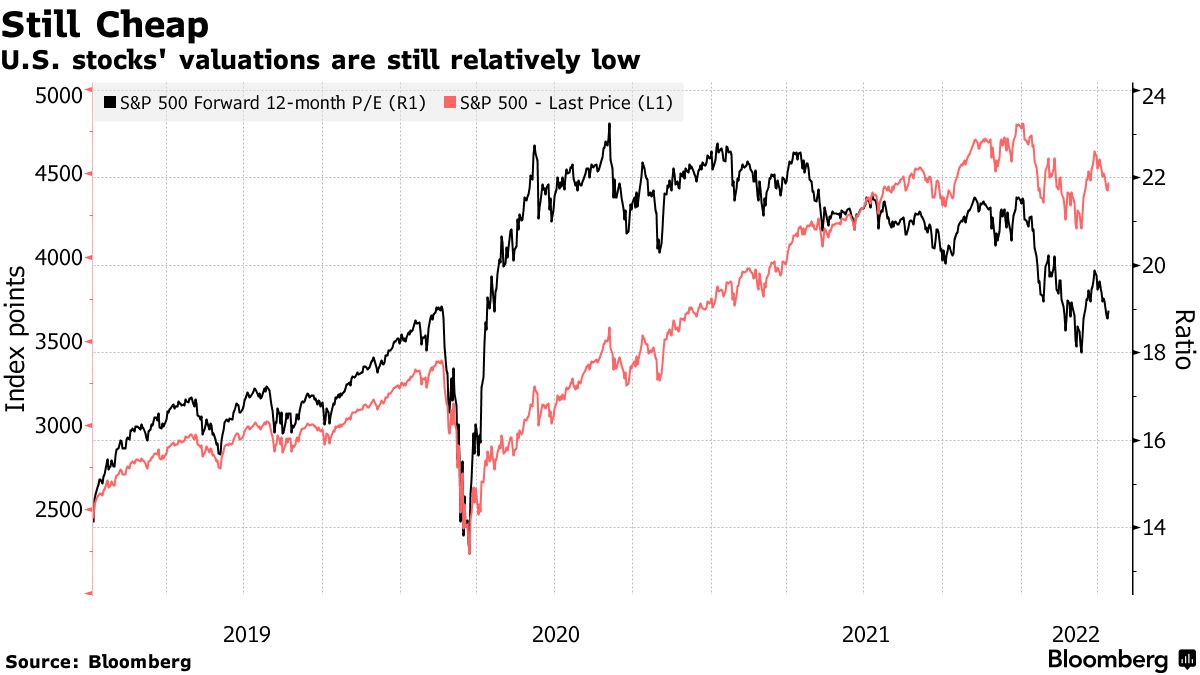
The combination of increased earnings with the year-to-date decline in the S&P 500 index has brought the forward 12-month multiple down from approximately 23 to 19. We are likely to see continued multiple contraction this year through a combination of more compression in growth stock multiples and better-than-expected earnings results. That will limit the upside in the index this year, but it does not necessitate lower levels.
Bloomberg
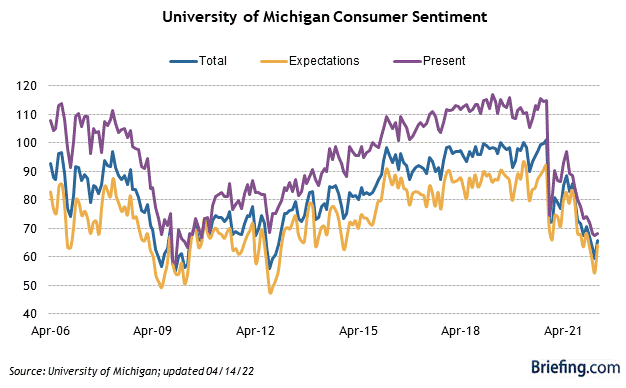
The steady drumbeat of negative headlines combined with inflation have weighed significantly on consumers’ outlook, despite strong spending levels. This is reflected in sentiment levels from the University of Michigan that are near what we saw during the Great Financial Crisis, but there is no financial crisis on the horizon. To the contrary, the macro environment has historically improved from such negative levels of sentiment.
Briefing.com
Investor sentiment is even more depressed. The most recent American Association of Individual Investors survey shows the lowest levels of optimism in 30 years. The percentage of investors expecting stocks to rise over the next six months at 15.8% is among the l0 lowest readings in the survey’s history dating back to 1987. Sentiment is a contrarian indicator because extremely bearish levels have historically been followed by above-returns for the S&P 500 over the following 6-12 month period.
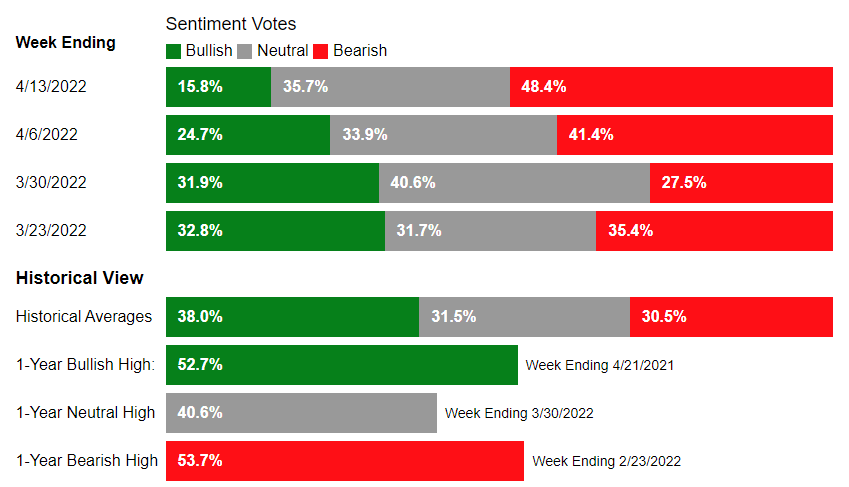
AAII
Our financial markets have digested a tremendous amount of bad news this year, which includes a bond market that has already priced in an entire year of monetary policy tightening. I think consumers are too pessimistic about the economy, investors are too bearish about the stock market, and Wall Street is too hawkish in its interest rate outlook. These historically low levels of sentiment tell me that market prices are already reflecting the negatives at a time when rates of change in the data are at an inflection point. Moderations in the rate of price increases, followed by declines, should result in more difficult comparisons that lower the CPI and PPI in the months ahead. The rate of increase in long-term interest rates should slow significantly, as inflation concerns moderate. Markets are likely to reprice expectations for short-term interest rate hikes by the Fed to be less hawkish than they are today. Lastly, corporate profits should continue to beat expectations on a better-than-expected rate of economic growth. These factors should continue to support risk asset values in the 6-12 month period ahead.
Economic Data
In addition to a deluge of corporate earnings, we have several reports on the housing market, which will probably show a cooling of activity, given the sharp increase in mortgage rates over the past three months. We do have Markit’s mid-month read on the strength of the manufacturing and service sectors of the economy for April on Friday. That will be an important report to either confirm or undermine my outlook for a strengthening economy.
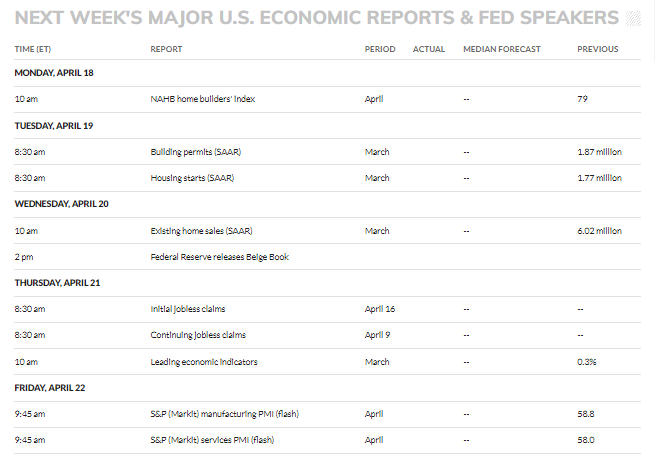
MarketWatch
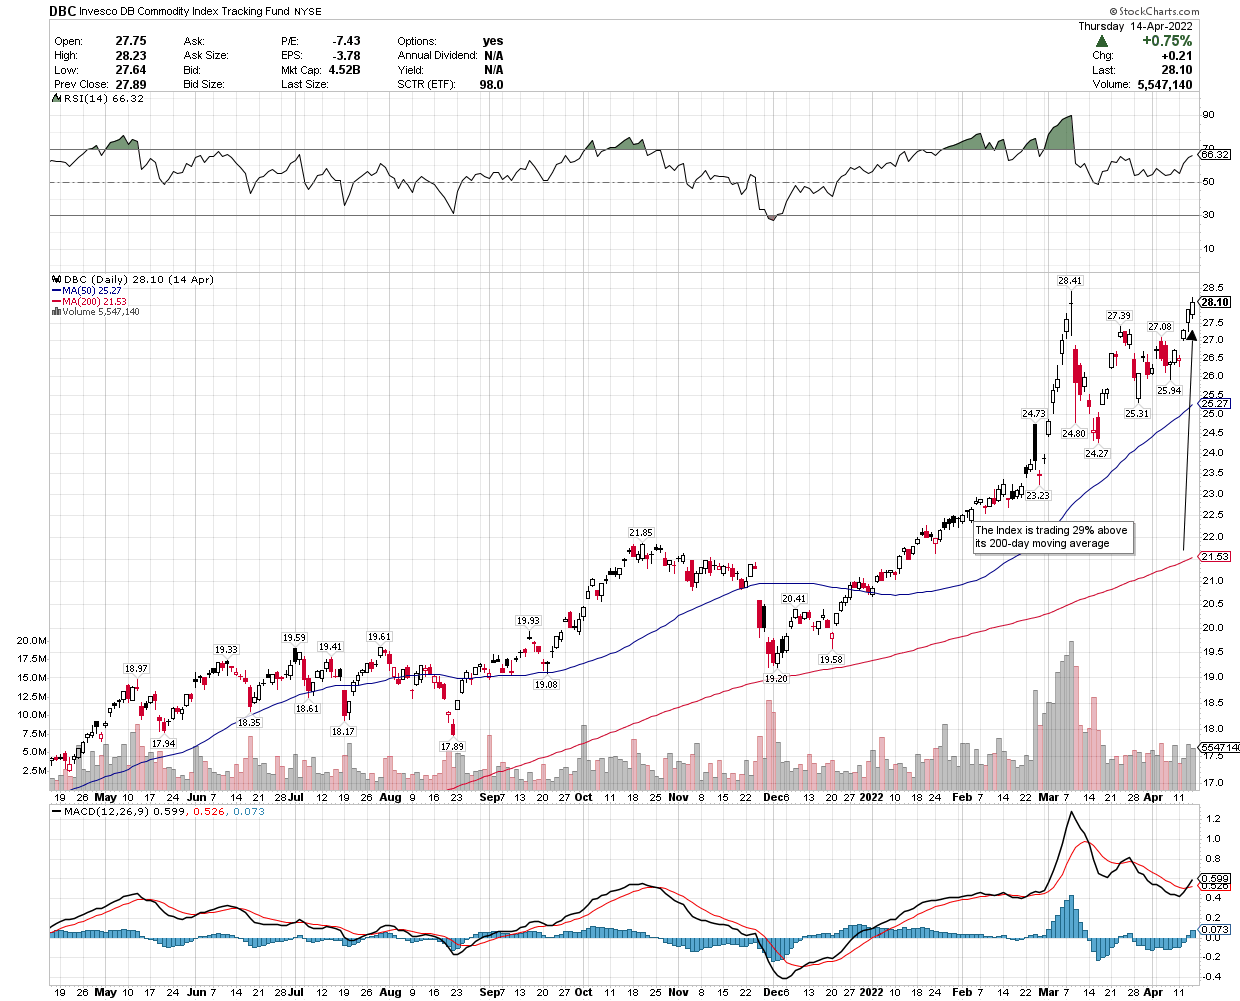
Technical Picture
The Invesco Commodity Index Tracking Fund (DBC) is now 29% above its 200-day moving average. According to Dow Jones market data going back to 2006, when the index is this far above its long-term moving average, it has fallen an average of 15% over the following three months and 41% over the following six months. That may be a stretch in the current macroeconomic environment, but it does suggest a decline from current levels is a distinct possibility, which is consistent with my outlook and would be very bullish for risk assets.
stockcharts
Be the first to comment