

ErikMandre
Thesis
The Nuveen S&P 500 Dynamic Overwrite Fund (NYSE:SPXX) is a closed end fund falling in the equity buy-write strategy bucket. As per the fund’s literature:
The Fund is designed to offer regular distributions through a strategy that seeks attractive total return with less volatility than the S&P 500 Index by investing in an equity portfolio that seeks to substantially replicate the price movements of the S&P 500 Index, as well as selling call options on 35%-75% of the notional value of the Fund’s equity portfolio (with a 55% long-term target) in an effort to enhance the Fund’s risk-adjusted returns. The strategy will consider the Fund’s tax position and employ techniques to improve after-tax shareholder outcomes.
Source: Q1 Portfolio Review
Many investors have flocked to buy-write equity CEFs this year due to the perceived benefit of shorting volatility via covered calls. We are going to have a look at how SPXX has performed from that angle and whether it makes sense to be long buy-write equity CEFs rather than outright stocks when a recession is around the corner.
First let us have a look at the year-to-date performance:
YTD Total Returns (Seeking Alpha)
We can see from the above table that indeed, year to date, the S&P 500 has been significantly outperformed by all of the buy-write CEFs in the cohort. More importantly though, we have to break down that performance, and fully understand what is behind it. Let us have a closer look:
CEF Table (Author, Morningstar)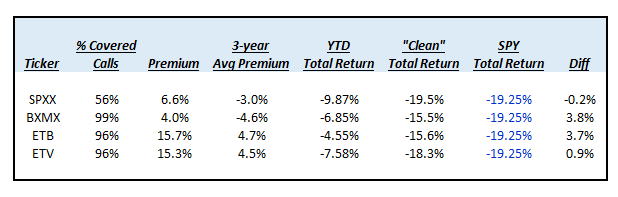
In the above table we have parsed out the 2022 YTD Total Returns for each CEF and have also outlined their current premiums to NAV and their 3-year average premiums to NAV.
The idea here is to try to isolate the “true” 2022 CEF performance versus a premium to NAV increase: i.e. if there was no change in premium/discount to NAV on the underlying CEF in 2022 how would the total return look like?
Major take-aways from the analysis:
- all equity buy-write CEFs have experienced significant premium increases in 2022
- when factoring out the premium to NAV increases only two CEFs actually show an outperformance versus the Index
- these two CEFs (BXMX and ETB) have an average outperformance of almost 4% versus the index
It is interesting to note that SPXX is flat to the SPY total return when we factor out the increase in the premium to NAV. The fund has on average traded at discounts to NAV but it has moved to premium territory in 2022:
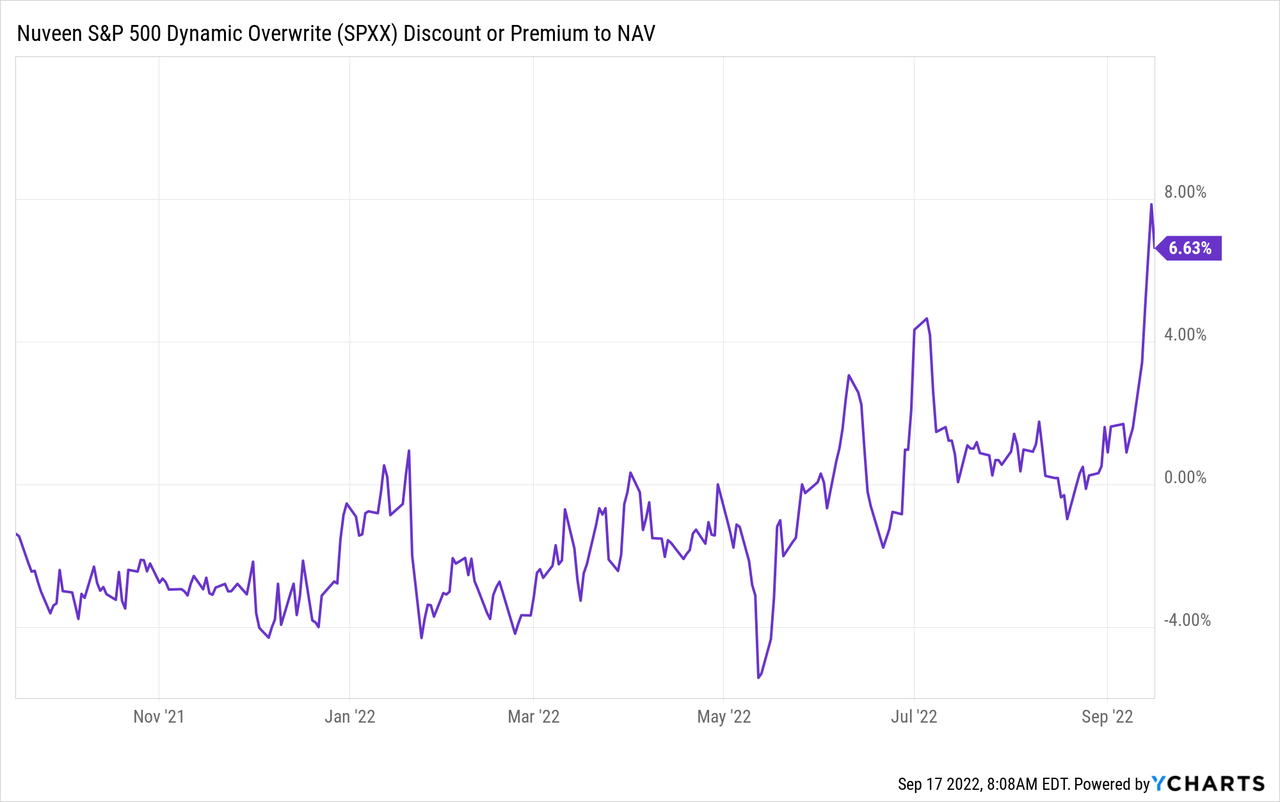
If the fund had continued to trade at its usual discount to net asset value its performance would have equated the S&P 500.
However the big take-away here is that due to perceptions (i.e. investors’ views), buy-write CEFs have indeed outperformed the S&P 500 this year and they represent a preferred choice versus outright equities when a recession is around the corner.
Option Overlay Information
Currently the fund writes covered calls for approximately 56% of the portfolio:
Option Overlay (Fund Website)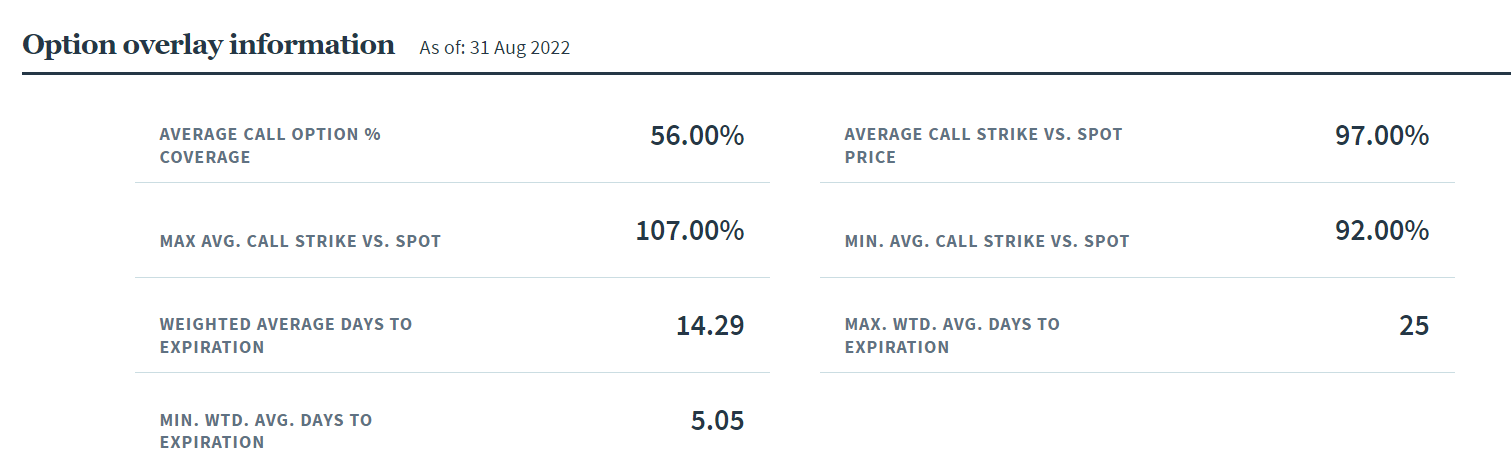
Below we have pulled from the fund’s literature the definitions for each term present above:
Average Call Option % Coverage is the percentage of the Fund’s underlying equities overwritten by call options; equals sum of notional values of call options divided by the market value of equities in the portfolio.
Average Call Strike vs. Spot Price is the average ratio of call option strike prices vs. spot prices, weighted by the notional value of the calls. A figure > 100% indicates that option strike prices, on average, are above their current spot prices and the calls are “out of the money”. A figure < 100% indicates that option strike prices, on average, are below spot prices and the calls are “in the money.”
Maximum Average Call Strike vs. Spot Price is the maximum average ratio (as defined above) of call option strike prices vs. spot prices during the month.
Minimum Average Call Strike vs. Spot Price is the minimum average ratio (as defined above) of call option strike prices vs. spot prices during the month.
Weighted Average Days to Expiration is the average days to expiration for all call options in the Fund’s portfolio, weighted by notional values.
Maximum Weighted Average Days to Expiration: Is the maximum average number of days to expiration during the month for all call options in the Fund’s portfolio, weighted by notional values.
Minimum Weighted Average Days to Expiration: Is the minimum average number of days to expiration during the month for all call options in the Fund’s portfolio, weighted by notional values.
Basically the takeaway here is that on average the fund writes in-the-money call options currently which have higher deltas and protect better a portfolio during a downturn due to their higher realized premiums.
Conclusion
SPXX and buy-write CEFs in general have outperformed the S&P 500 in 2022. However, when we dive into the details, we notice that most of the CEFs rallied on increases in premiums to NAV versus their historical averages, rather than on underlying outright performance. This tells us that investors perceive short volatility strategies as preferable over outright equity positions in recessionary environments. When we subtract the increases in premiums to NAV versus historical averages, we notice that SPXX is actually flat to the S&P 500 performance. In the analyzed cohort only two CEFs actually outperformed the index when normalized for the premium to NAV factor. Performance is what matters in the end, and the take-way here is that switching to buy-write equity CEFs is a better way to navigate potential recessions versus outright equity positions. However, SPXX and the other buy-write CEFs outperform based on investors’ perceptions as manifested in premiums to NAV rather than from the underlying short volatility strategy.
Be the first to comment