

Galeanu Mihai
The malaise that has befallen the financial markets in 2022 caught many investors off guard, and has led to market value losses measured in trillions of dollars. But as we know from market history, certain asset classes tend to outperform during weak periods, and then subsequently underperform during bull markets. By understanding these relationships, as well as having a macro view of whether we’re in a bull or bear market, you can put your portfolio on the path to outperformance.
I favor growth stocks, because if you get it right, the rewards can be enormous. That works both ways, of course, and we’ve seen countless former darlings of Wall Street plummet 70% or 80% this year. That happens during bear markets, but the good news is that, from what I can tell, the bottom is already in, and I think there’s a very strong rally in front of us. Whether that rally has already begun, or may take a few more weeks to develop is yet to be seen, but I’ve been telling subscribers for weeks to position for more risk exposure, and I stand by that until proven otherwise.
That has implications for one’s portfolio, because one of the areas that has outperformed this year is dividend stocks. That happens because during weak periods, investors go defensive, and high-quality dividend stocks are certainly defensive. One ETF that is really an outstanding dividend product is the Schwab U.S. Dividend Equity ETF (NYSEARCA:SCHD), which we’ll highlight in this article.
We’ll first take a look at SCHD, what makes it tick, and why it’s outperformed this year. Then, I’ll explain why the time to own high-quality dividend stocks has passed, and why you want to instead own growth exposure.
What is SCHD?
In short, SCHD is a dividend ETF that seeks to track the Dow Jones U.S. Dividend 100 Index. That index is managed by S&P, and you can read all about it here. Basically, it is a large cap value dividend stock index, which is exactly the kind of stock that has outperformed in what has been a horrendous 2022 for the equity markets.
SCHD owns ~100 stocks, as the index name implies, and it is 100% invested. In other words, it isn’t actively managed where the fund is adding cash near peaks and buying at lows; it just invests 100% all the time.
SCHD has more than $30 billion in AUM, so it’s pretty large. It also is dirt cheap with an expense ratio of just six basis points; that’s almost free.
It also yields 3.4%, which is roughly double that of the S&P 500, so on this measure, it is attractive if you’re income focused.
Fund Factsheet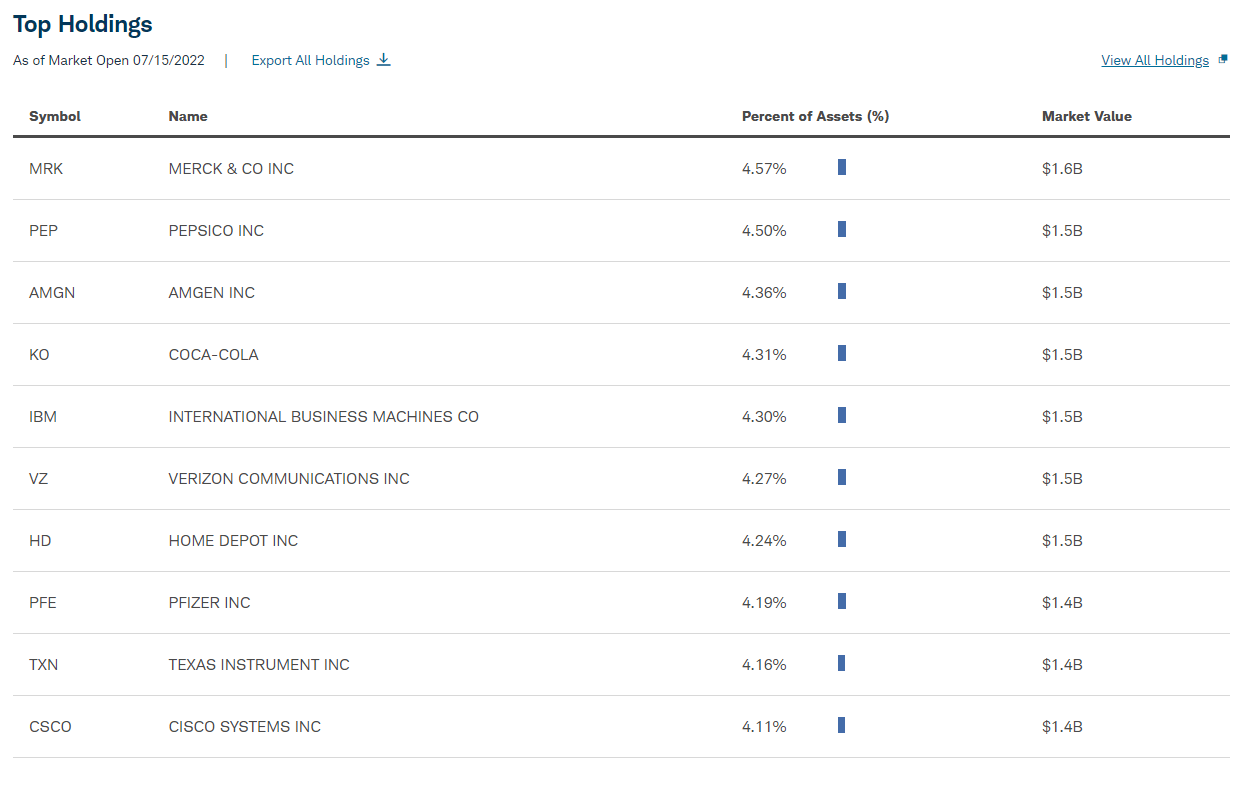
The holdings show us why this ETF has performed well this year; the top 10 is littered with companies with long-lived competitive advantages, good yields, and dividend growth prospects. We also have a decent mix of sectors here, so while I sound like a broken record, I’ll say it one more time; this is a really terrific dividend ETF if that’s your thing.
However, I’ll now make the argument that no matter how good the ETF is at achieving its stated purpose, it’s the wrong choice for the coming months. For me, SCHD at this point is a bit like a really great house in a really bad neighborhood.
Bull market incoming
As I detail in the article I linked to above, I think we’ve already seen THE bottom. Do we test the June low? Maybe. But I will be shocked if we break to a new low. The rotation I’m seeing from Wall Street suggests to me that the big money is betting on a rally later this year, and I’m advising subscribers to do the same thing. One thing that means is that we don’t want to own exposure to defensive sectors, but favor growth-oriented sectors as those will outperform during a market rally.
With that in mind, I’ll show here that I think SCHD has already broken down as a result of that rotation, and that Wall Street is telling you that this is not something that’s going to outperform any longer, at least not for the medium term.
Let’s start with a daily chart of SCHD.
StockCharts
The peak was made very early this year, and SCHD has drifted lower all year. In early June, however, when the rotations I mentioned started to happen, look what happened to SCHD; this is a large cap value dividend ETF, and it experienced a waterfall decline from $78 to $69 in a matter of a few days. That’s an enormous move for a product like this, and as I’ll show in a minute on the weekly chart, it represented what I believe to be a breakdown. We’ll come on to that, but let’s examine the rest of the daily chart.
I’ve circled an area where we may have a short-term bottom at ~$71. We’ve had three shots at it, and it has held each time. However, the bounces are getting progressively weaker, and are failing at the 20-day exponential moving average. In addition, momentum is weakening all the time, as measured by both the PPO and 14-day RSI. In other words, rather than $71 being a sustainable bottom, it looks to me like that’s simply a stop on the way down.
My view of the daily chart, then, is that we’re going to see more failures at the declining 20-day EMA, and that $71 will eventually break. That will lead to more selling, and market underperformance.
Now, let’s zoom out to the weekly view to show the breakdown I mentioned, as well as some relative strength measures that I think prove SCHD is not where you want to be in the coming months if you want to beat the market.
StockCharts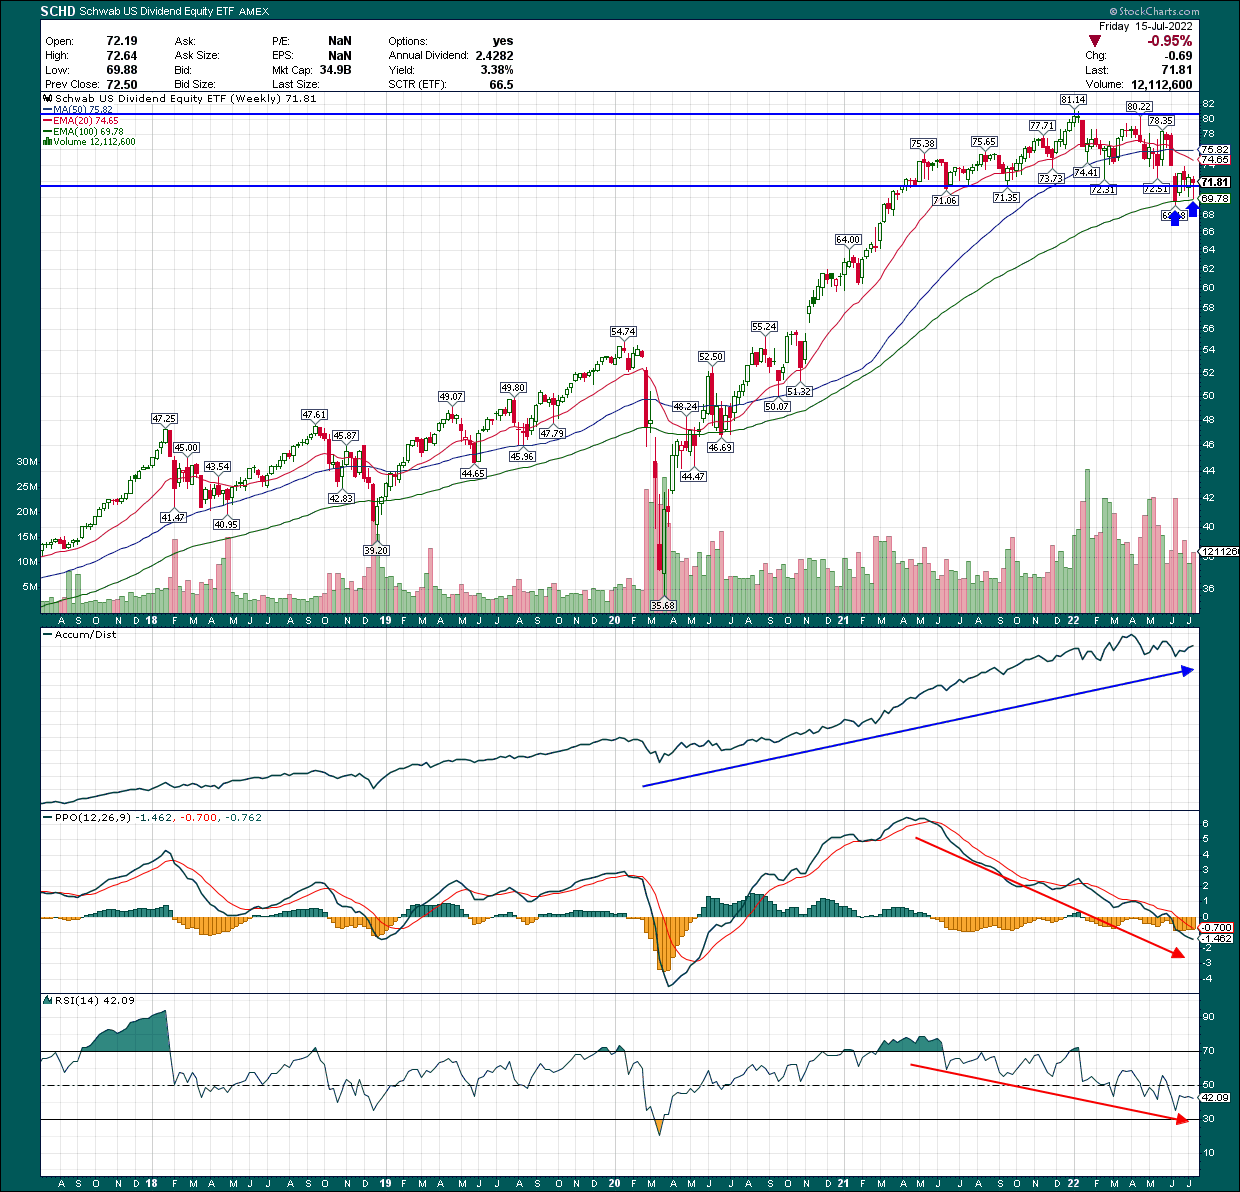
The horizontal lines I drew show the massive consolidation that took place from early-2021 to the summer of 2022, and it shows that the waterfall decline produced what certainly looks like a breakdown. The 20-week EMA has also crossed over the 50-week simple moving average in a bearish manner, but the 100-week EMA is thus far providing support. We’ll see if that holds, but my sense is that it won’t.
While the accumulation/distribution line looks great, we can see momentum continues to get weaker and weaker. Both the PPO and 14-week RSI are firmly in bearish territory, and given the price action, I have no reason to believe that’s going to improve anytime soon.
The breakdown on the weekly chart should be very concerning if you own this ETF, because the very long consolidation we saw should have produced an upside breakout after a huge bull run; it did the opposite and that’s quite bearish, to my eye.
Finally, below we have the same five-year weekly timeframe, but we have SCHD against the QQQ in the top panel, and raw price action of the QQQ in the bottom panel. I like to use QQQ as a proxy for growth stocks because it’s certainly growth-oriented, and it’s highly recognizable to even casual investors. You can use other growth proxies and get the same result as what we’re about to look at, so don’t focus on the fact that I’ve used QQQ; this is a SCHD versus growth conversation.
StockCharts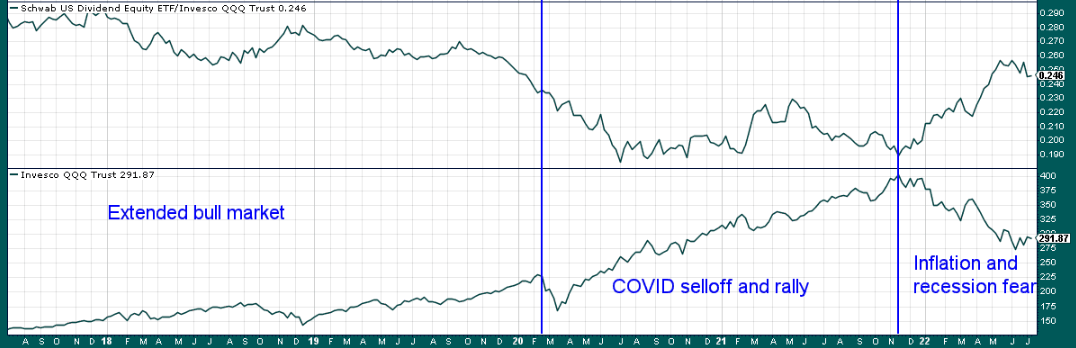
I’ve drawn vertical lines to delineate distinct market periods from the past five years, beginning with the long bull market we had leading up to COVID. Remember that we had a slow burn bull market where we just sort of drifted higher for long periods of time. Volatility was low, and life was good. Notice that while the growth stocks went a lot higher leading up to 2020, SCHD underperformed the whole way, apart from brief episodes of selling in the broader market. Like I said above, you’d expect that as bull markets create winners in growth, as Wall Street rotates money into growth sectors, because that’s where the best returns are.
Now, let’s look at the middle section where we get the COVID selloff and rally. What’s very, very interesting to me is that SCHD underperformed even as the selling was taking place. It is as though Wall Street was already one step ahead and positioning for the absolutely epic rally we were about to see. At any rate, SCHD underperformed during this period, even though absolute price action looked great for SCHD.
The final panel, where Wall Street became worried about inflation and recession, shows that SCHD has been a huge winner on a relative basis. We’ve seen that it hasn’t been great on an absolute basis, but certainly has trounced growth-oriented sectors. However, if I’m right and the bottom is in, we’ll see rotation out of stocks like what SCHD holds, and back into growth.
This is a chart of SCHD’s relative strength to growth stocks, and you’ll have a hard time convincing me that rotation isn’t already underway.
StockCharts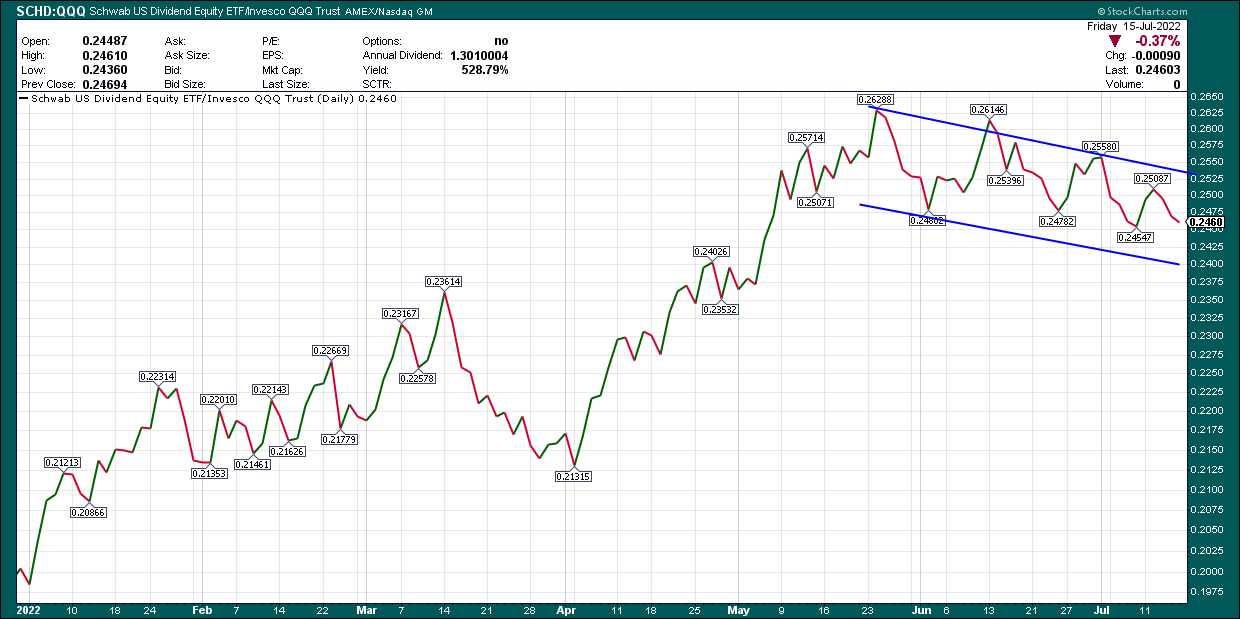
We see the massive outperformance of SCHD, but starting in May, growth has outperformed. Given all we’ve looked at here, I think that’s just the tip of the iceberg, and that growth sectors will destroy SCHD on a relative basis in the months to come.
With that in mind, while SCHD is a great product, it’s the wrong kind of product to own now. The time for dividend stocks has passed, and I would urge you to consider unloading these in favor of more growth exposure. Wall Street is telling you the time to own defensive stocks was eight months ago, and now, we’re back to bull market mode.
Be the first to comment