

jittawit.21
REIT Performance
The REIT sector extended 2022 losses with another rough month as REITs averaged a -9.44% total return in June. REITs underperformed the Dow Jones Industrial Average (-6.71%), the S&P 500 (-8.39%) and the NASDAQ (-8.71%). The market cap weighted Vanguard Real Estate ETF (VNQ) saw smaller losses than the average REIT in June (-7.46% vs. -9.44%) but remains deeper in the red YTD (-20.54% vs. -17.98%). The spread between the 2022 FFO multiples of large cap REITs (19.4x) and small cap REITs (14.4x) narrowed slightly in June as multiples decreased by 1.5 turns for large caps and 1.4 turn for small caps. In this monthly publication, I will provide REIT data on numerous metrics to help readers identify which property types and individual securities currently offer the best opportunities to achieve their investment goals.
Graph by Simon Bowler of 2nd Market Capital, Data compiled from S&P Global Market Intelligence LLC.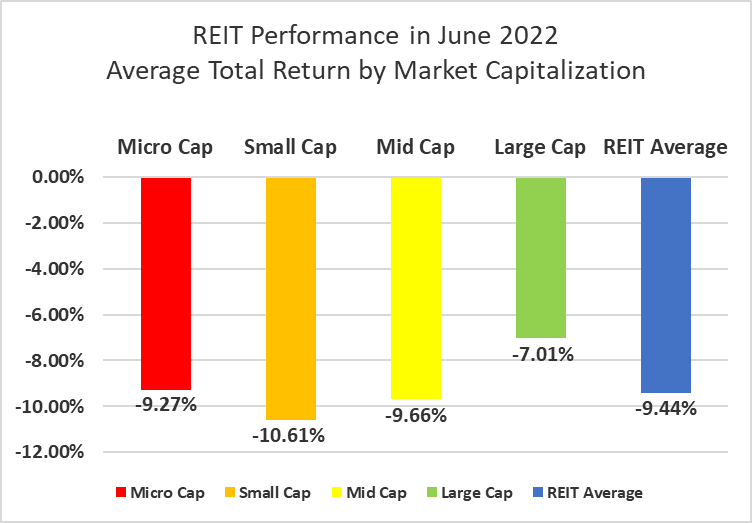
Large cap (-7.01%) and micro cap (-9.27%) and mid cap REITs (-9.66%) saw single-digit negative returns in June. Small cap REITs (-10.61%) underperformed and averaged double-digit declines. Large cap REITs (-16.63%) are outperforming small caps (-17.61%) by 98 basis points on YTD 2022 total return.
Graph by Simon Bowler of 2nd Market Capital, Data compiled from S&P Global Market Intelligence LLC.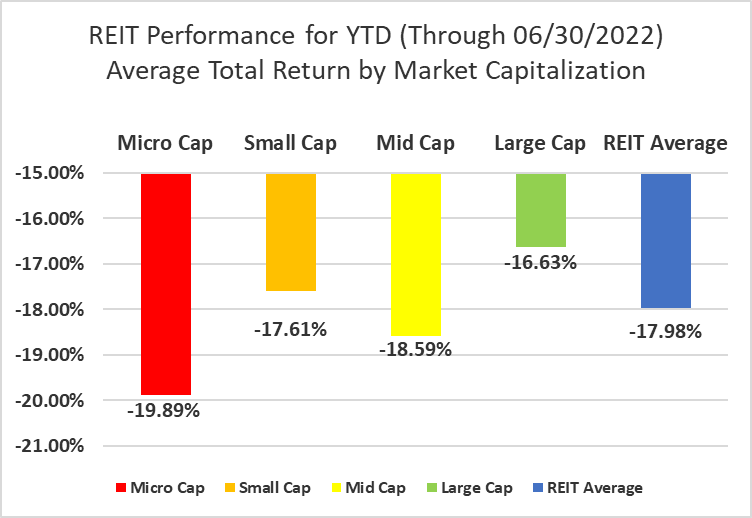
0 out of 19 Property Types Yielded Positive Total Returns in June
100 percent of REIT property types averaged a negative total return in June, with a 26.71% total return spread between the best and worst performing property types. Mall (-27.53%) and Land (-15.25%) REITs had the worst average total returns in June. Performance YTD within Land REITs has varied greatly. Safehold (SAFE), which started the year at a 44.61x FFO multiple, had a dismal -55.35% total return over the first 6 months of 2022 and now trades at a 19.3x multiple. Farmland Partners (FPI), which started the year at a 33.5x multiple has defied the selloff and achieved a +16.41% return YTD and now trades at a remarkable 48.14x multiple.
Student Housing (-0.82%) and Casino (-1.41%) REITs led all property types in June as all other property types were hit harder by the market selloff. Over the first half of the year, Student Housing (+13.55%) and Casino (+0.64%) REITs were the property types in positive territory.
Table by Simon Bowler of 2nd Market Capital, Data compiled from S&P Global Market Intelligence LLC.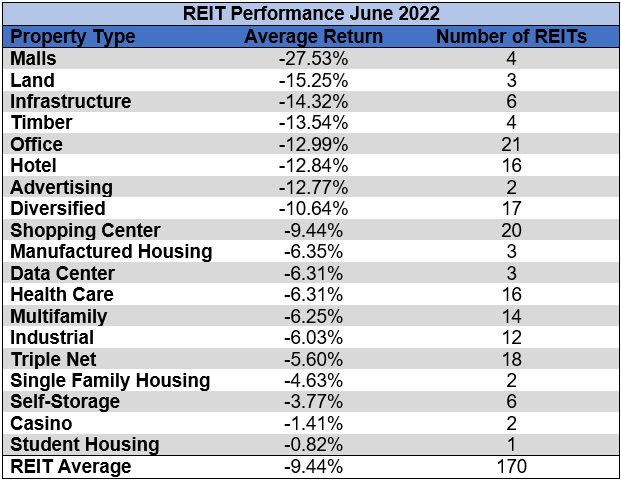
Student Housing (+13.55%) and Casino REITs (+0.64%) are the top performing property types over the first half of the year. Malls (-47.55%) and Advertising (-30.44%) REITs are the worst performing property types thus far in 2022. All 4 Mall REITs are deep in the red in 2022, ranging from CBL & Associates Properties (CBL) at -24.71% to Pennsylvania REIT (PEI) at -78.10%.
Table by Simon Bowler of 2nd Market Capital, Data compiled from S&P Global Market Intelligence LLC.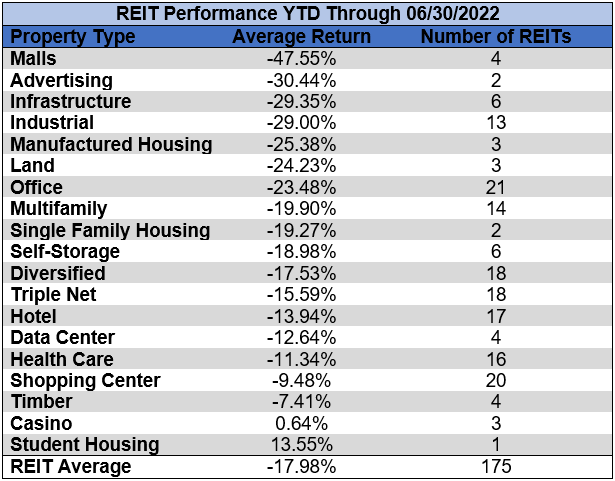
The REIT sector as a whole saw the average P/FFO (2022) decrease 1.2 turns in June (from 16.6x down to 15.4x). The average FFO multiples rose for 5% and declined for 95% of property types in June. There are no recent 2022 FFO/share estimates for either of the Advertising REITs. Land (32.1x), Student Housing (26.1x), Industrial (22.9x) and Data Center (22.8x) currently trade at the highest multiples of any REIT property type. Mall (4.5x), Hotel (8.3x) and Office (9x) REITs are the only property types currently trading at a single digit multiple.
Table by Simon Bowler of 2nd Market Capital, Data compiled from S&P Global Market Intelligence LLC.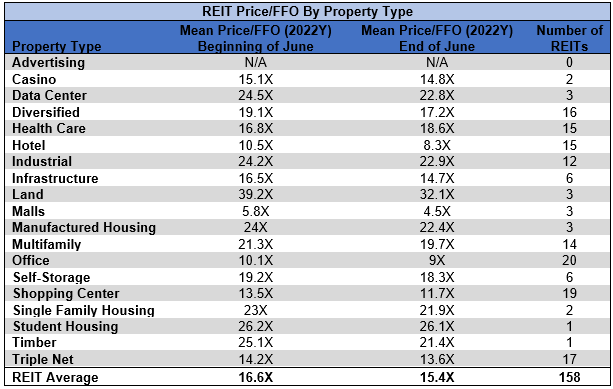
Performance of Individual Securities
Preferred Apartment Communities (APTS) was acquired on June 23rd by Blackstone’s (BX) REIT (often referred to as BREIT). APTS shareholders received $25/share in this all-cash purchase.
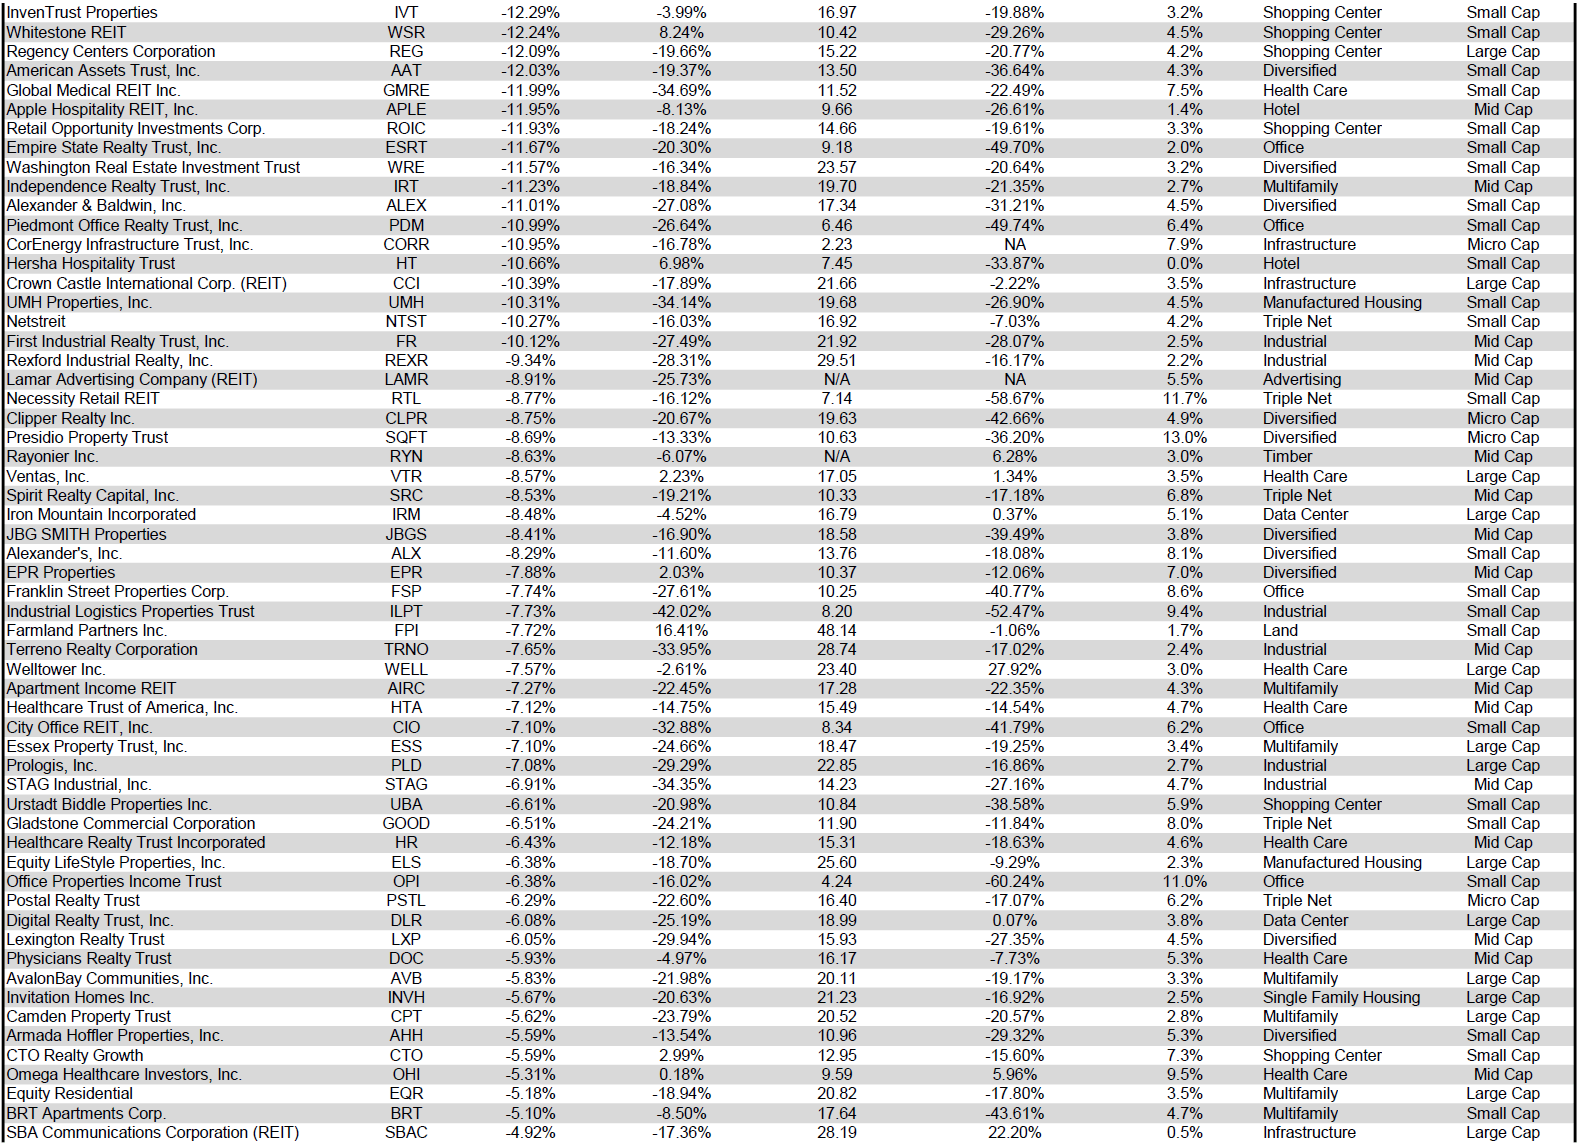
InnSuites Hospitality Trust’s (IHT) (+38.46%) share price remained highly volatile in June, even though it was a period in which the REIT did not announce any significant news. Over the first half of 2022, IHT has seen positive returns in 3 months (ranging between +32.43% and +38.46%) and negative returns in 3 months (ranging between -17.05% and -22.19%), with no month seeing a price change smaller than 17%.
Pennsylvania REIT (PEI) (-51.45%) continues to freefall due to balance sheet concerns. PEI is selling off assets to stay current on interest payments and reduce debt, but the dispositions are taking longer than initially projected and the debt reduction thus far has been a tiny fraction of total debt. PEI is already down -78.1% YTD and on June 16th, PEI executed a 1-for-15 reverse stock split to regain compliance with NYSE standards pertaining to minimum share price.
Only 10.00% of REITs had a positive return in June with only 16.00% in the black year to date. During the first half of last year the average REIT had a +25.92% return, whereas this year the average REIT has seen a -17.98% decline.
Table by Simon Bowler of 2nd Market Capital, Data compiled from S&P Global Market Intelligence LLC. Table by Simon Bowler of 2nd Market Capital, Data compiled from S&P Global Market Intelligence LLC. Table by Simon Bowler of 2nd Market Capital, Data compiled from S&P Global Market Intelligence LLC. 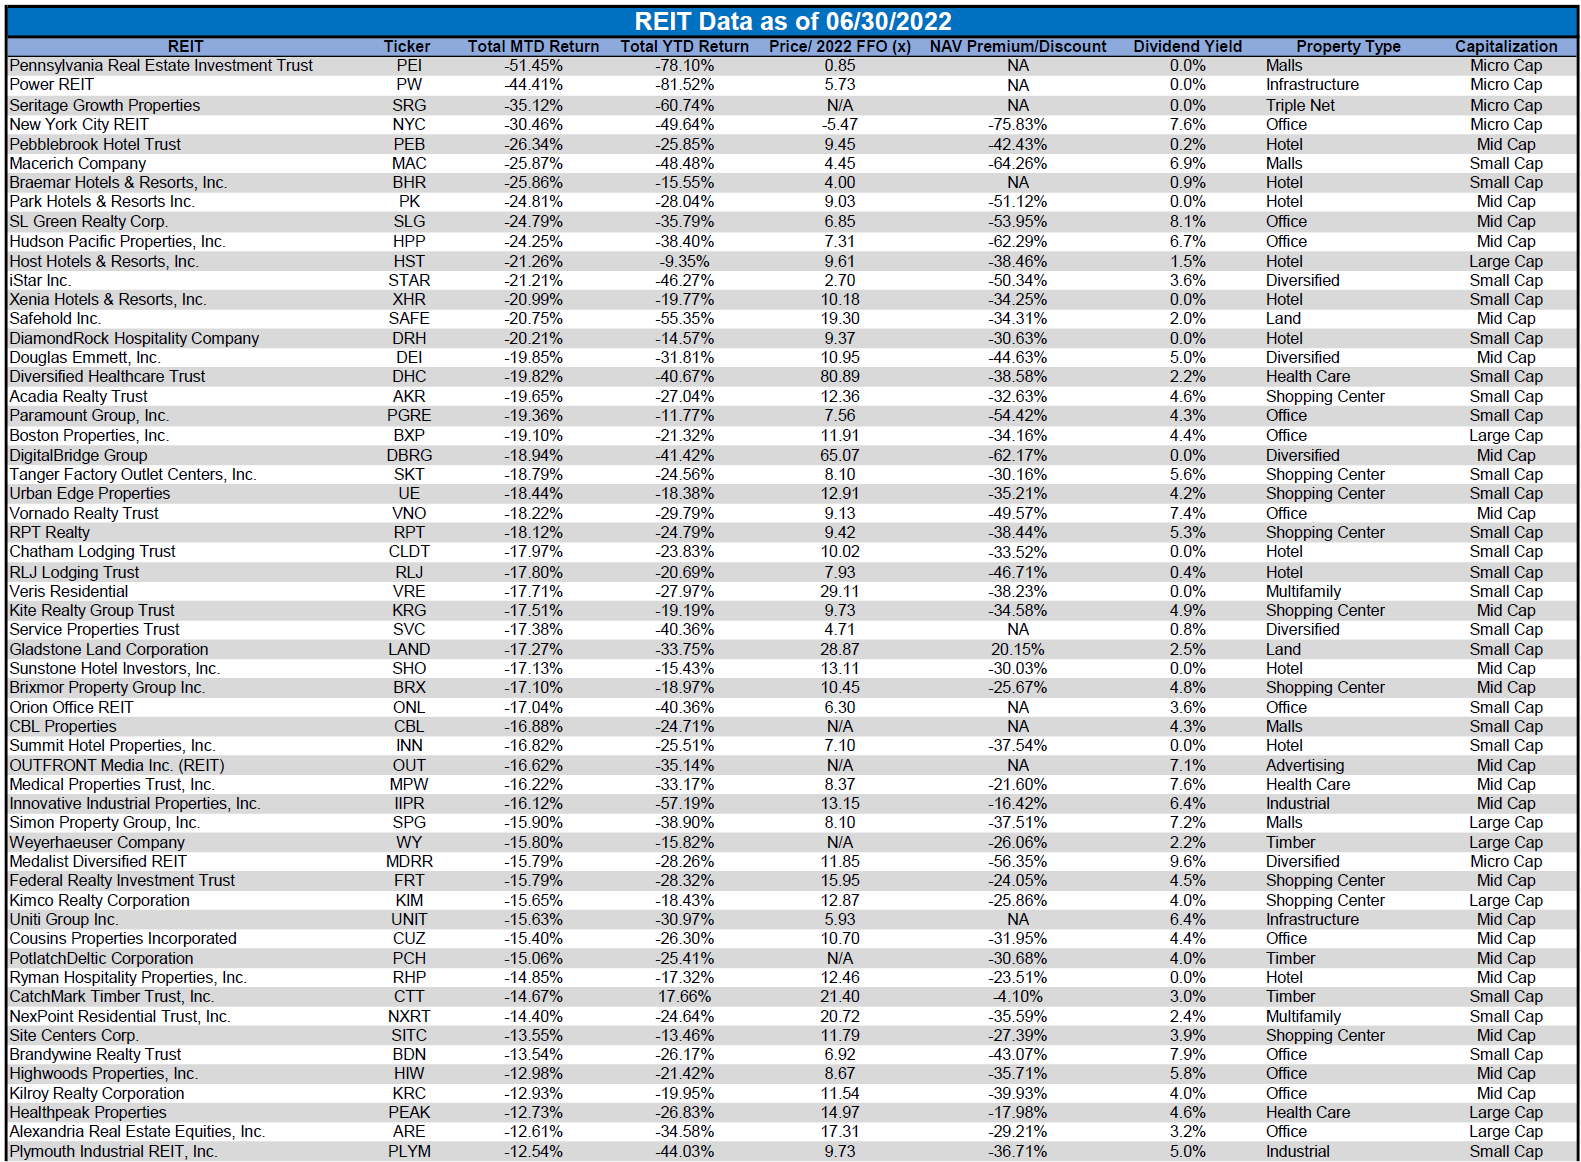
For the convenience of reading this table in a larger font, the table above is available as a PDF as well.
Dividend Yield
Dividend yield is an important component of a REIT’s total return. The particularly high dividend yields of the REIT sector are, for many investors, the primary reason for investment in this sector. As many REITs are currently trading at share prices well below their NAV, yields are currently quite high for many REITs within the sector. Although a particularly high yield for a REIT may sometimes reflect a disproportionately high risk, there exist opportunities in some cases to capitalize on dividend yields that are sufficiently attractive to justify the underlying risks of the investment. I have included below a table ranking equity REITs from highest dividend yield (as of 06/30/2022) to lowest dividend yield.
Table by Simon Bowler of 2nd Market Capital, Data compiled from S&P Global Market Intelligence LLC. Table by Simon Bowler of 2nd Market Capital, Data compiled from S&P Global Market Intelligence LLC. Table by Simon Bowler of 2nd Market Capital, Data compiled from S&P Global Market Intelligence LLC. Table by Simon Bowler of 2nd Market Capital, Data compiled from S&P Global Market Intelligence LLC. 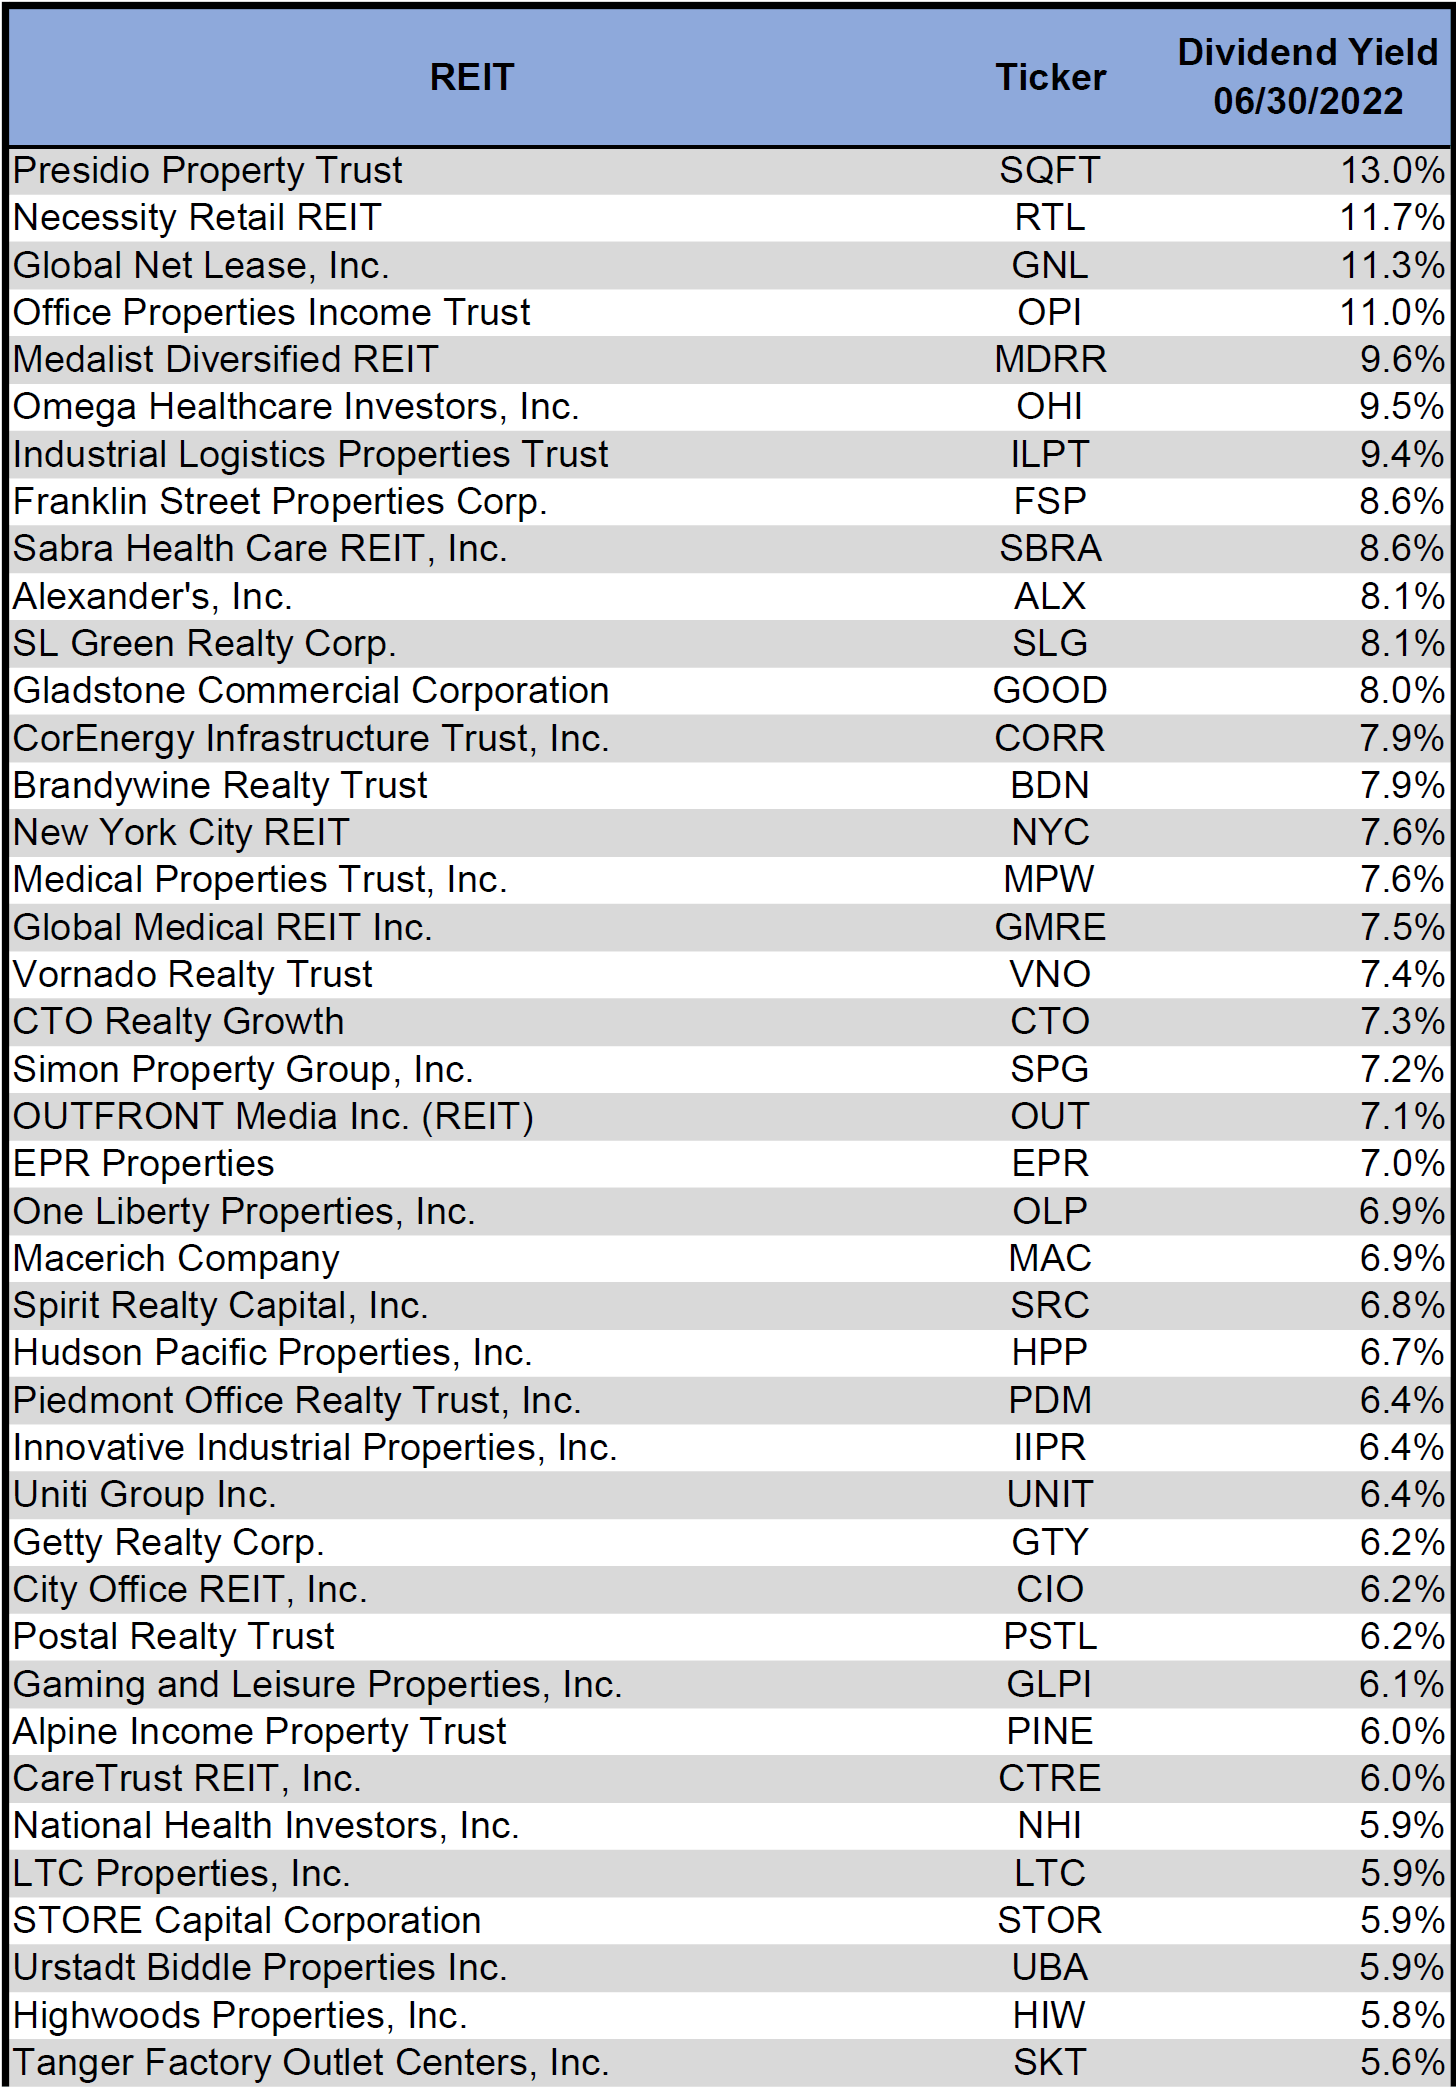
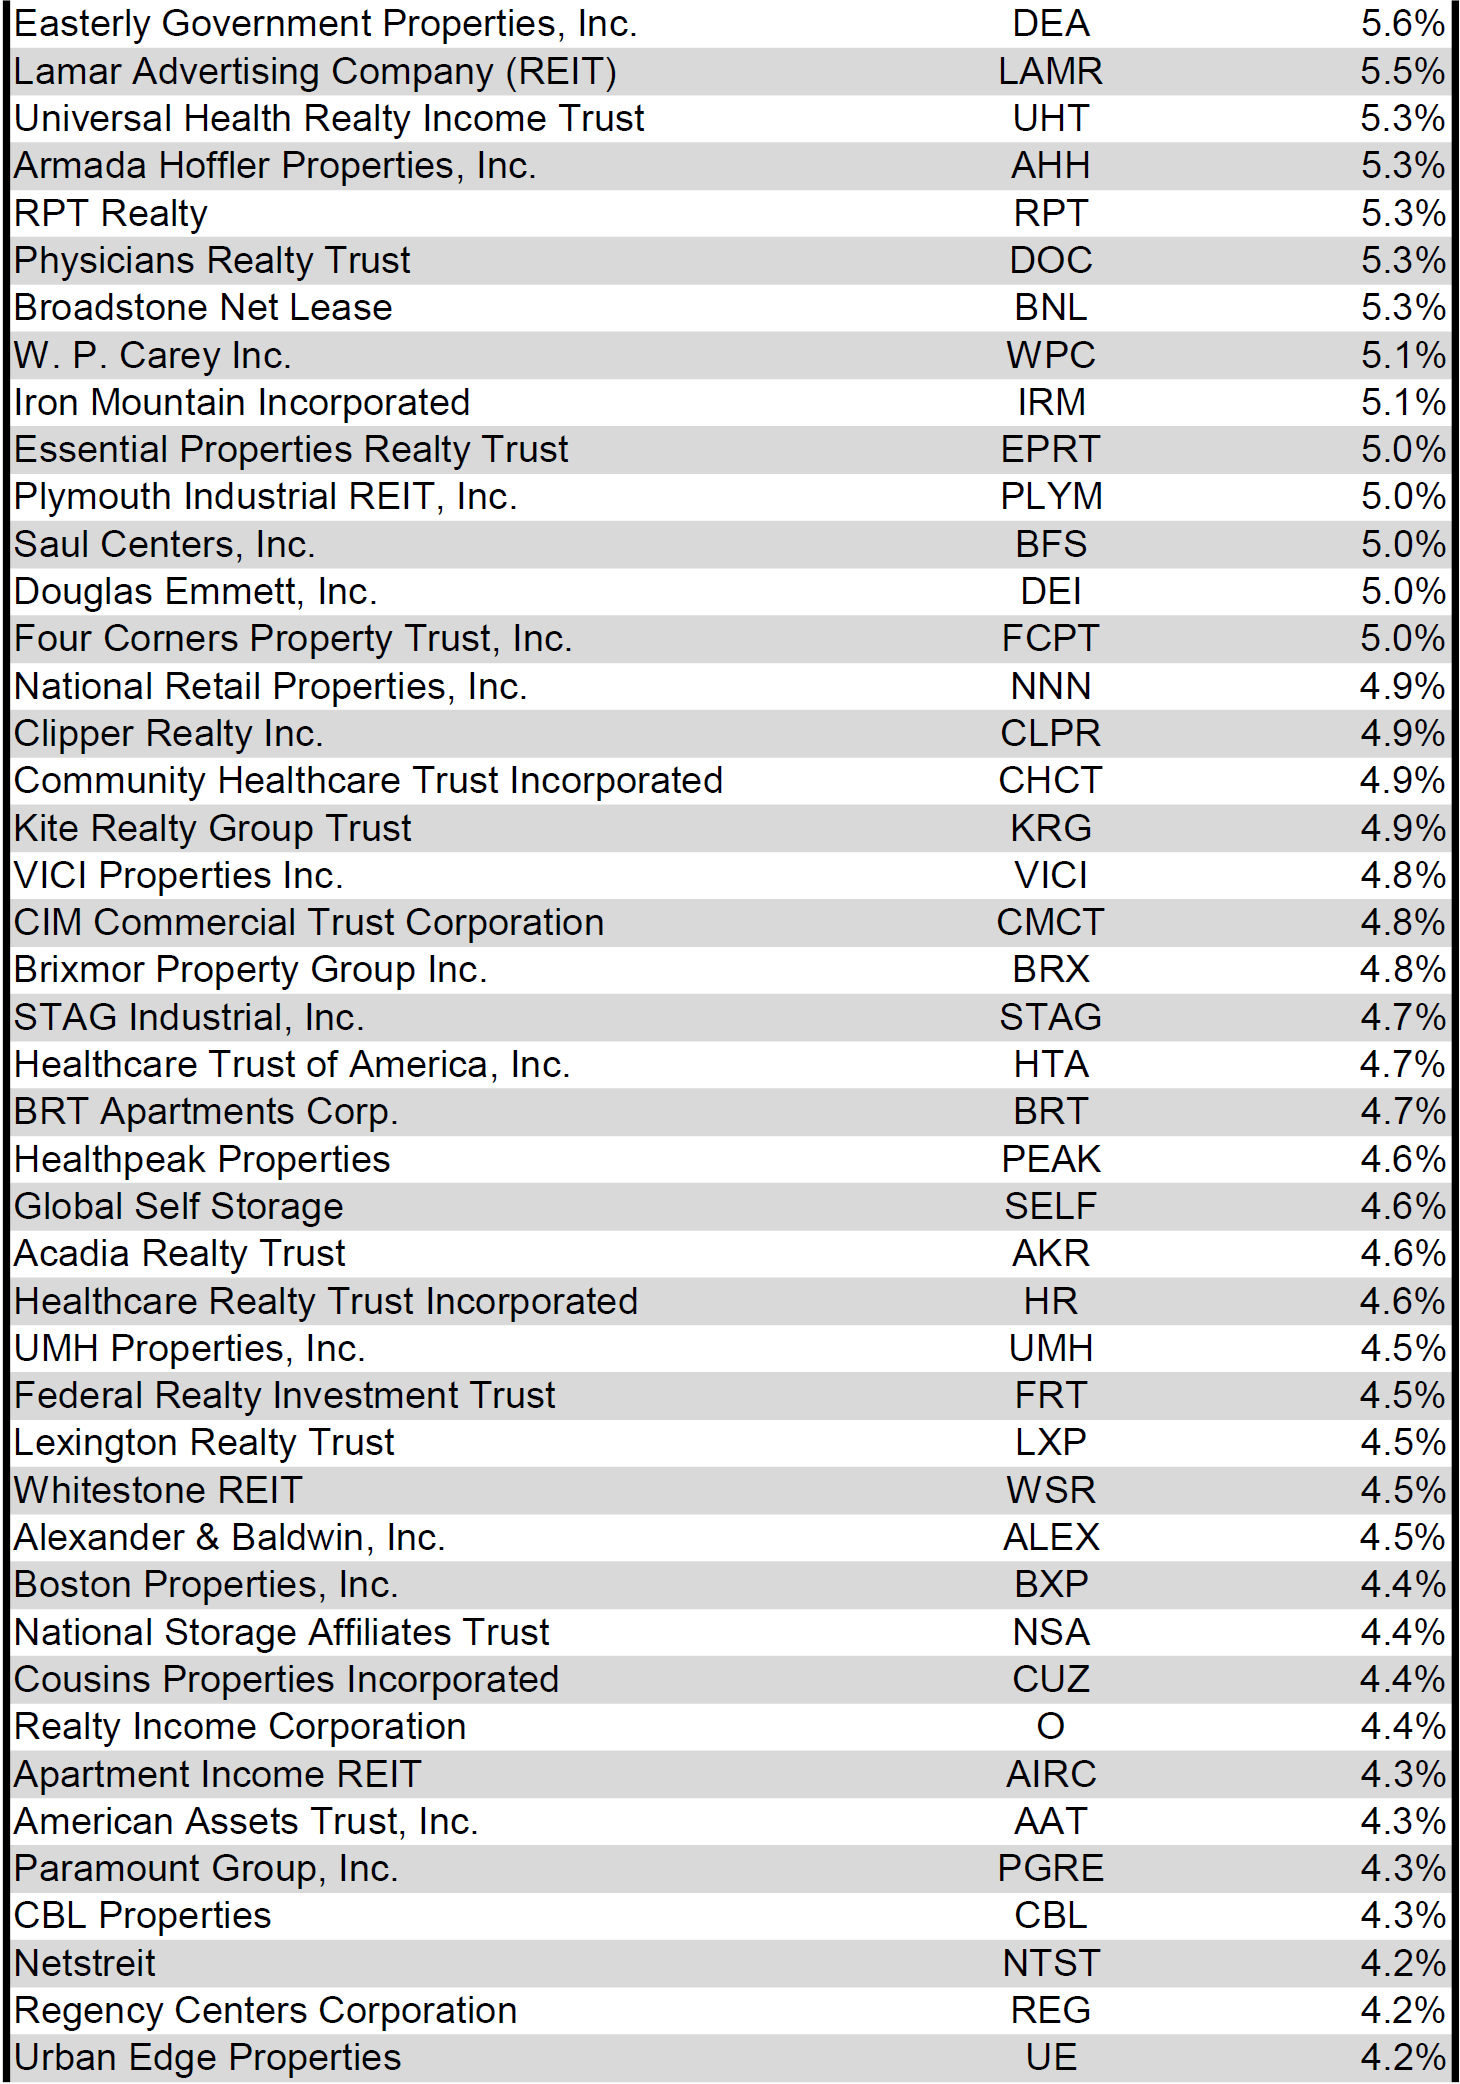
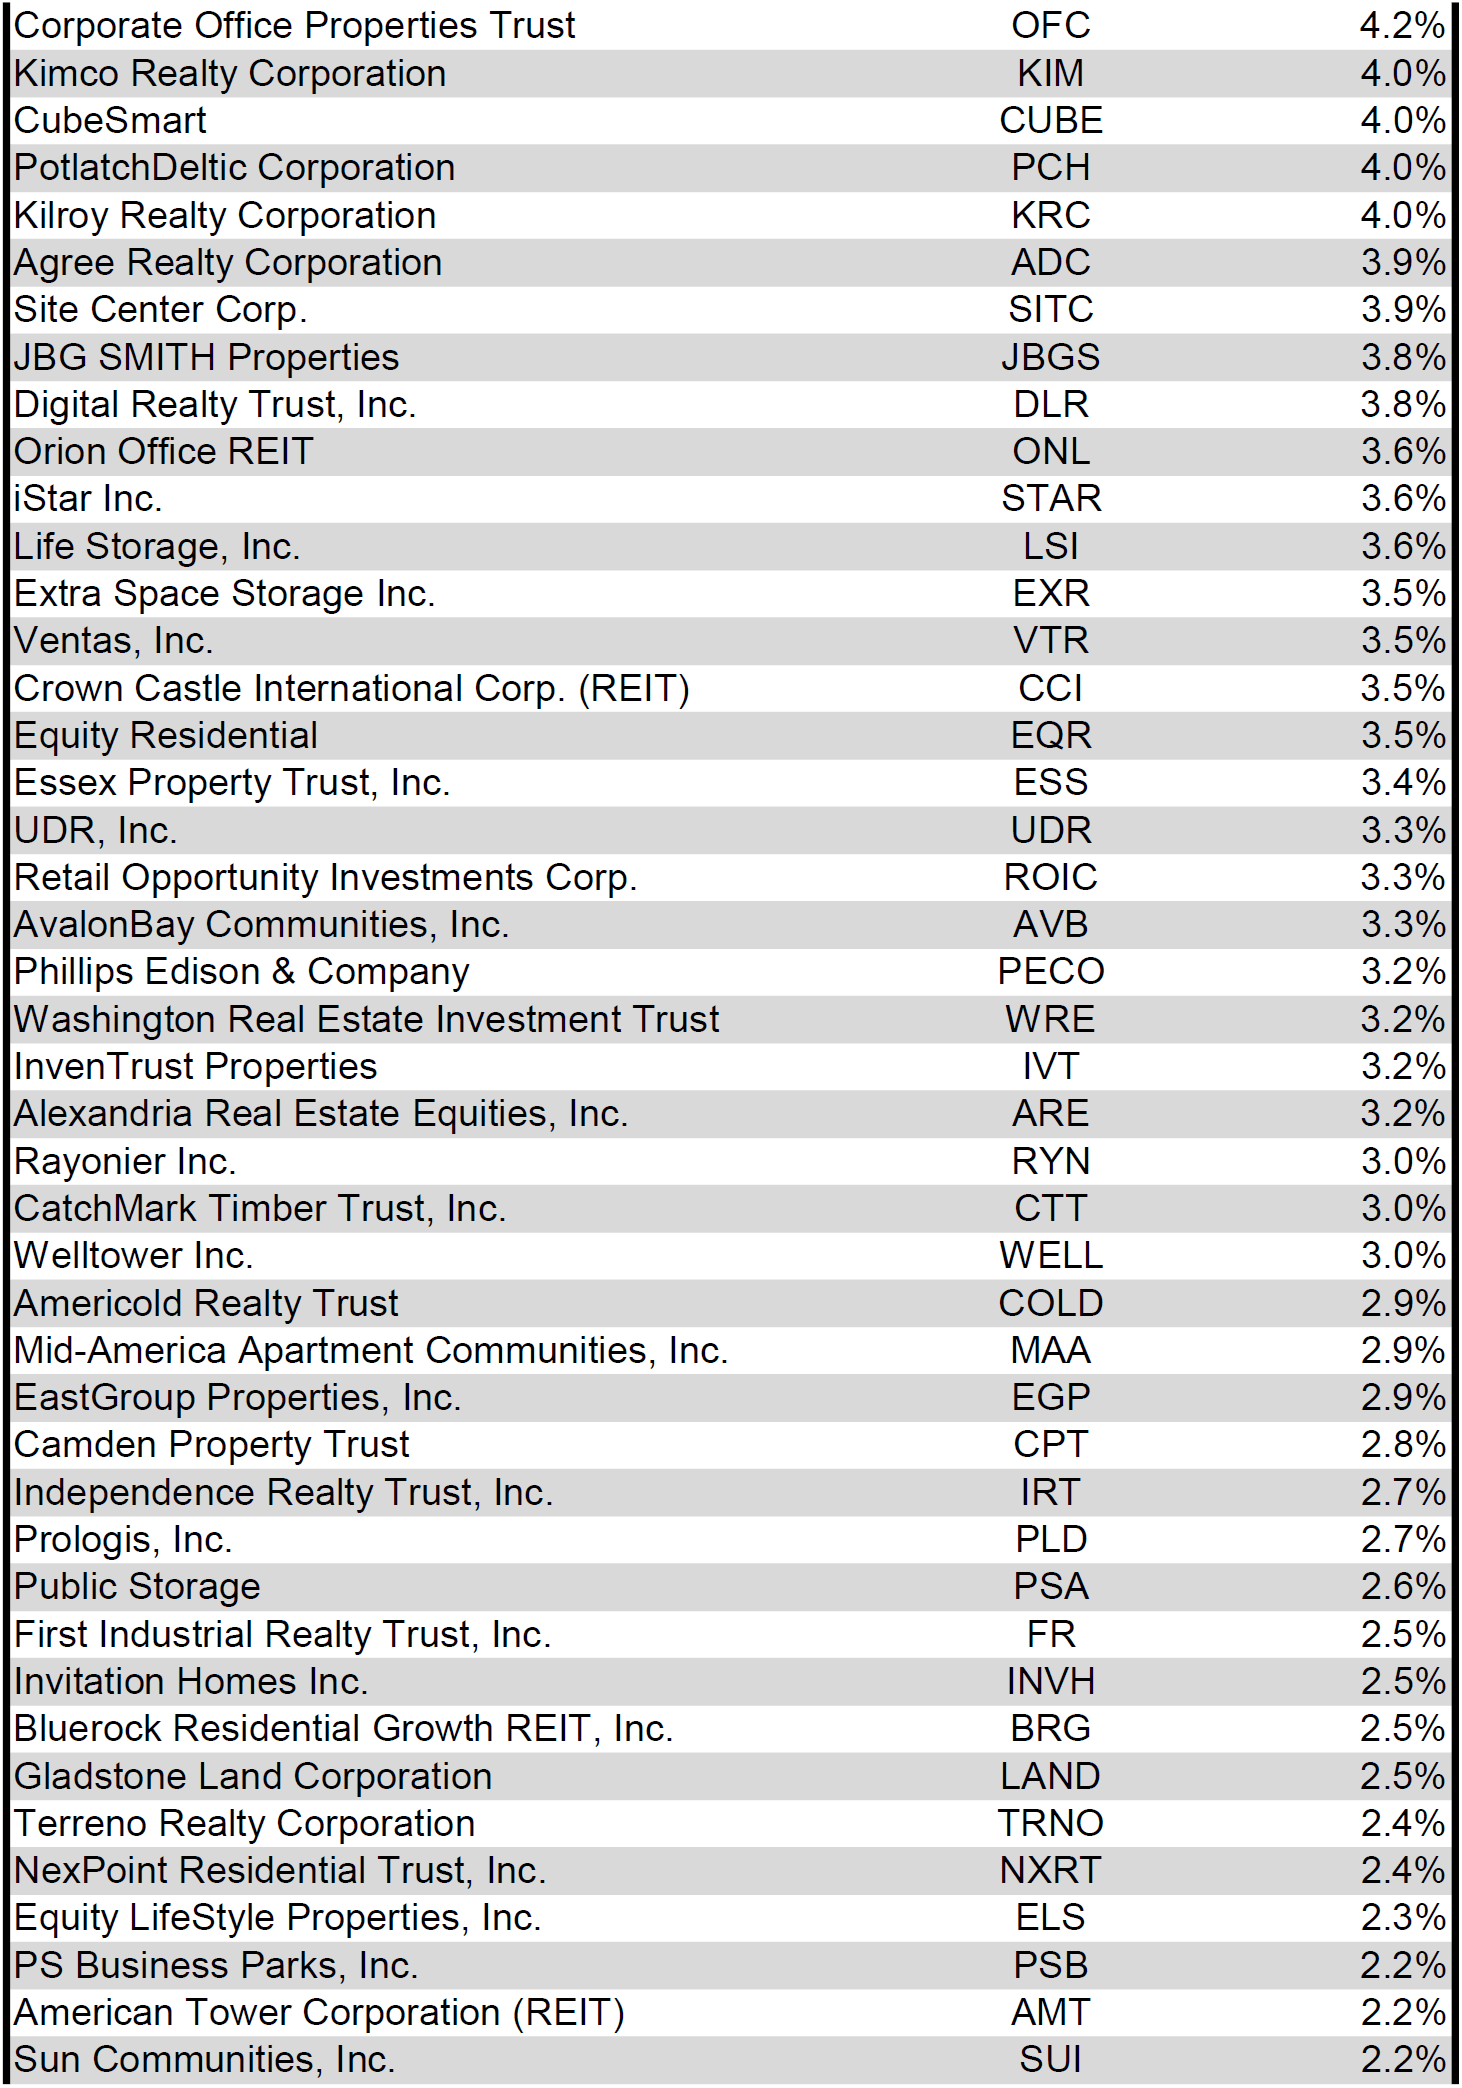
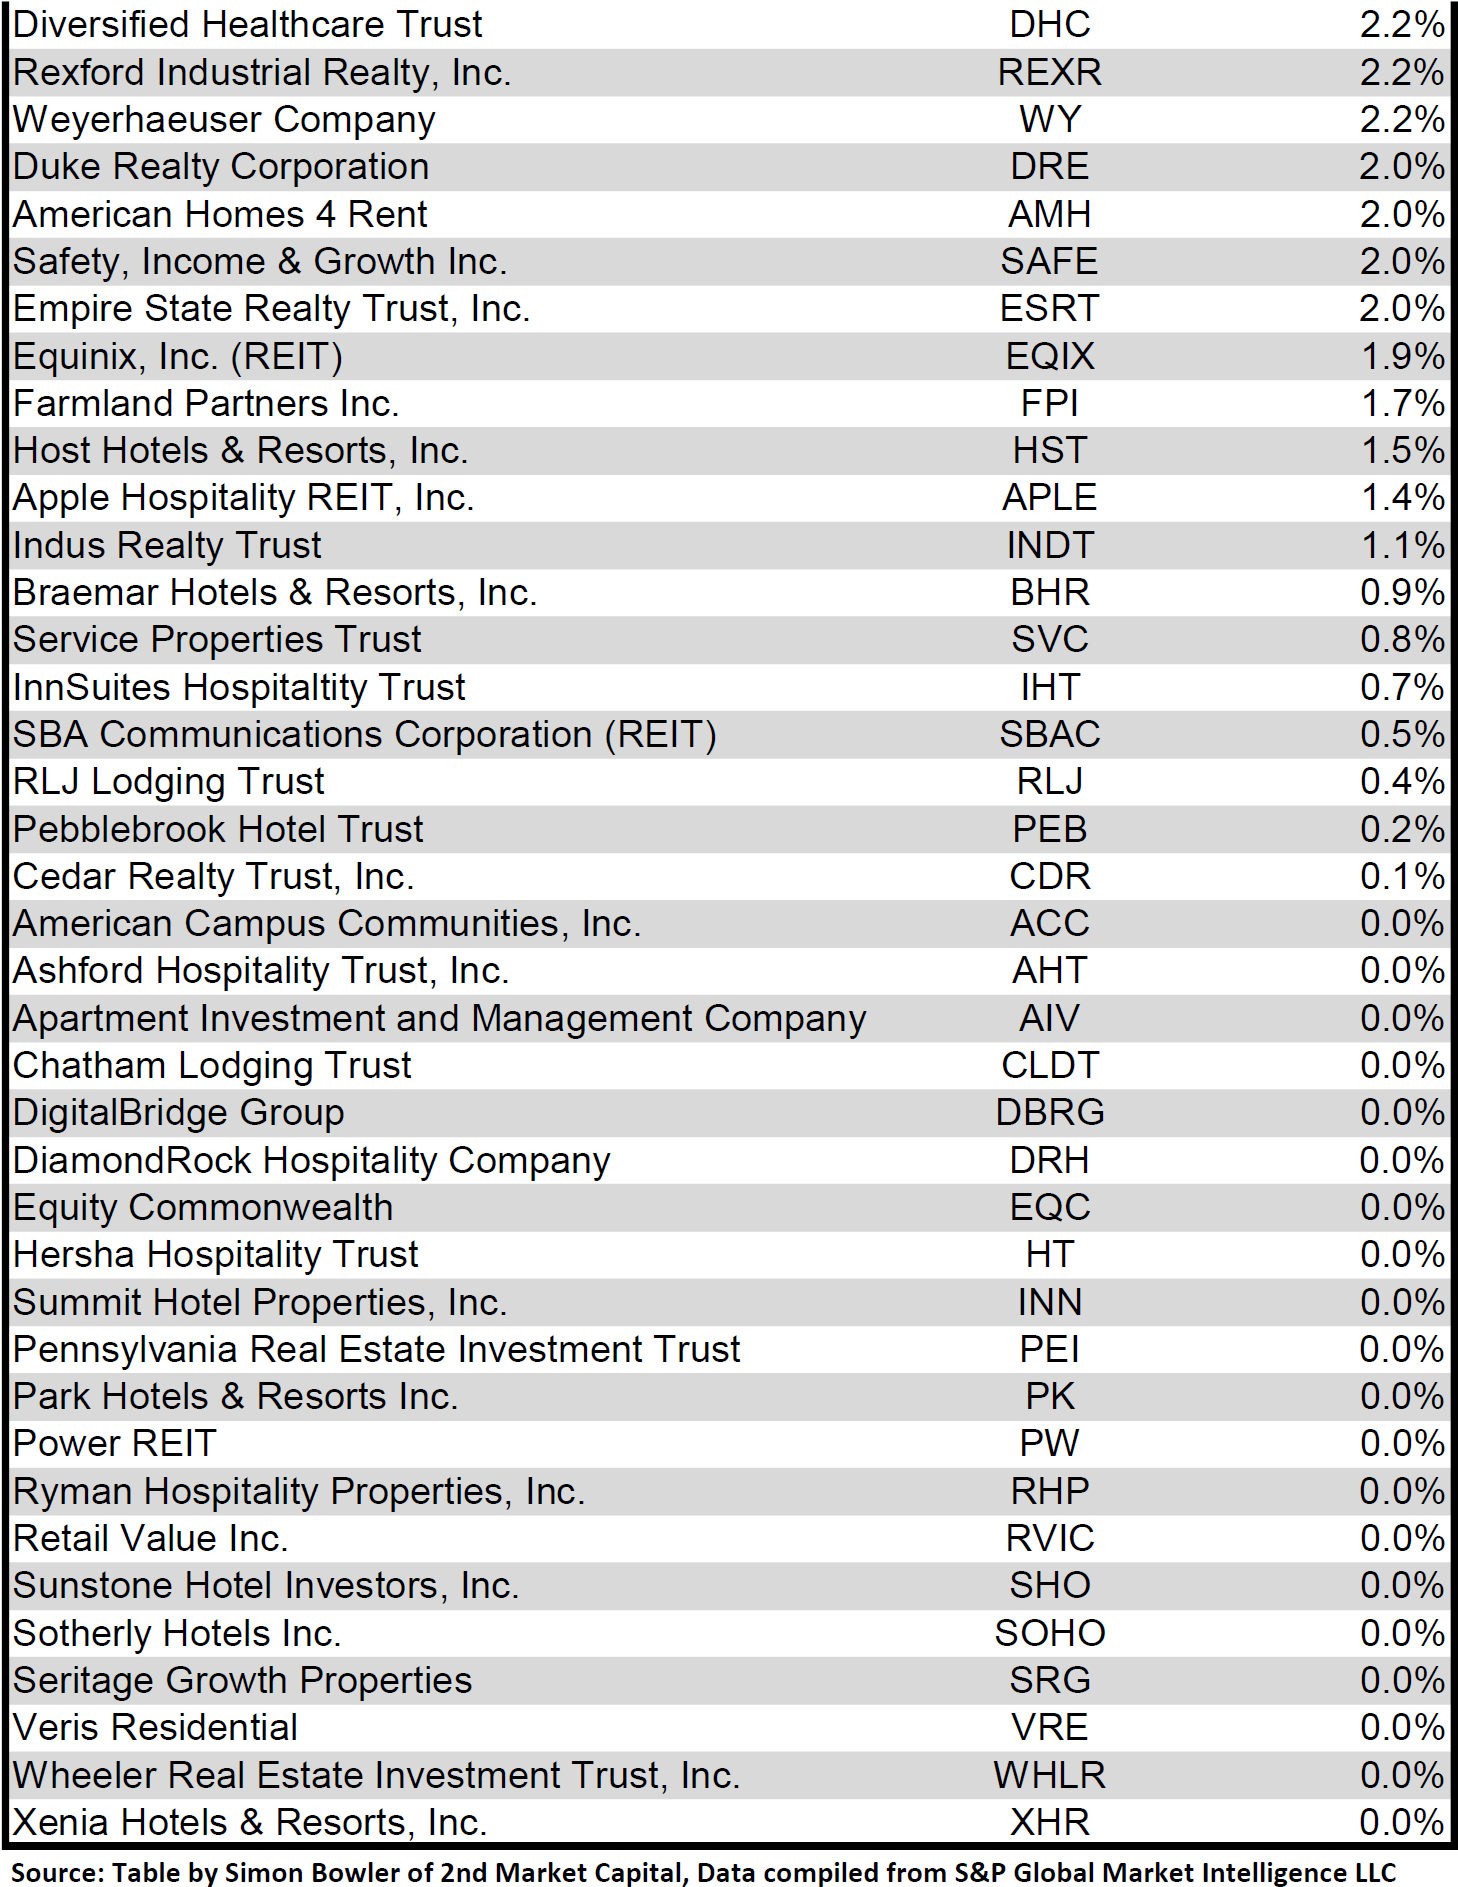
For the convenience of reading this table in a larger font, the table above is available as a PDF as well.
Although a REIT’s decision regarding whether to pay a quarterly dividend or a monthly dividend does not reflect on the quality of the company’s fundamentals or operations, a monthly dividend allows for a smoother cash flow to the investor. Below is a list of equity REITs that pay monthly dividends ranked from highest yield to lowest yield.
Table by Simon Bowler of 2nd Market Capital, Data compiled from S&P Global Market Intelligence LLC. 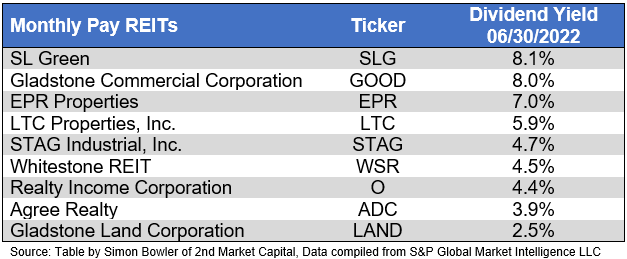
Valuation
REIT Premium/Discount to NAV by Property Type
Below is a downloadable data table, which ranks REITs within each property type from the largest discount to the largest premium to NAV. The consensus NAV used for this table is the average of analyst NAV estimates for each REIT. Both the NAV and the share price will change over time, so I will continue to include this table in upcoming issues of The State of REITs with updated consensus NAV estimates for each REIT for which such an estimate is available.
Table by Simon Bowler of 2nd Market Capital, Data compiled from S&P Global Market Intelligence LLC. Table by Simon Bowler of 2nd Market Capital, Data compiled from S&P Global Market Intelligence LLC. Table by Simon Bowler of 2nd Market Capital, Data compiled from S&P Global Market Intelligence LLC. Table by Simon Bowler of 2nd Market Capital, Data compiled from S&P Global Market Intelligence LLC. 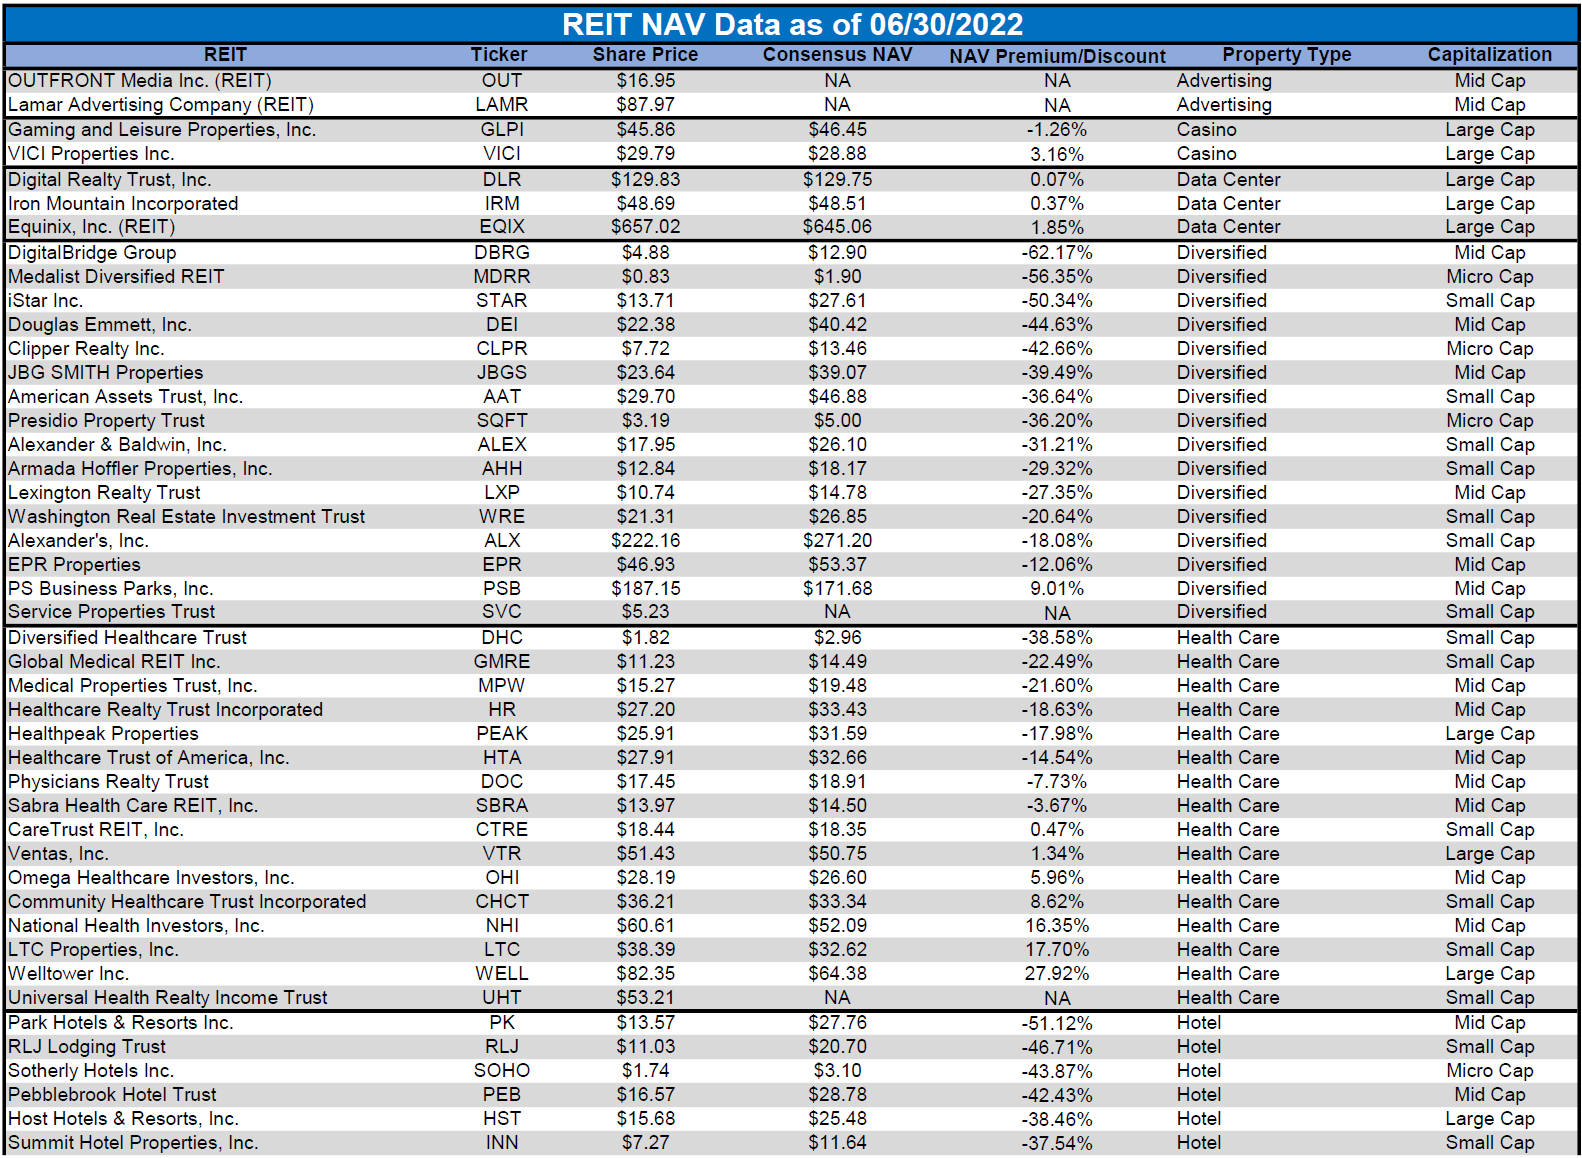
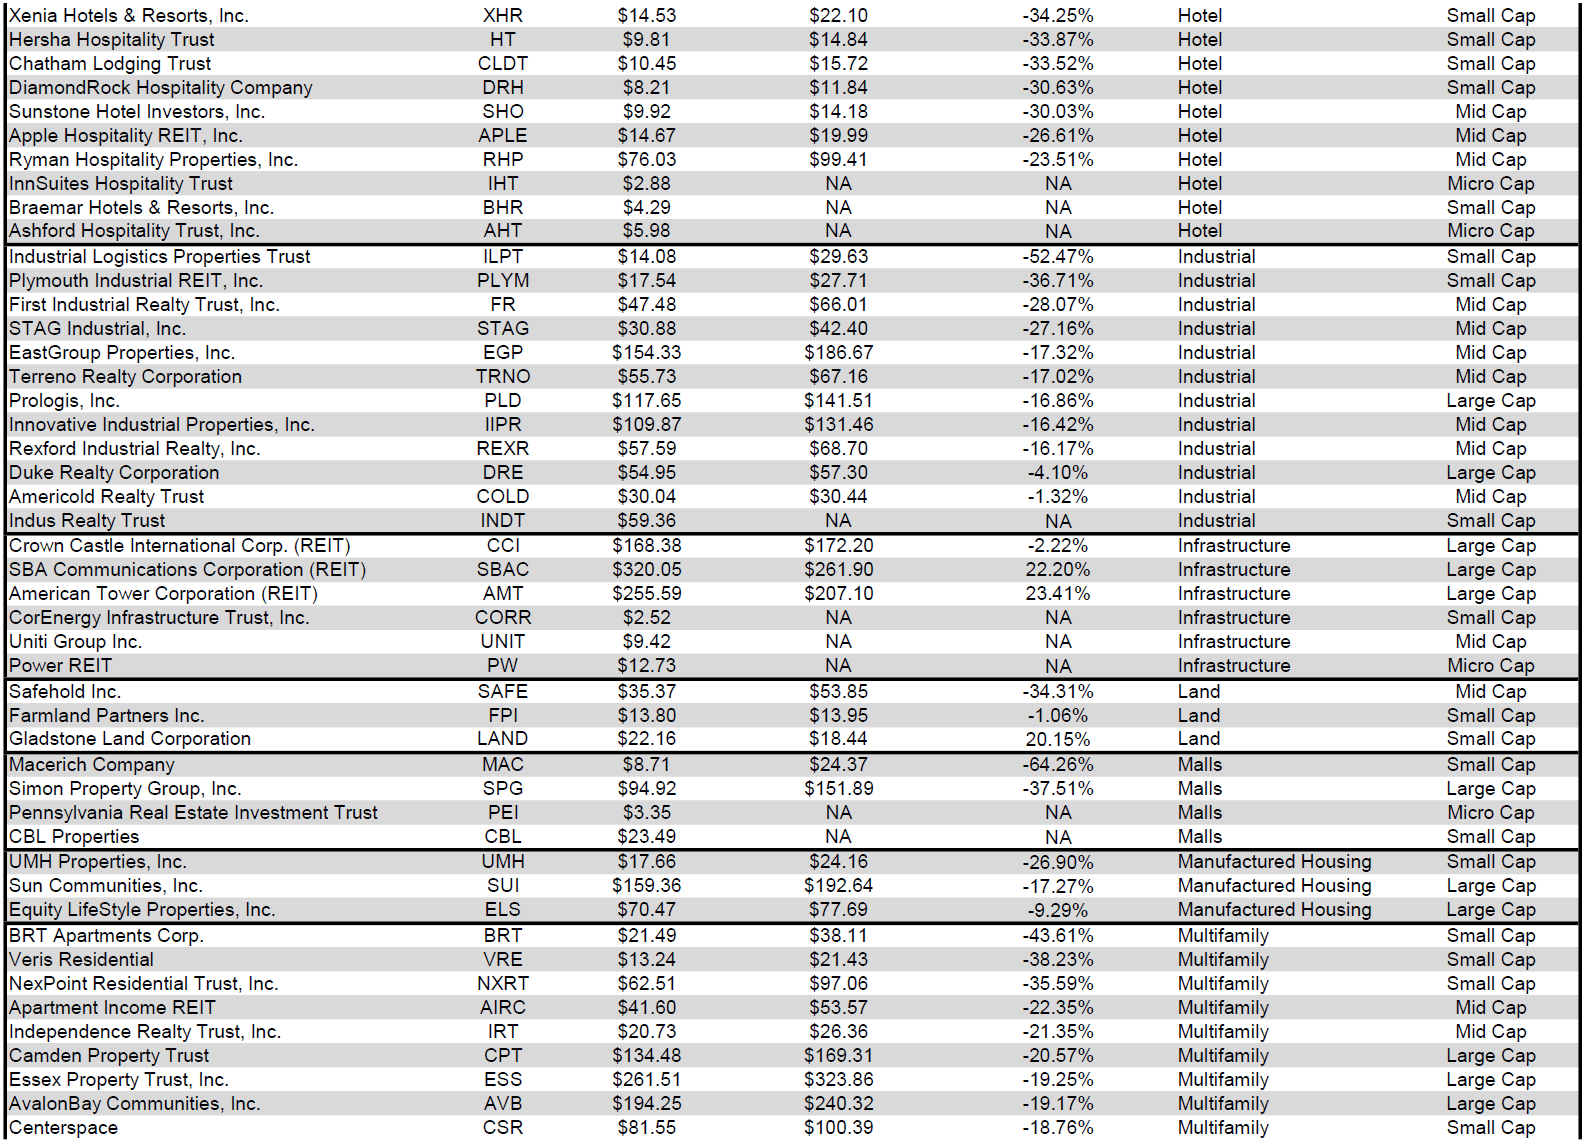
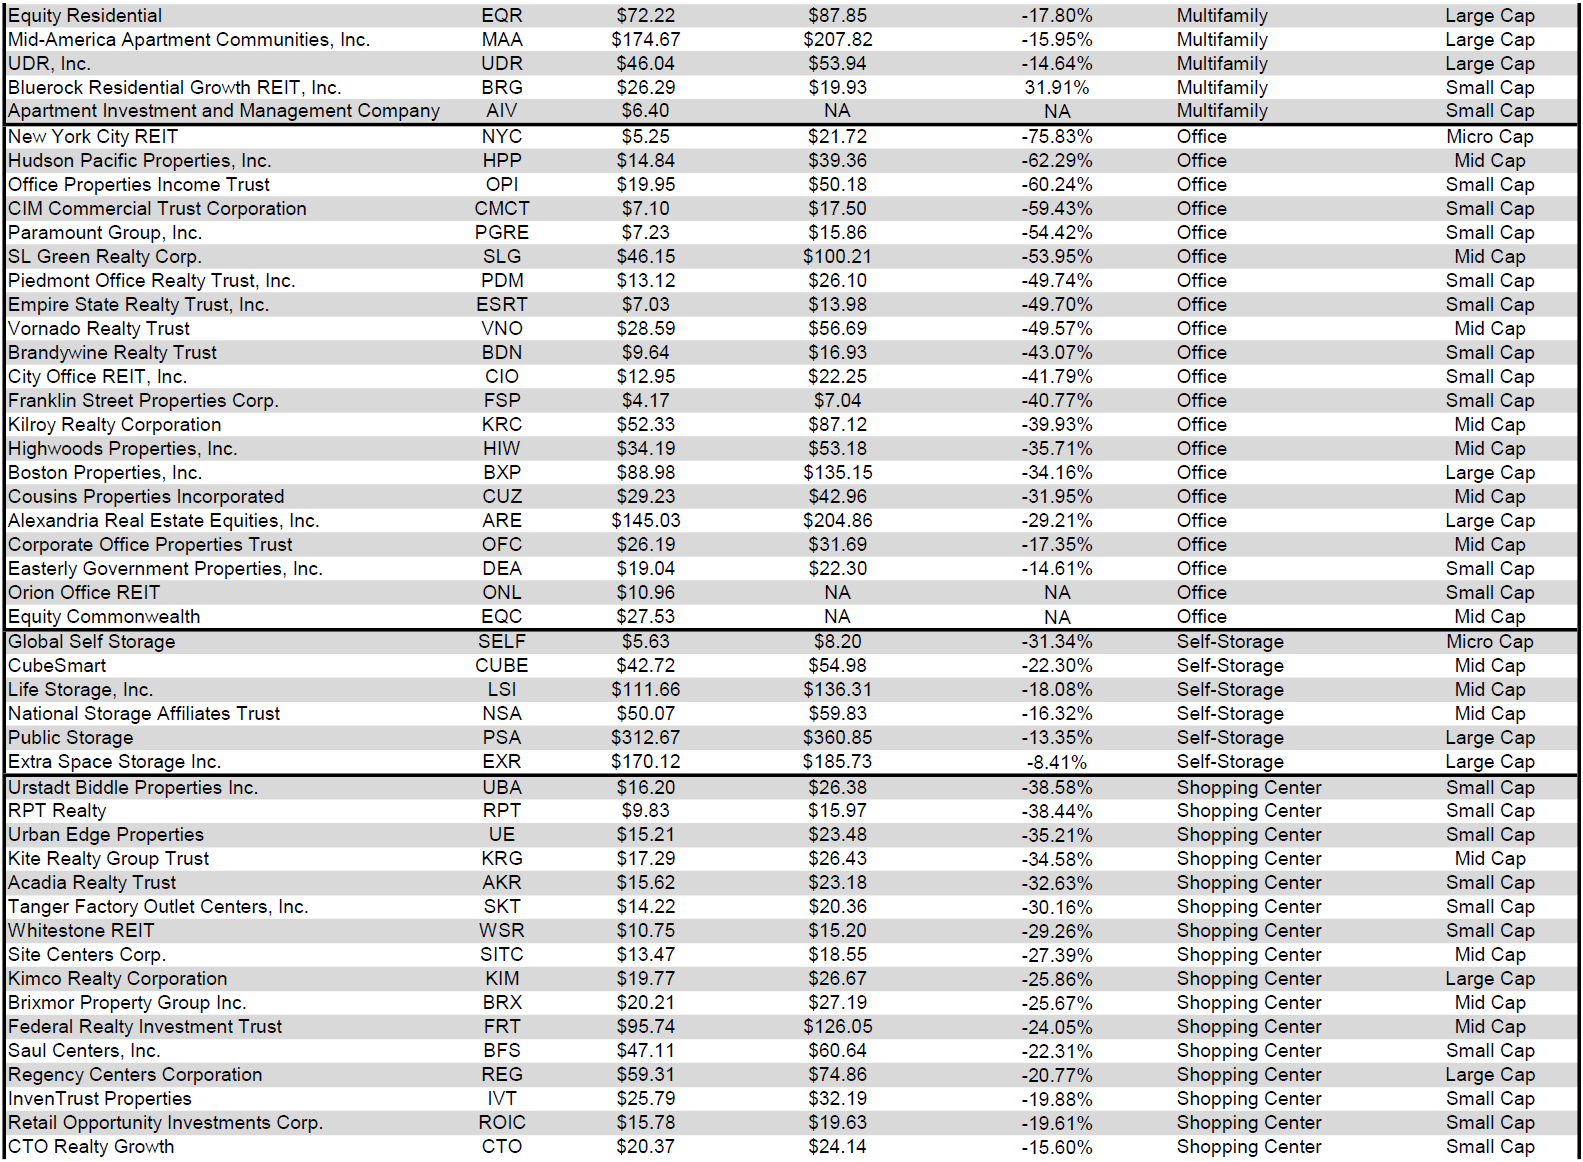
For the convenience of reading this table in a larger font, the table above is available as a PDF as well.
Takeaway
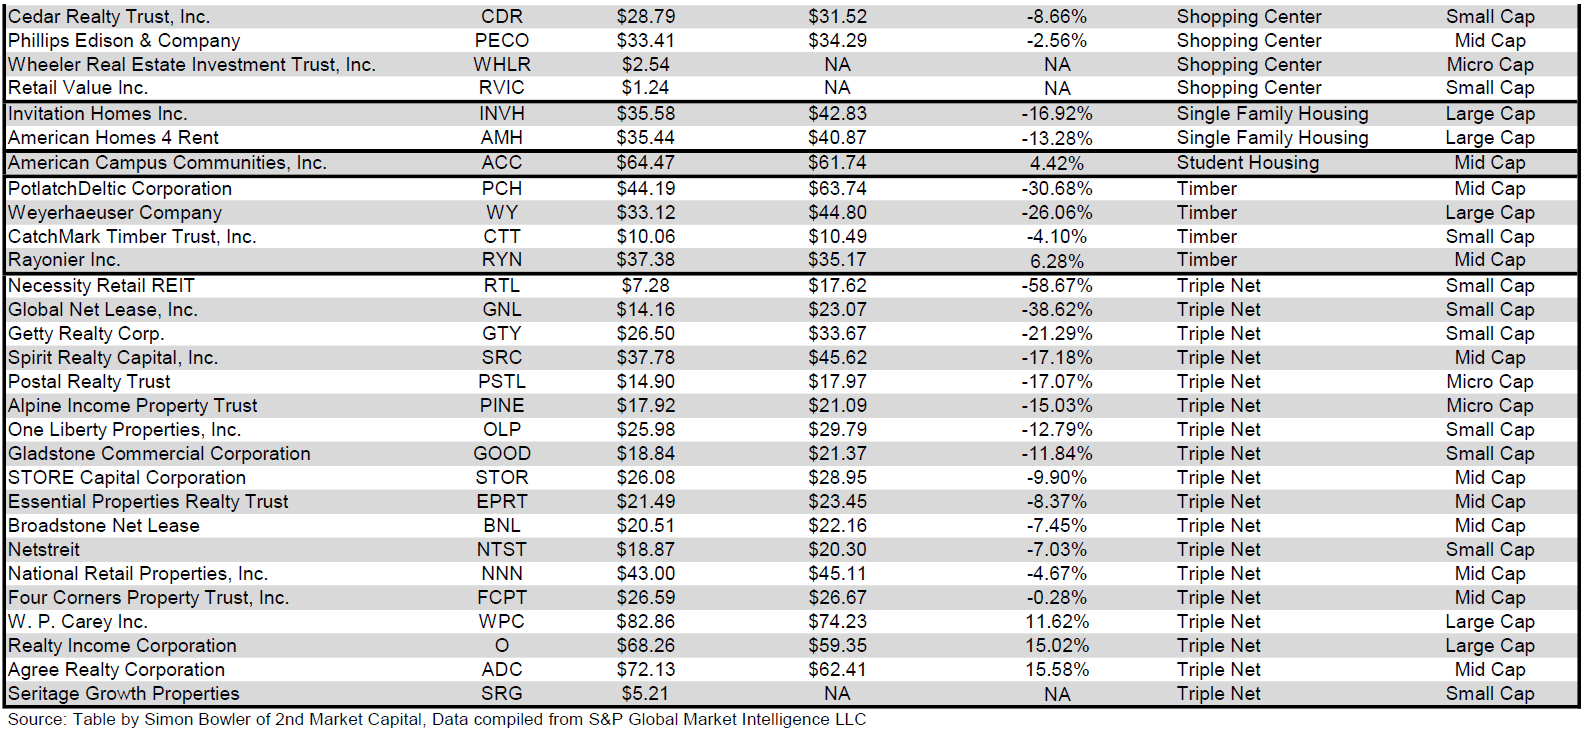
The large cap REIT premium (relative to small cap REITs) widened in June and investors are now paying on average about 35% more for each dollar of 2022 FFO/share to buy large cap REITs than small cap REITs (19.4x/14.4x – 1 = 34.7%). As can be seen in the table below, there is presently a strong positive correlation between market cap and FFO multiple.
Table by Simon Bowler of 2nd Market Capital, Data compiled from S&P Global Market Intelligence LLC. 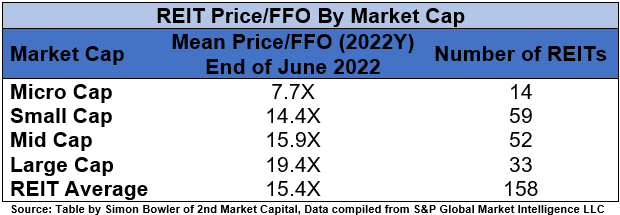
The table below shows the average premium/discount of REITs of each market cap bucket. This data, much like the data for price/FFO, shows a strong, positive correlation between market cap and Price/NAV. The average large cap REIT (-9.81%) trades at a single digit discount to NAV, while mid cap REITs (-20.94%) and small cap REITs (-27.81%) trade at double-digit discounts. Micro caps on average trade at less than 3/5 of their respective NAVs (-41.97%).
Table by Simon Bowler of 2nd Market Capital, Data compiled from S&P Global Market Intelligence LLC. 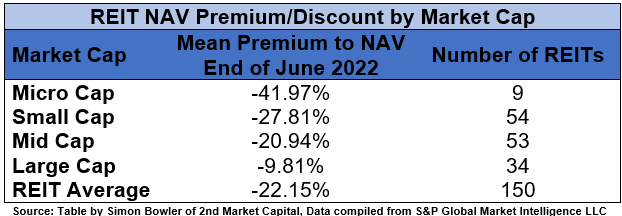
As share prices have continued to fall, REIT earnings have remained strong. One reason for this is continued tenant strength. Tenant bankruptcies can be very expensive for REIT landlords due to the rent loss of vacancy, so REIT investors should closely watch bankruptcy data for signs of economic trouble that could directly impact REITs. Although the number of US bankruptcies increased month over month in June, the 185 bankruptcies in the first half of 2022 is the fewest in the first half of a year in the past dozen years.
S&P Global Market Intelligence LLC
Market selloffs can be a painful experience for investors who are long stocks (and most other asset classes). One thing that can soften this blow and create opportunity is dividends. As long as the stocks in a portfolio continue to pay dividends during the market downturn, an investor continues to have positive cash flow even as asset values decline. This creates opportunity because this dividend cash flow can be used to purchase additional shares at reduced prices (thanks to the selloff). If these dividends are reinvested into stocks that pay a dividend, then portfolio income can continue to grow even during the selloff.
S&P Global Market Intelligence LLC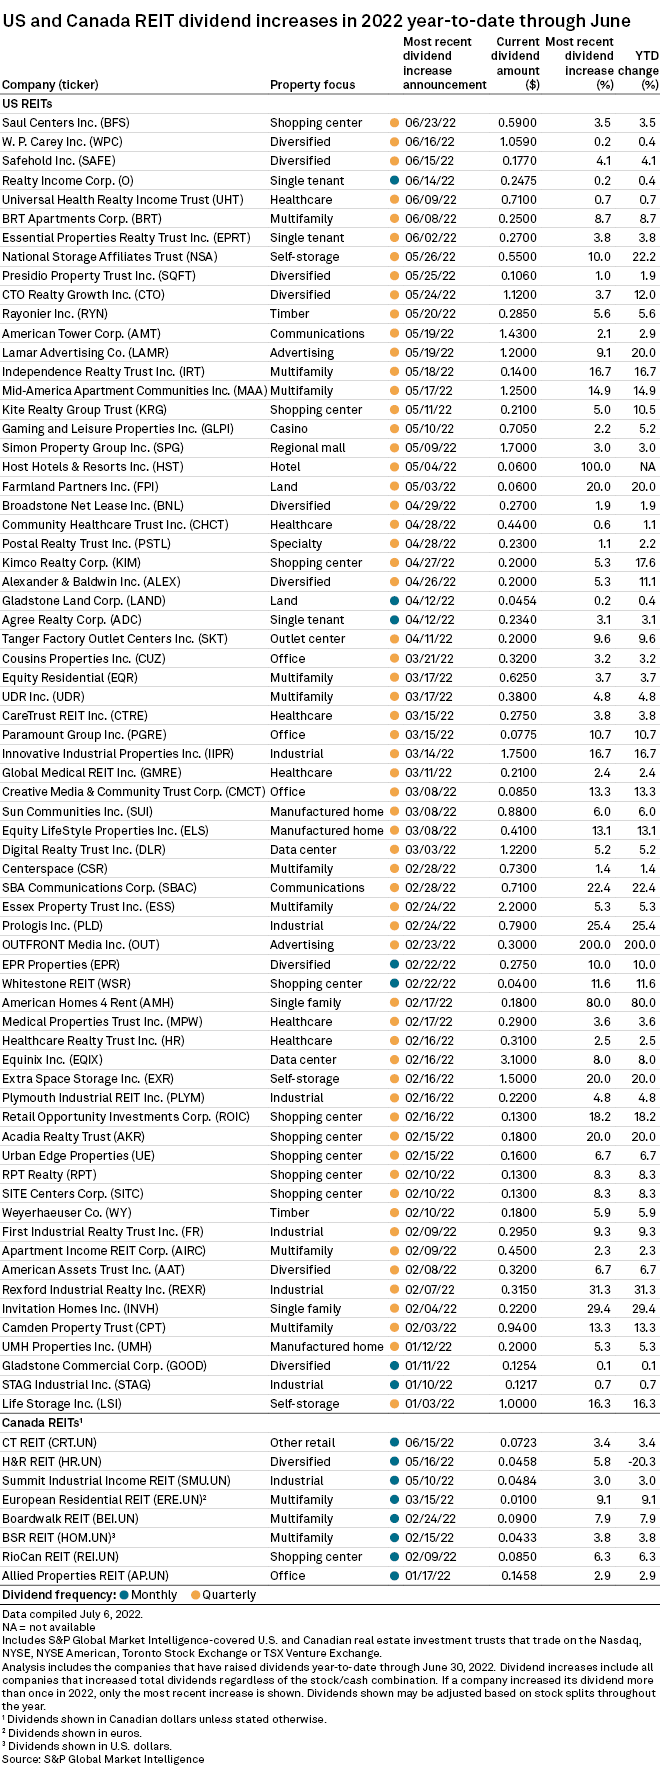
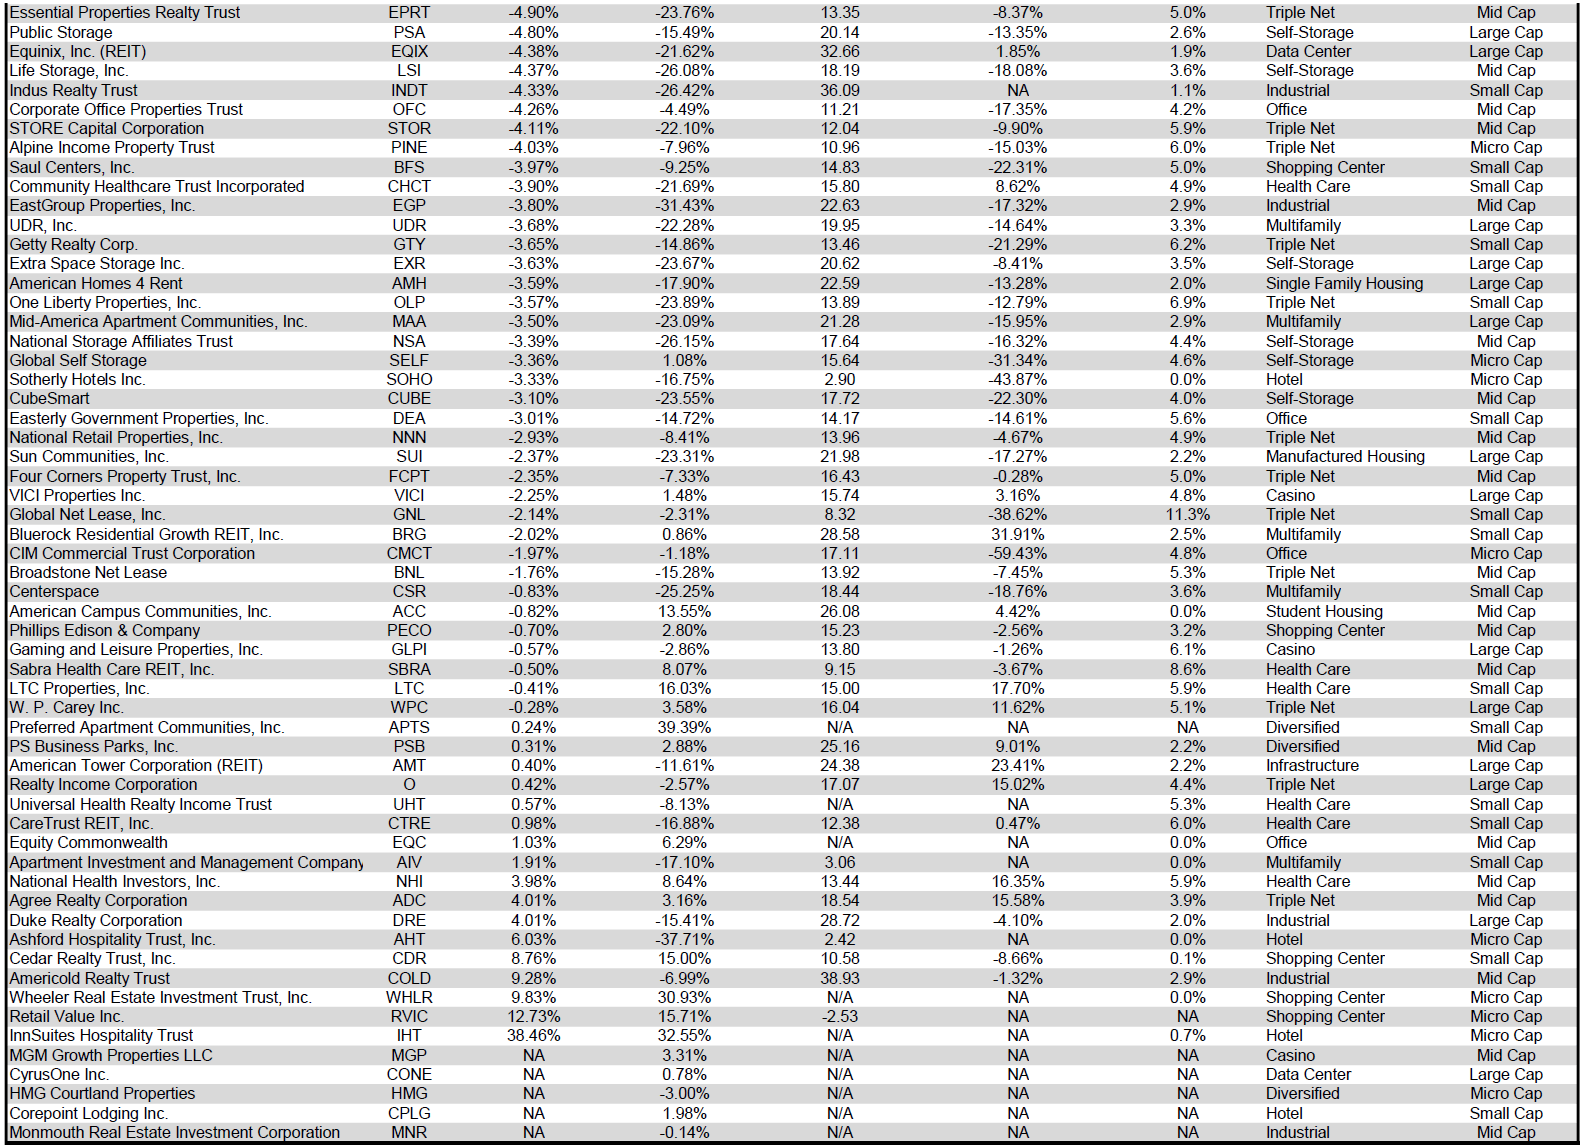
Another potential source of portfolio income growth is dividend hikes. 7 REITs raised their dividend in June: BRT Apartments (BRT) by 8.7%, Safehold (SAFE) by 4.1%, Essential Properties Realty Trust (EPRT) by 3.8%, Saul Centers (BFS) by 3.5%, Universal Health Realty Income Trust (UHT) by 0.7%, Realty Income (O) by 0.2% and W.P. Carey (WPC) by 0.2%. This was the 2nd dividend hike so far this year for O and WPC. If REIT earnings remain strong in the 2nd half of the year, the REIT sector will likely remain a great source of dividend growth.
Be the first to comment