

KenCanning/E+ via Getty Images
It was another brutal week for stocks, with the S&P 500 (SP500, SPX) dropping by another 4.7% and well into bear market territory again. But what is clear about this 2022 bear market is that thus far, it is not all that different from 1937, 2000, and 2008 bear markets, and it continues to follow those paths.
Thus far, those bear markets have given us a reasonably good guide for what may happen next. Based on those charts, it looks like this recent slide lower in the S&P 500 isn’t about to end anytime soon.
Bloomberg
Rates Rising Faster Than Stocks Are Dropping
This decline will likely continue because the stock decline has been slower than the rise in bond yields. The gross aggregate dividend yield for the S&P 500 has risen to 1.79%. That is in line with prior low yields seen at previous market peaks such as April 2010, February 2011, January 2018, October 2018, and February 2020. That floor in the dividend yield even goes back to around 2006.
Bloomberg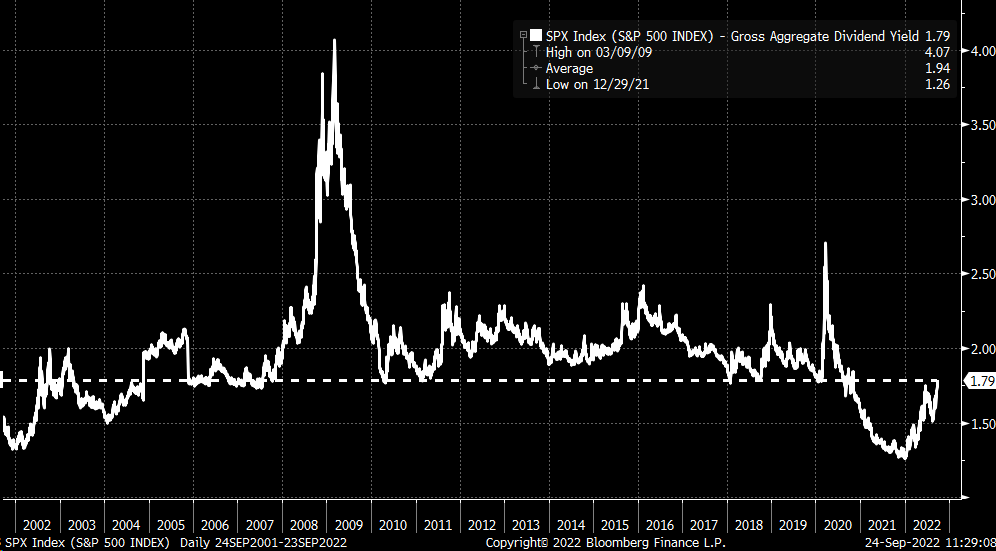
Additionally, since August 11, 2022, the S&P 500 dividend yield has risen by 28 bps. At the same time, the 10-Yr rate has increased by more than 110 bps since August 1. A massive divergence between rates and stocks. The S&P 500 dividend yield now trades 189 bps below the 10-yr rate, its lowest level since 2010.
Bloomberg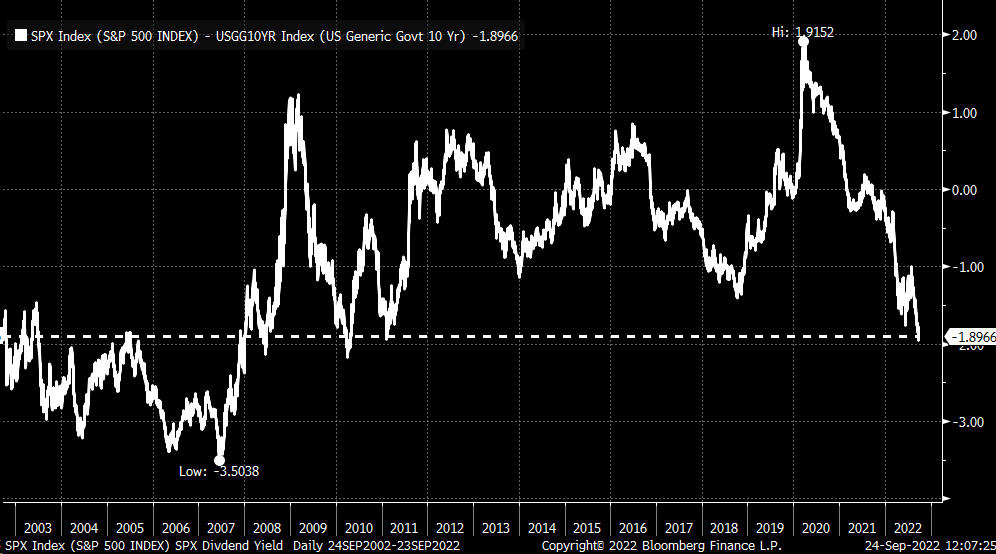
Rising Spreads
What is odd about this scenario is that spreads among bonds are currently rising as uncertainties are being priced into the market. For example, the Option Adjusted Spread for the US dollar Investment Grade All Cash Bonds Index has widened dramatically and is approaching its June and July peaks as the spread between stocks and bonds is making new lows.
Bloomberg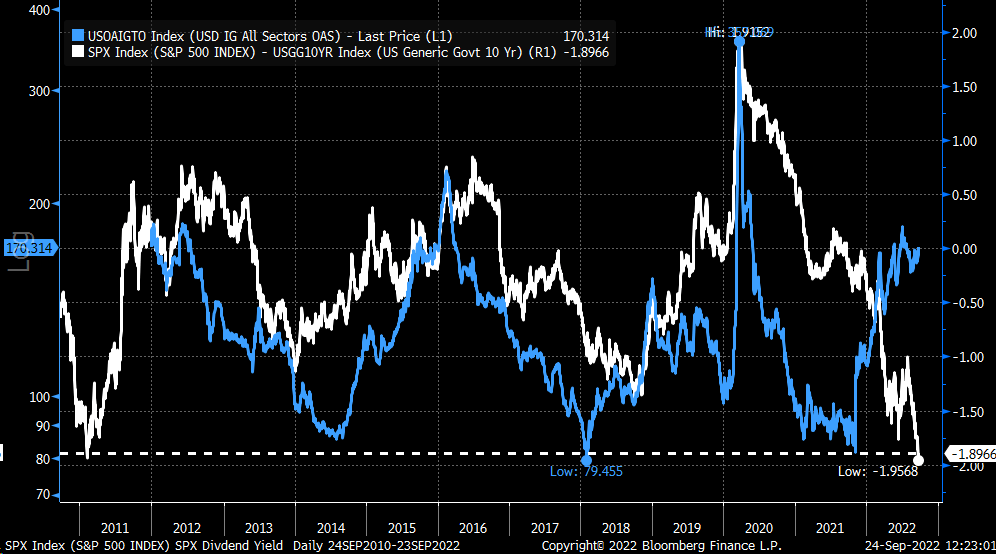
This IG OAS appears to lead the relationship between the 10-Yr Treasury rate and the S&P 500 dividend yield spread and could indicate that stocks will begin to see the spread with the 10-Yr rate rise back towards 0. It doesn’t have to get to 0, of course, but just in that direction, as any move higher would suggest that the dividend yield of the S&P is rising towards the 10-Yr rate or that the 10-Yr rate is falling. But given the current state of inflation and monetary policy, it seems more likely for the dividend yield to rise towards the 10-yr rate.
Increasing Volatility
It is critical because a further rise in the S&P 500 dividend rate would suggest the index still has to fall from its closing price on September 23. In fact, what is interesting is that the Markit CDX High Yield Spread appears to be on its way back to its June highs. Historically, as this spread rises, the VIX index tends to follow. It seems the High Yield spread is moving higher towards or possibly beyond its June peak, implying that the VIX is likely to move back or beyond its peak thus far in 2022.
Bloomberg
Should spreads continue to widen on the bond side of the market, it will be a pretty good indication that volatility in the S&P 500 will pick up and that the VIX is going higher. A higher VIX would mean that the S&P 500 heads lower.
Lower Prices
The current analog between the S&P 500 of today versus 2008 also suggests there is still further to fall. Based on the recent movement in rates, the chances of the scenario for a further drop depicted in the analog with 2008 do not seem out of the question.
Bloomberg
Rates and spreads may now be an essential tool at your disposal to help guide you through these current market conditions. Should those spreads continue to rise, then there is likely to be more pain ahead for stocks.
Be the first to comment