

DNY59
The selloff in the bond market has been nearly unprecedented. The return on the US aggregate bond index (AGG) was -14.6% through the first 3 quarters of the year. That’s one of the worst 9-month runs on record. In recent stock market selloffs, fixed income holdings served to offset losses. Not this time.
The Federal Reserve has targeted persistent inflation with sharp and frequent increases in short term rates – hammering fixed income holdings across the credit and maturity spectrum. There has been no place to hide. But does this mean that the bond market has nothing to offer for the foreseeable future? This article will review bond performance in the context of history to answer this question.
America’s fixed income markets have delivered generally positive returns. The recent 4 decade bond boom was fueled by a secular decline in interest rates, culminating in the zero interest regime of the Pandemic. Now, actual and expected interest rates have been lifted rapidly as a result of aggressive Fed intervention.
The following chart depicts the expected return (yield to maturity) of 2 year treasury and investment grade corporate bonds against contemporaneous inflation expectation. The latter value is the Cleveland Fed’s forecast of 2 year forward inflation based on a combination of market and survey data. The low interest rates of the post 2008 period rarely offered short term bondholders the opportunity to outpace inflation… until very recently.
St. Louis Fed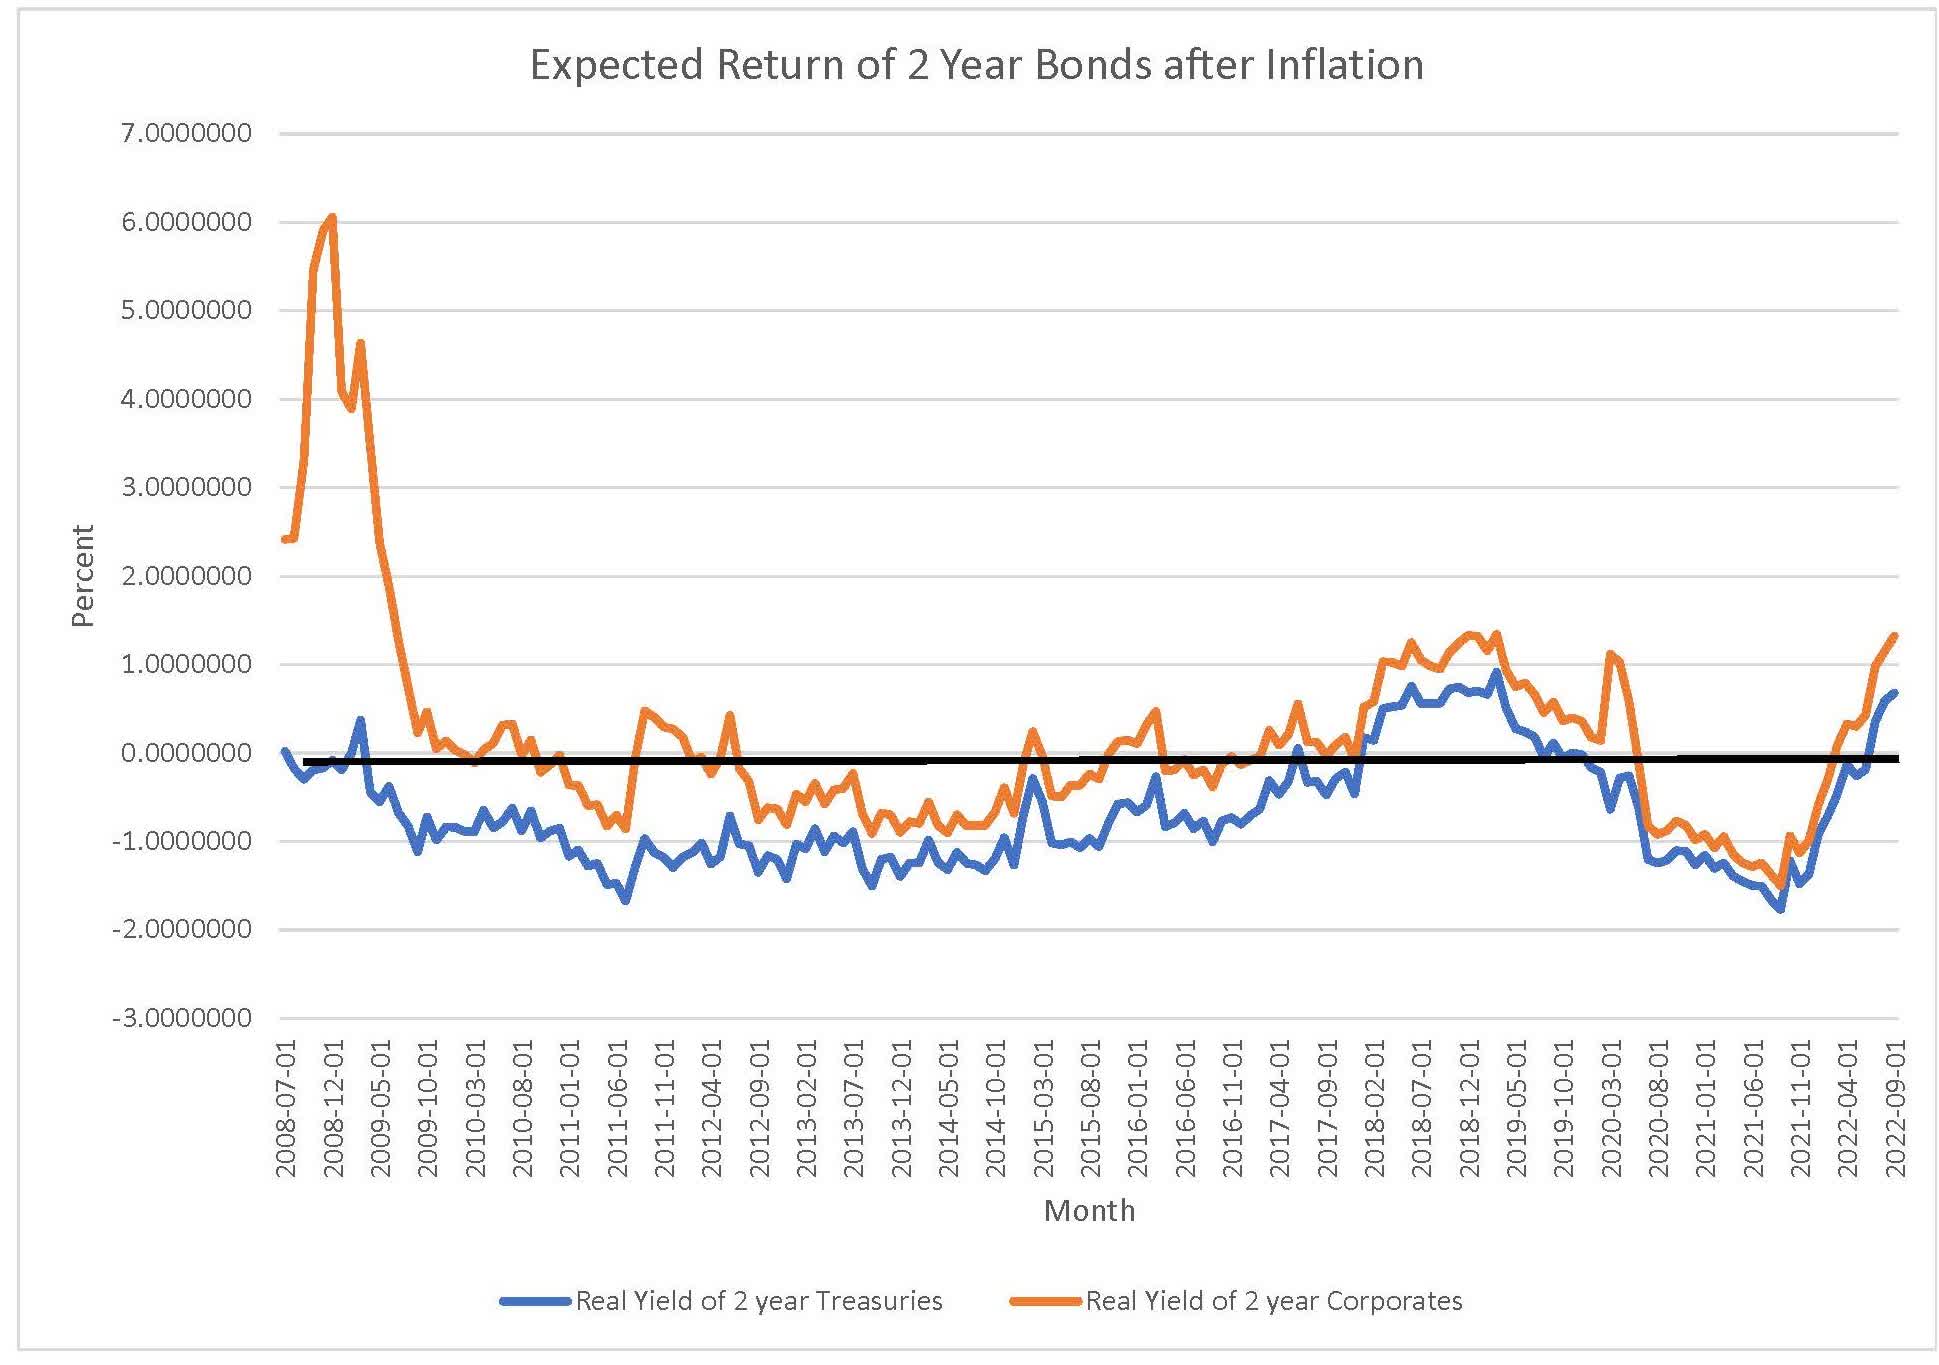
You’ll note that rapid selloff of the past several months has tipped expected returns decisively ahead of inflation expectations. To many this seems to be surprising given the reported inflation numbers in excess of 8%.
These are just headlines. The media typically reports the latest realized inflation relative to 12 months prior. Nothing wrong with that. However, it does fail to capture more recent pricing trends. The left column of the table below lists rolling 12-month inflation for each month over the last two years. You’ll note that it a smoothed measure that has remained consistently above 8%. Current inflation numbers are largely attributable to price increases early in the year that have yet to roll off the 12-month observation window.
The observations in the rightmost column are annualized measures of inflation based only on month to month seasonally adjusted change in prices. It’s much closer to capturing current trends. The latest 3 months indicate that inflation is quiescing after having peaked in June.
BLS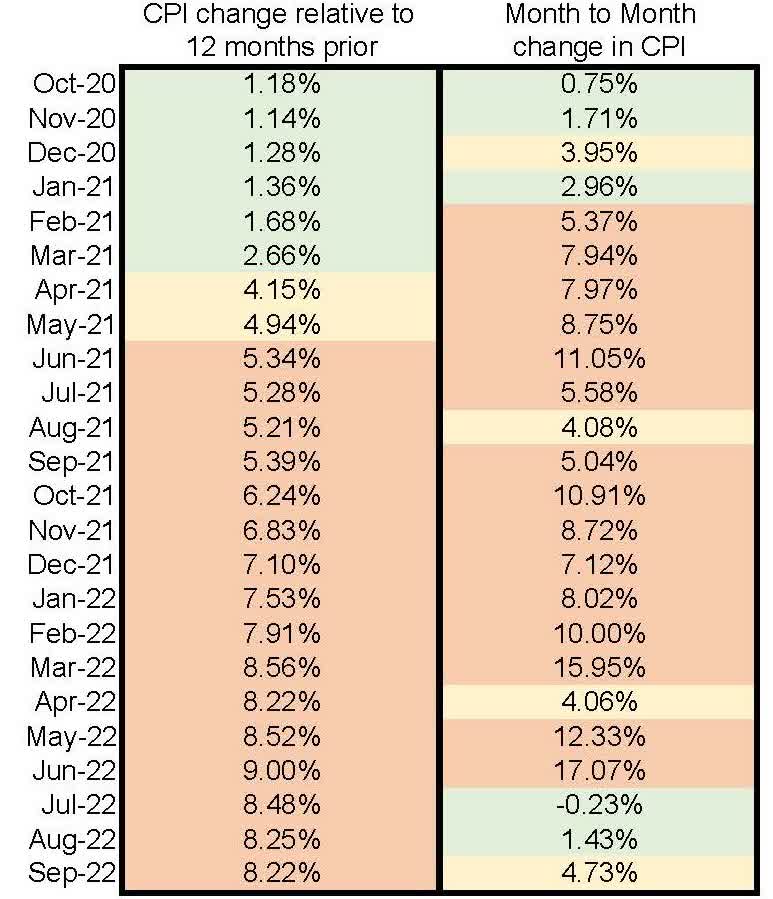
Forward looking measures of inflation similarly indicate continued stabilization of prices. The treasury yield curve and the inflation swap market price breakeven inflation over the next 12 months at 2.65%. The aforementioned Cleveland Fed relies incorporates surveys with market data and forecasts a CPI increase of 4.2% over the next year.
Either way, expected inflation is considerably lower than the headline data presented to the public. 2 year corporate bonds now yield over 5%, well above most measures of expected inflation. This part of the yield curve is readily investable. Vanguard offers a constant maturity bond fund with a 2 to 3 year duration (VCSH). Invesco has a low cost ETF (BSCO) comprised of bonds maturing at yearend 2024. The uniform maturity dates of bonds in the latter product largely anchors its residual value.
Of course, this is time it could be different. A unique artifact of today’s environment is a spike in inflation. We might consider past behavior of bond markets in the 12 months following previous peaks in inflation. The data is at least mildly reassuring. Both bonds and stocks do not appear to suffer “hangover” effects from rapid price increases. In fact, average bond returns have exceeded their baseline performance over the period examined.
Blackrock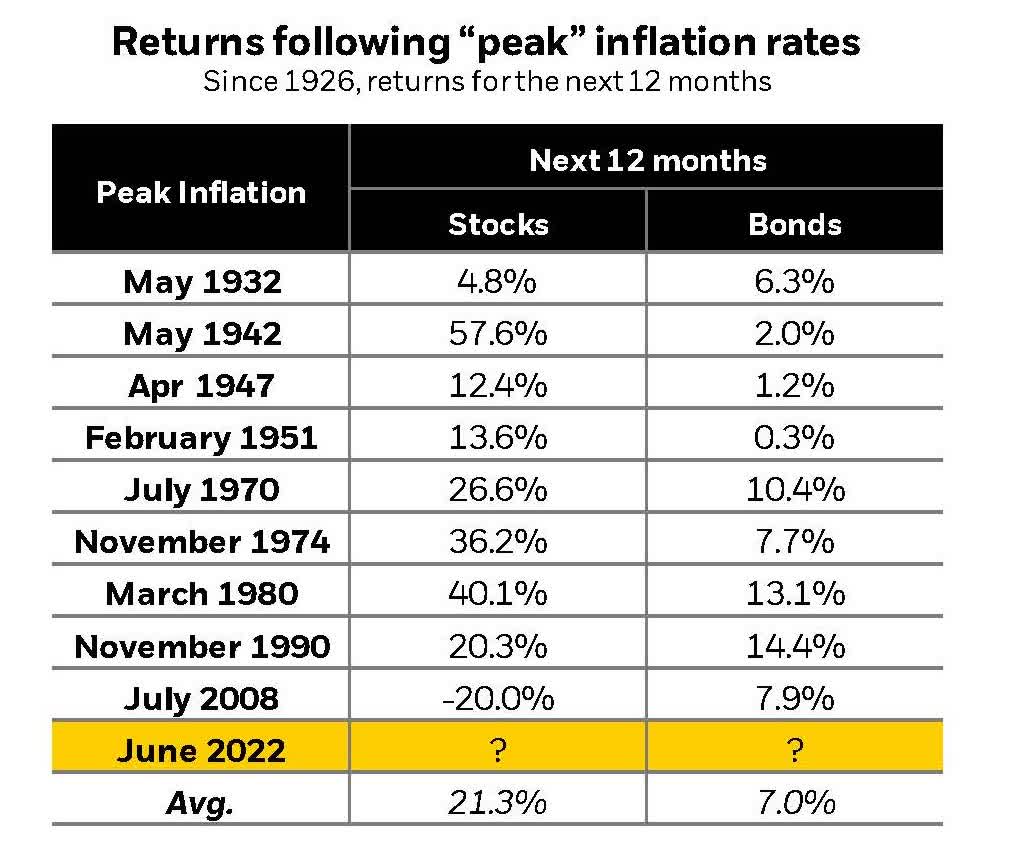
Another facet of today’s yield curve is its recent inversion. Short term rates are now higher than longer term rates. More specifically, the 2 year treasury rate moved well above the 10 year yield just a few months ago. It’s the largest inversion since the dotcom bust at the turn of the century.
Investors can now invest in high quality bonds with minimum term structure risk and expect to earn a return in excess of inflation. This opportunity has been lacking since the Great Recession.
One might reasonably ask whether current yields are a viable portent of long term realized returns. Of course, no one can forecast interest rate paths . But there is evidence that the starting yield in the bond market is correlated with future returns. Below is a simple illustration that tracks the observable yield in the ten year treasury against subsequent 10 year returns in the aggregate bond index (AGG) – a proxy for high quality US bonds. Its last observation is September 2012. There is a great deal of correspondence. The best predictor of future returns is current yield.
PIMCO, DFA, and St. Louis Fed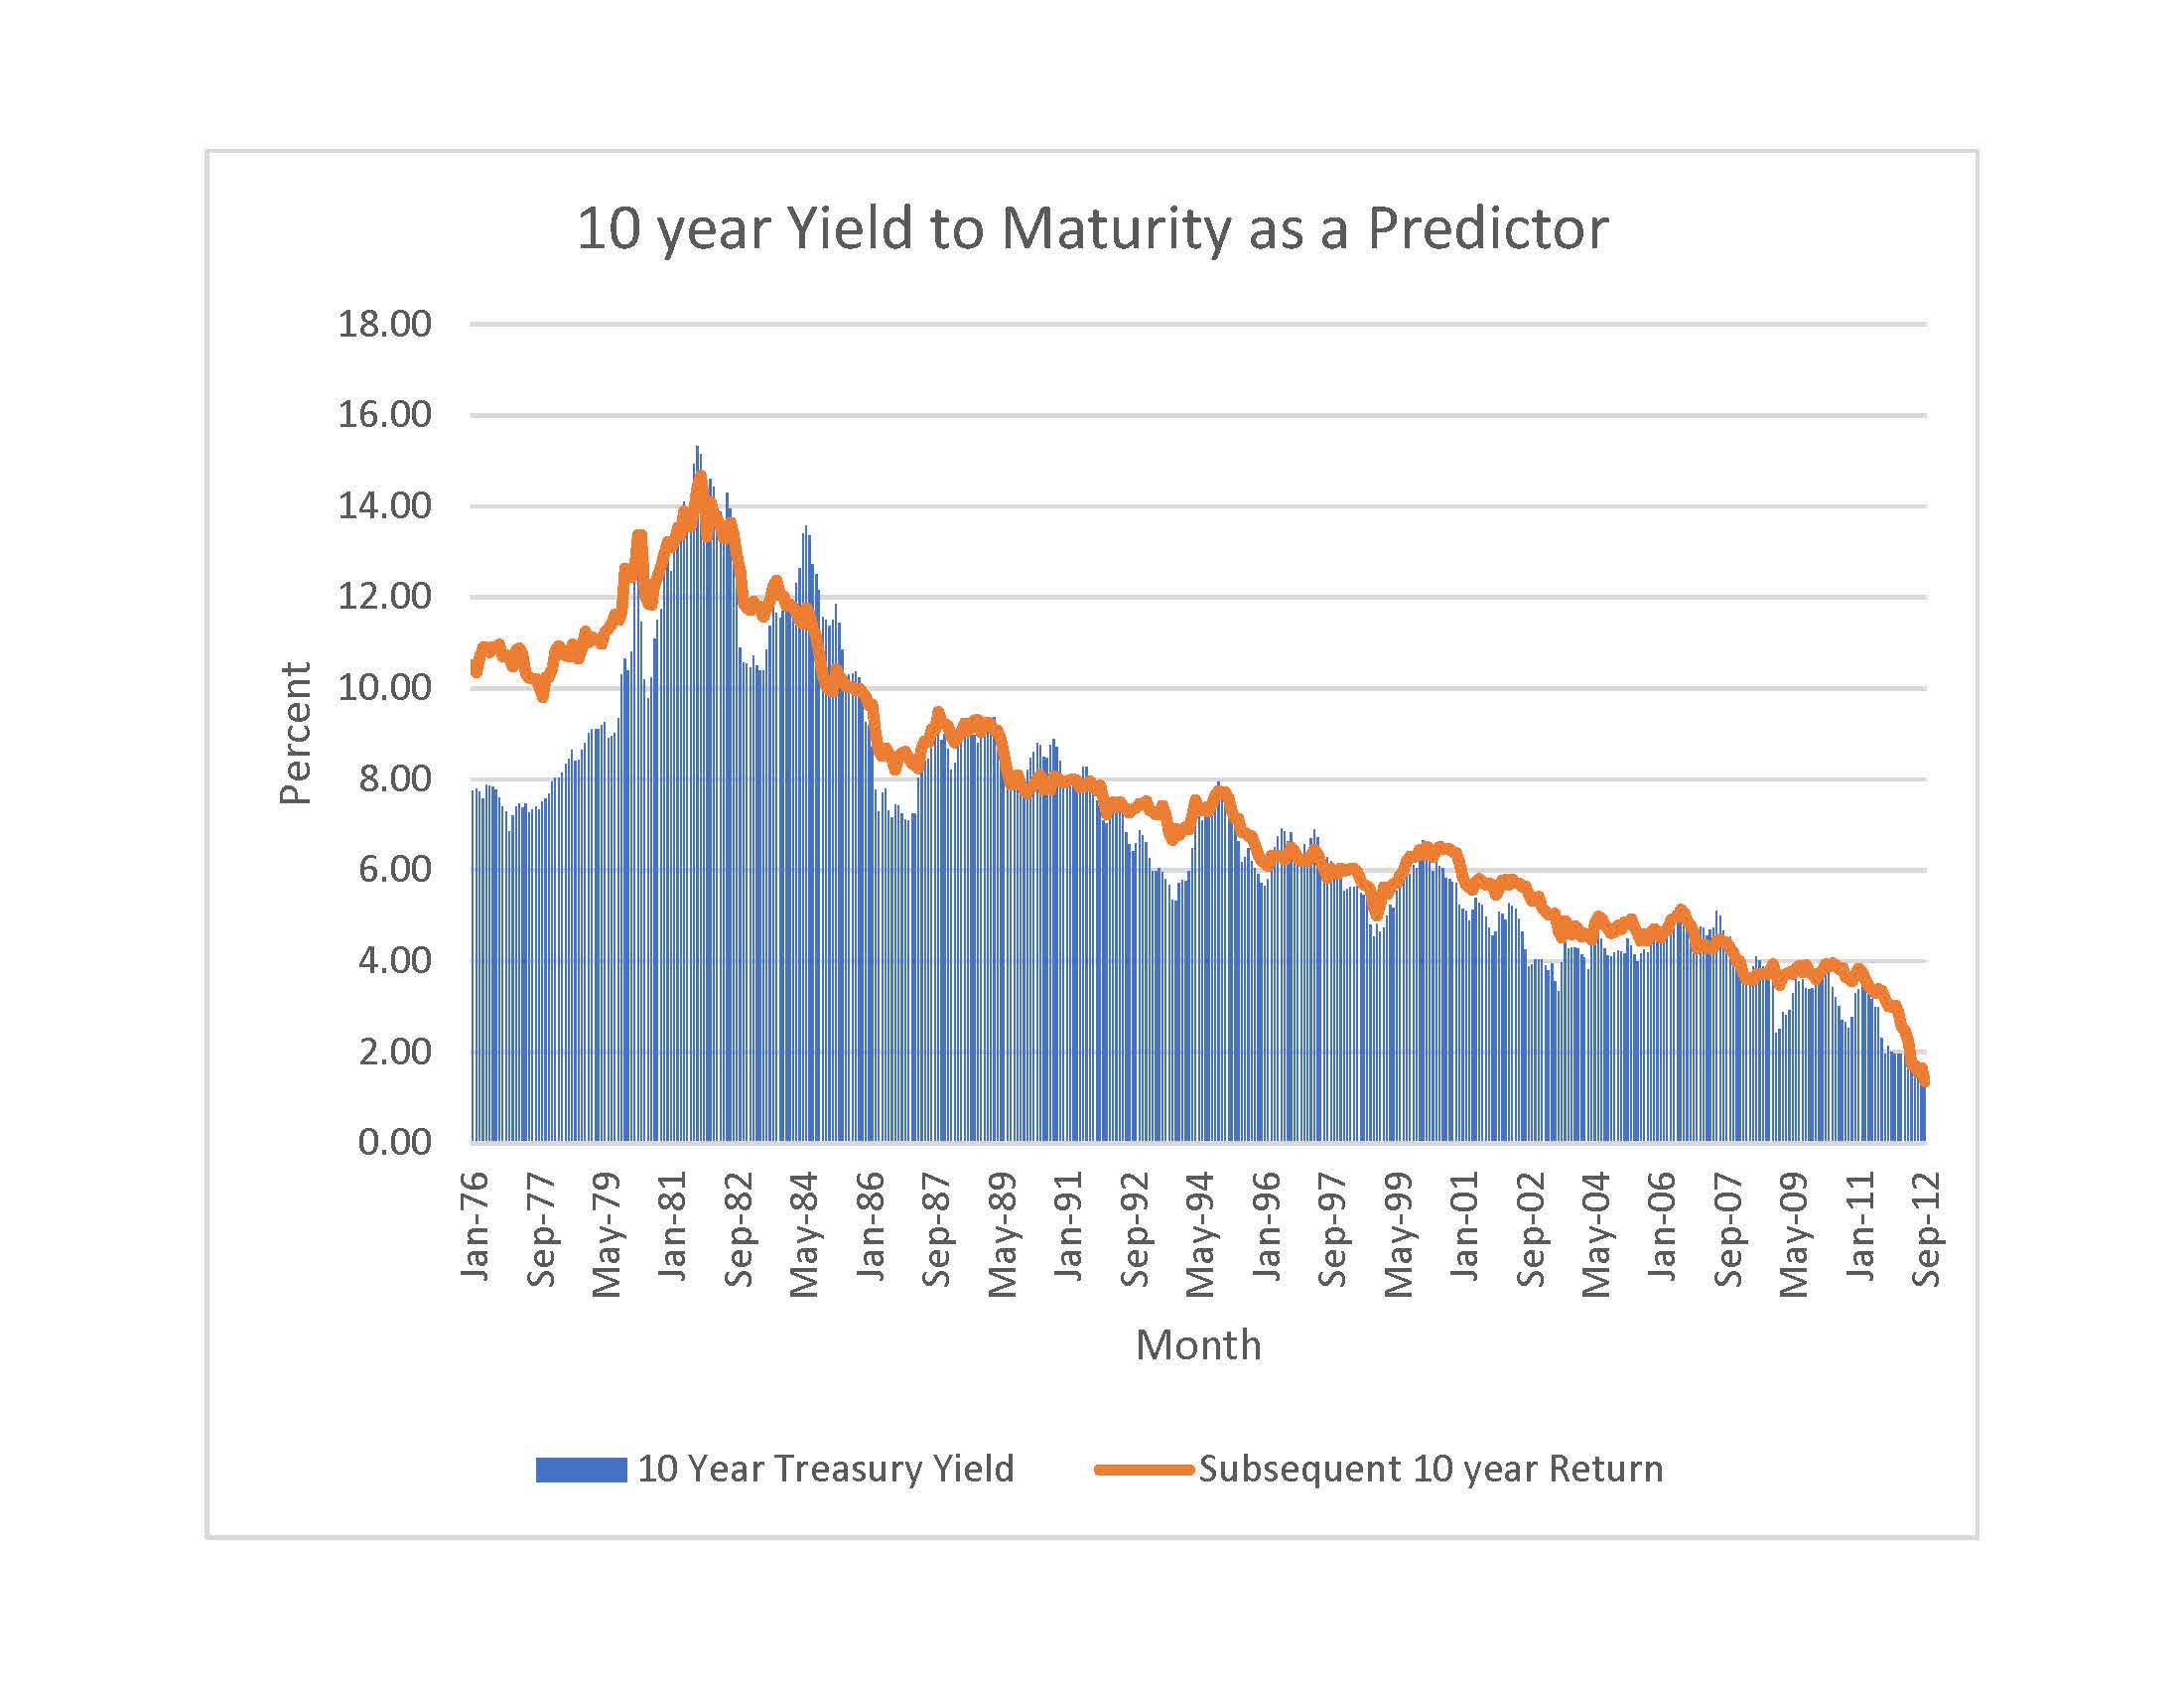
To summarize, today’s US bond market is poised to generate returns that exceed rational expectations of inflation. The pricing of bonds today is about as favorable as it has been in 15 years. There is, of course, no guarantee. But the weight of (admittedly limited) historical evidence suggests that bonds should provide gains that enhance investor buying power.
Be the first to comment