

Darren415
The Royce Value Trust (NYSE:RVT) is managed by Chuck Royce, a pioneer in small-cap investing. I had the privilege of working with one of Mr. Royce’s former top lieutenants, and this person’s professionalism and deep investment expertise spoke to the quality of Royce Investment Partners’ people.
RVT has many positive attributes that I like. One, it has outperformed the Russell 2000 index on most time frames. I also like the fact it typically outperforms during bear markets, giving some downside protection. Finally, yield investors would like RVT’s distribution policy of paying an annualized 7% distribution yield on trailing 4 quarter-end NAVs, which works out to a forward 8% yield.
Fund Overview
The Royce Value Trust Inc. is a closed-end fund (“CEF”) that provides exposure to U.S. small-cap equities. The fund has $1.6 billion in assets and has been in operation since 1986.
Strategy
The Royce Value Trust primarily invests in value oriented small- and micro-cap companies in the U.S. The fund was formed in 1986 and was the first small-cap focused closed-end fund. RVT has been continuously managed since inception by Chuck Royce, a renowned expert in small-cap investing with over 60 years of experience.
Portfolio Holdings
RVT’s portfolio has 476 holdings with an average market cap of $2.2 billion. Figure 1 shows RVT’s sector breakdown vs. the Russell 2000 Index. Relative to the index, RVT is overweight industrials, technology, and materials, and underweight financials, healthcare, and energy.
Figure 1 – RVT sector allocation (royceinvest.com)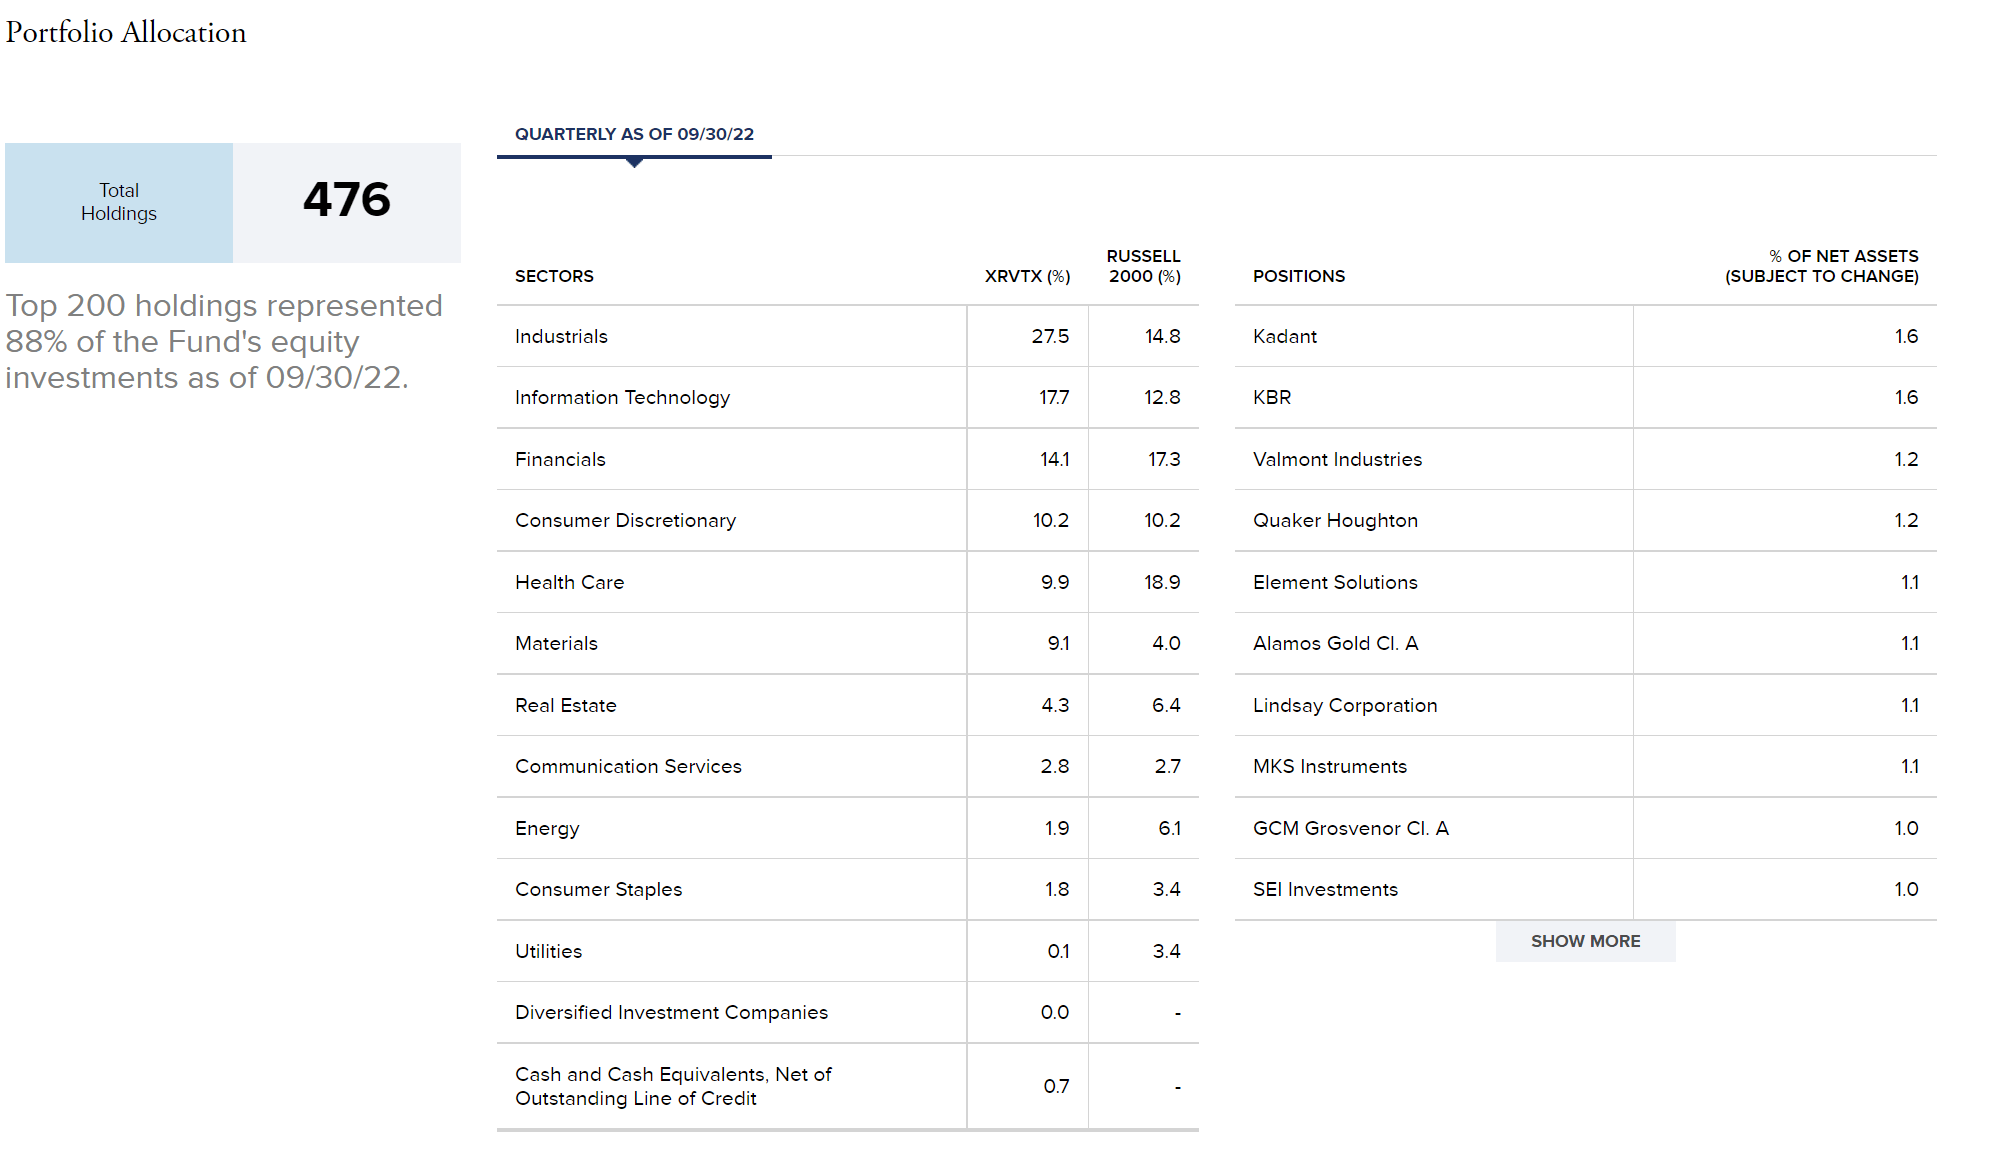
Returns
The RVT fund has a strong return history, outperforming the Russell 2000 Index on most time frames (Figure 2). However, YTD to October 31, 2022, the fund is down 23.8%, lagging the Russell 2000’s 16.9% drawdown.
Figure 2 – RVT historical returns (royceinvest.com)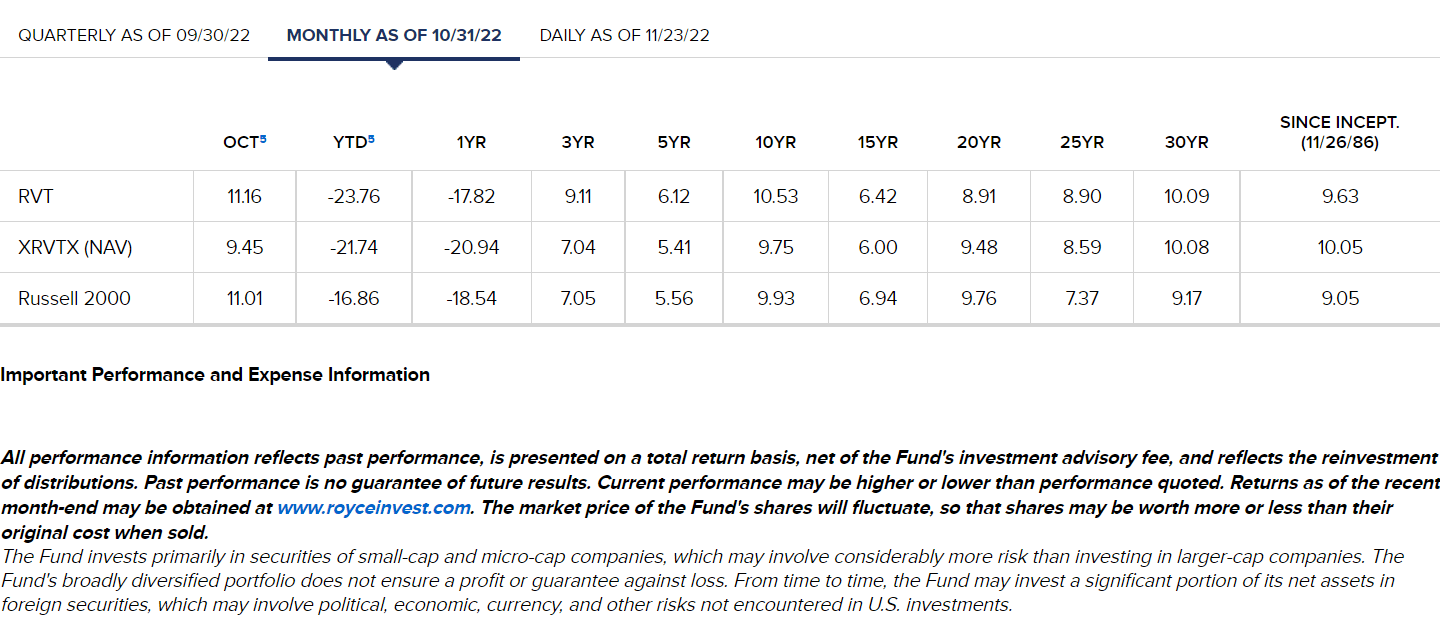
While the per annum outperformance may seem small, for example the RVT fund returned 9.6% per year since inception vs. 9.1% for the index, the small outperformance compounded over many years can have a large impact (Figure 3).
Figure 3 – RVT has outperformed Russell 2000 Index over the long-run (royceinvest.com)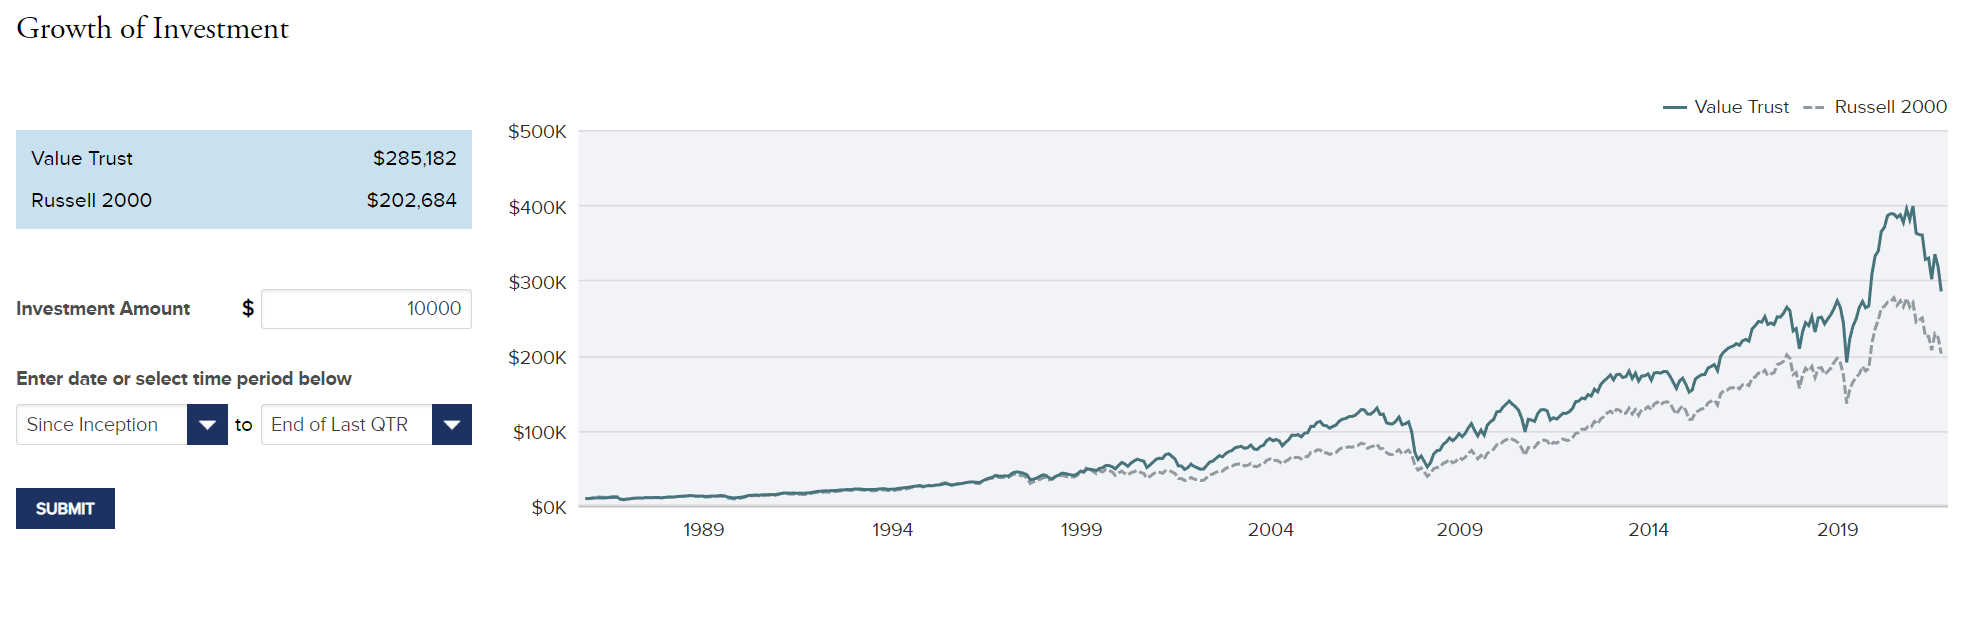
Impressive Consistency And Downside Protection
What I find most impressive with RVT’s performance is its consistency and downside protection.
For example, in the past 10 full calendar years, we can see the RVT fund has performed roughly in line relative to its asset class, the Russell 2000 Index. While RVT may outperform or lag by a few percentage points in any given year, there have no ‘blow-ups’, unlike the Clough Global Opportunities Fund (GLO) that I recently reviewed, which blew up in 2016 and 2021 relative to its index (Figure 4).
Figure 4 – RVT has had no blow-ups in the past decade (royceinvest.com)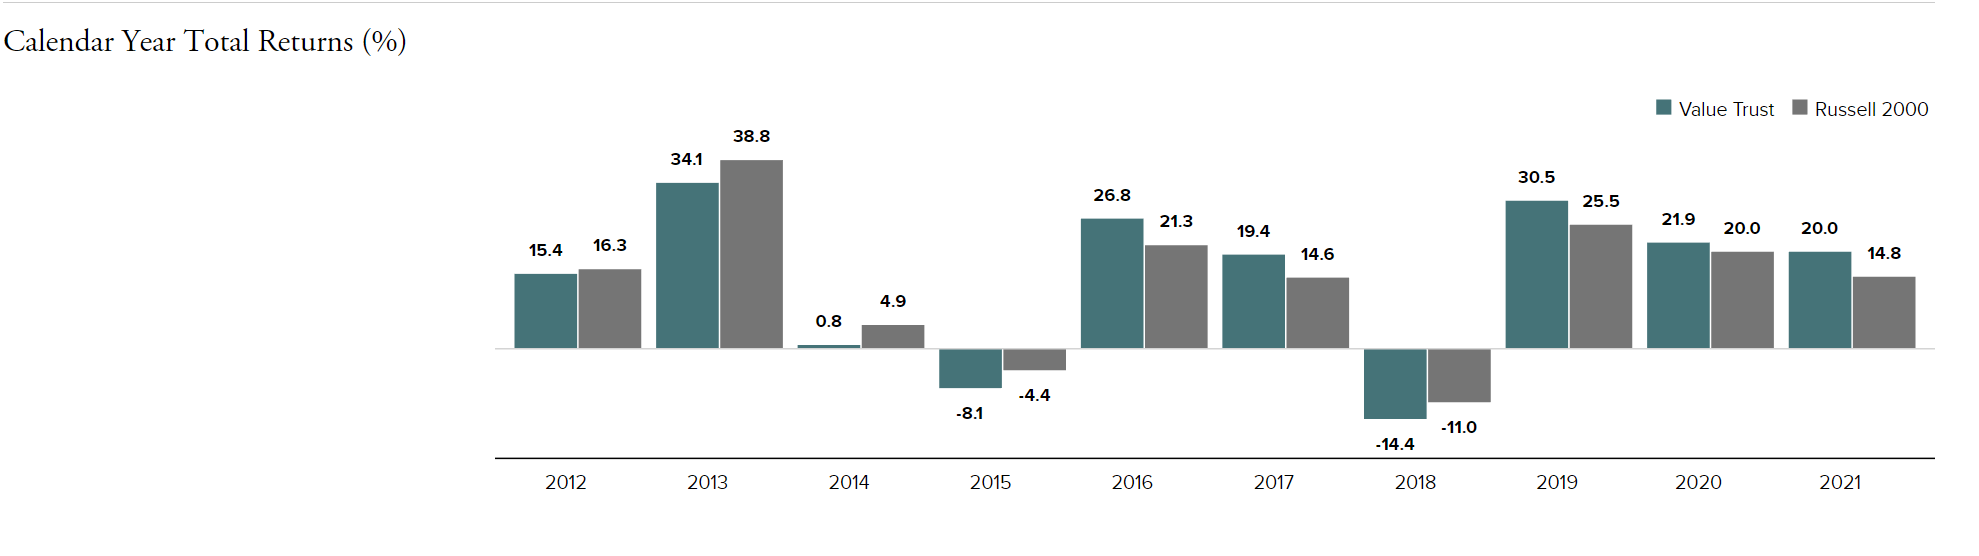
Another statistic that I like about the RVT fund is that it has outperformed the Russell 2000 Index 8 out of 10 times when the index has declined by more than 15% from its highs, with a median outperformance of 6.4% (Figure 5). Anyone can make money in a bull market, but knowing when to play defense is the key to long-term outperformance.
Figure 5 – RVT has outperformed in 8 of the past 10 bear markets (royceinvest.com)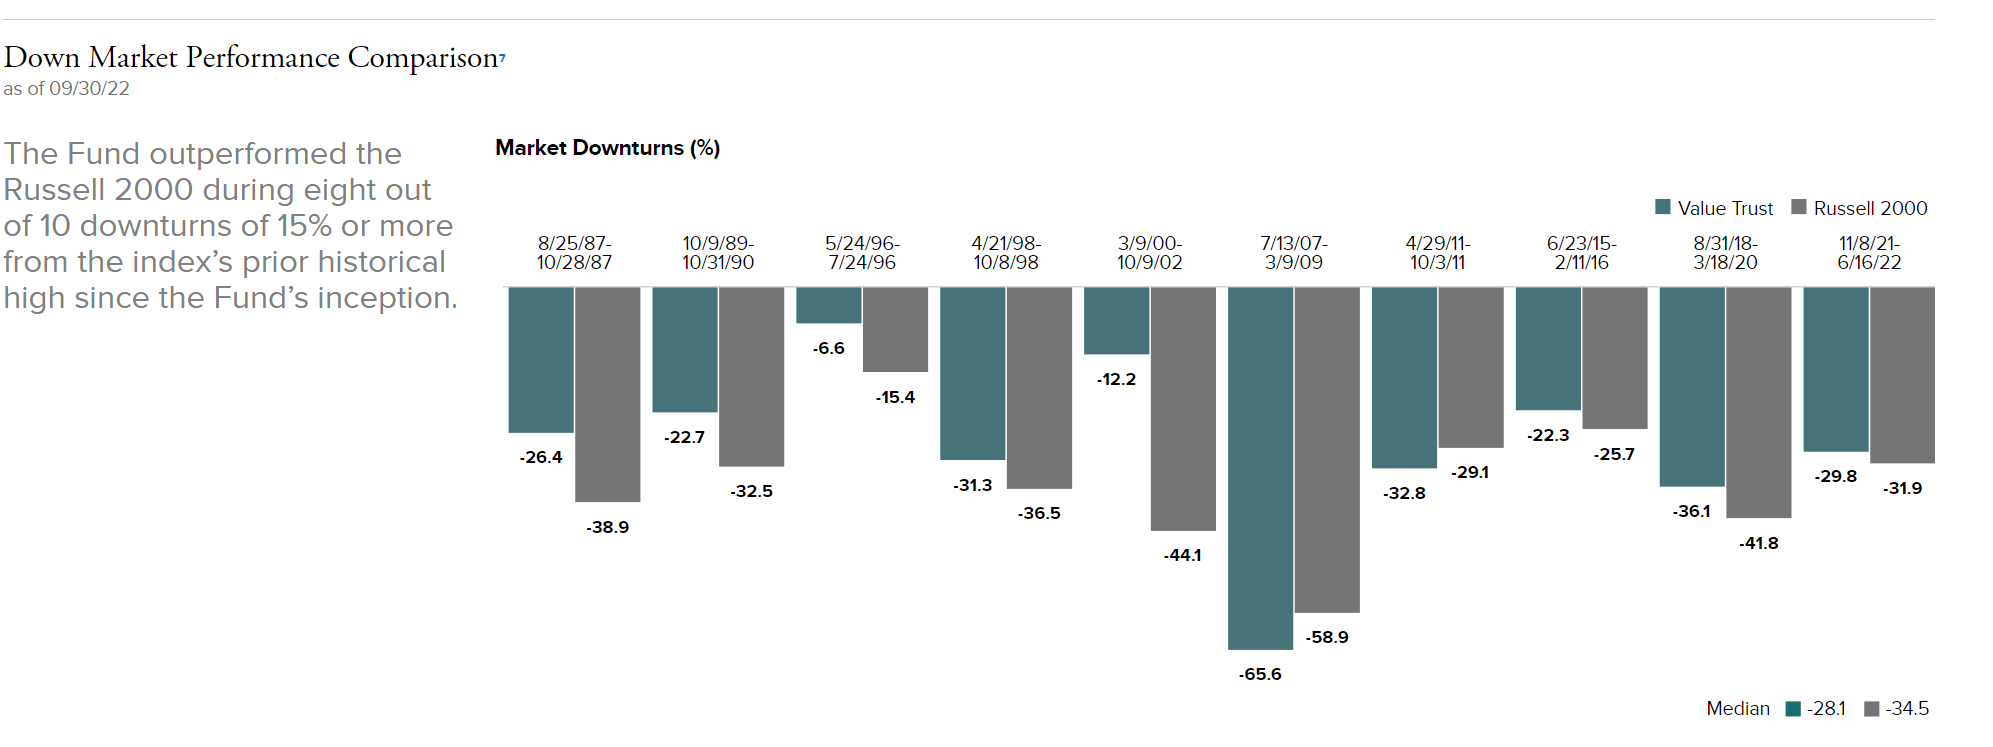
Distribution & Yield
RVT pays a high distribution yield. In the last 12 months, RVT has paid $1.81 / share in distribution, or a 12.4% trailing yield. However, the forward distribution rate is expected to be lower due to recent poor investment performance.
RVT has a managed distribution policy (“MDP”) that pays a quarterly distribution at an annual rate of 7% of the average of the prior four quarter-end net asset values (“NAV”). By my calculation, the next quarterly distribution should be $0.29 / share, or an 8.0% forward yield (Figure 6).
Figure 6 – Estimated next quarterly distribution (Author created with quarter-end NAV from cefconnect.com)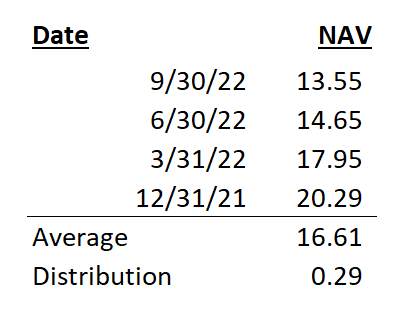
In my opinion, RVT’s high distribution may actually be a detractor. Great capital allocators are rare; when you find one, ideally you would want him or her to allocate as much of your capital as possible instead of paying it back to you as a distribution. A great example is Berkshire Hathaway Inc. (BRK.A) (BRK.B), which has famously never paid a dividend.
However, I do understand why RVT chooses to pay a high distribution rate. Part of the reason is to appeal to CEF investors, the vast majority of whom want income.
However, I think a more important reason is because RVT’s investment universe is U.S. small-cap companies with an average market cap of ~$2 billion. Currently, RVT is a $1.6 billion AUM fund, so a 1% position for RVT would equate to $16 million, or less than 1% of the average $2 billion market cap company.
However, imagine if RVT never made distributions. If RVT never made distributions but compounded at 9.6% for 35 years (assuming it started with $1 billion), the fund would have approximately $24 billion in AUM. A 1% position would then be $240 million, or over 10% of the average investee company!
RVT’s distribution appears sustainable, as it declines during bear markets, albeit with a lag. This ensures that the fund’s assets do not get depleted to fund an artificially high distribution yield.
Investors Can DRIP Their Distributions
Fortunately, RVT does have a Distribution Reinvestment Plan (“DRIP”) that investors can take advantage of, to maintain their undiluted investment in the fund. Note, the total return figures shown in figure 2 above assumes distributions are reinvested.
As an added bonus, the reinvestment price is usually a discount to the market price or NAV / share. For example, the latest Q3/2022 distribution of $0.32 / share was reinvested at $14.27, the market price on September 19th, which was a discount to the $14.69 NAV / share.
Fees
RVT charges a modest expense ratio of 0.63% (Figure 7).
Figure 7 – RVT expenses (royceinvest.com)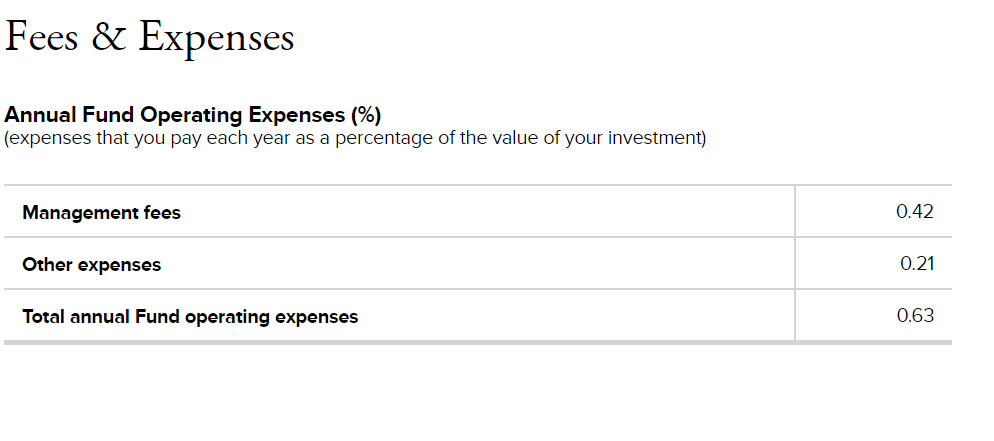
Are Small-Caps Setting Up To Outperform?
After more than a decade of outperformance by the global mega-cap technology companies, represented by the Nasdaq 100 Index, are we setting the stage for U.S. small-cap outperformance in the years to come? The technical and fundamental setup is eerily similar to the early 2000s, after the dotcom bust of no-profit high-growth technology companies. Figure 8 shows the ratio between S&P 600 Small Cap Index vs. the Nasdaq 100 Index.
Figure 8 – S&P 600 Small Cap Index vs. Nasdaq 100 Index (Author created with price chart from stockcharts.com)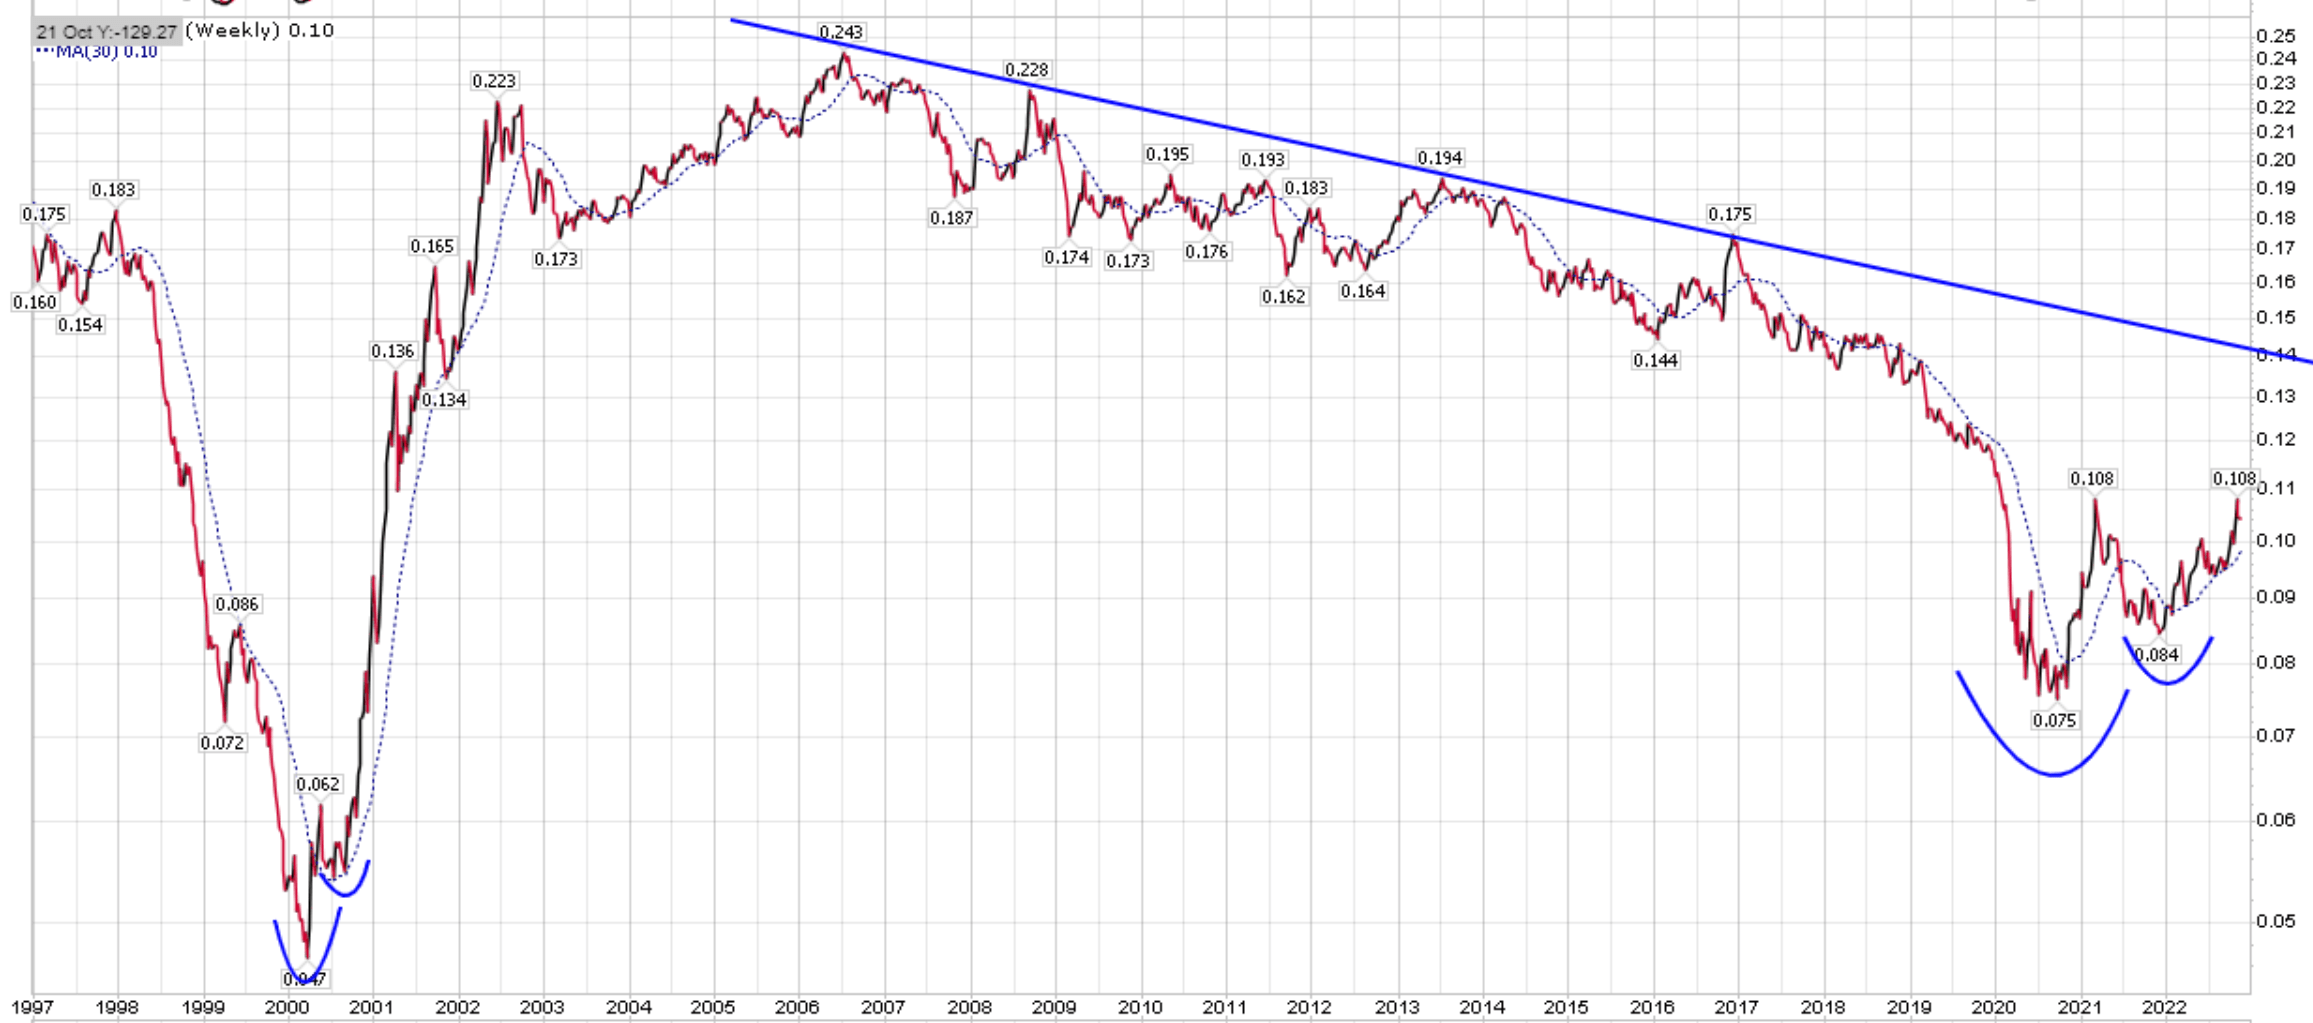
I believe one of the main themes in the coming years will be a re-shoring of goods production, partly to solve the supply chain weaknesses laid bare by the COVID-pandemic, and partly because of the increased geopolitical tension between the U.S. and China. This should benefit domestic U.S. small-cap companies.
Conclusion
The Royce Value Trust has many positive attributes that I like. One, it has outperformed its index on most time frames. I also like the fact it typically outperforms during bear markets, giving some downside protection. Yield investors would also like RVT’s distribution policy of paying an annualized 7% distribution yield on trailing 4 quarter-end NAVs. In my opinion, this is a sustainable strategy, as the distribution declines during bear markets, so the fund doesn’t end up depleting the NAV to fund ridiculous double digit yields. I am also bullish on small-caps in the coming years due to the need for re-shoring goods production.
Be the first to comment