mphillips007/E+ via Getty Images
For those of you who have followed my work, this is a change I decided to make for several reasons. The articles require quite a bit of manual work to update spreadsheets and track dividends coming into the accounts. In recent years I have added more charts/graphs with the hope that it adds value for readers and provides clarity for what I am trying to do.
In the process of doing this, I have made it harder for myself to continue producing consistent articles and ensure that the quality doesn’t suffer. Here are some additional reasons for separating out trades in their own article.
- If I have a week where no trades take place I can simply skip writing this article because there is no point in providing an update if nothing happens.
- My articles currently talk about trades done as long as 60 days ago, for example, if I do a trade on the 1st of June but the article gets published at the end of July. Producing a separate article allows me to provide actionable trades that are more likely still within a buy/sell range after seven days.
- My articles have gotten way too long. A busy month can result in a 4,000+ word article and that distracts from the purpose of the updates.
I would love to receive feedback in the comments about things you like, don’t like, or even ideas that I haven’t yet considered/thought of. Constructive feedback is something I truly appreciate and many of my regulars can attest to the fact that I try to follow up on these ideas whenever possible. Many of the images in my articles are the direct result of tracking that feedback.
July And August Articles
I have included the links for John and Jane’s Retirement Account articles published for the month of July. The Taxable account and Jane’s Retirement Account links are also shown below (John’s Retirement Account article will be coming in the next two weeks).
The Retiree’s Dividend Portfolio – Jane’s July Update: Record High Roth IRA Dividends
The Retirees’ Dividend Portfolio: John And Jane’s August Taxable Account Update
The Retiree’s Dividend Portfolio – Jane’s August Update: Dividend Income Set To Double After 5 Years
August 20 – September 17th Trades
My goal is to write these articles more regularly (two weeks seems like a worthwhile target moving forward) so that I can keep them reasonably short.
Taxable Account
2022-9-17 – Taxable Account Transactions (Charles Schwab)
Warner Brothers Discovery (WBD)
We closed out this position which was shares from the spin-off from AT&T (T). John and Jane still hold shares in their retirement accounts and the main reason for selling is lackluster performance, no dividend, and taking a tax loss to help offset the significant capital gains from selling 20 shares of Apple (AAPL) stock. Building cash reserves is definitely going to be more common moving forward.
Apple
We sold 20 shares to help rebuild cash reserves in the Taxable Account. We’ve been hesitant to sell AAPL stock due to the significant capital gains that would be realized at the time of sale. To help offset this, we sold shares of high-cost positions and eliminated others so that we can realize those losses.
AAPL looks fully valued at this current point in time and given the yield of .61%, there isn’t a compelling income reason for continuing to hold on to this much AAPL stock. Even positive sentiments regarding the iPhone 14 aren’t enough to convince me that there is a significant upside.
Simon Property Group (SPG)
SPG has seen its stock price sink slowly after reaching 52-week-highs in the $170/share range. The current price reflects quite a bit of pessimism after Q2-2022 earnings that showed improvement in occupancy numbers compared to Q1-2022 and rent per square foot also increased. The 7% dividend yield is sustainable based on the current FFO estimates of $11.70-$11.77 which puts the FFO payout ratio at just under 60% on the low end.
The reason we are selling shares is to eliminate a small high-cost portion where we do not see the price rebounding anytime soon due to economic weakness. This will also help reduce the downside from share prices continuing to fall (note that shares were sold at just under $101/share and now the stock is trading at just over $92/share). See the details of the cost basis below.
SPG – Lot Details – Cost Basis – 2022-9 (Charles Schwab)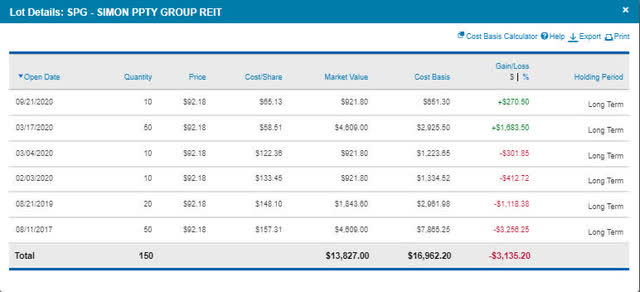
Clorox (CLX)
I recently wrote an article about CLX’s dividend increase and expressed my concerns about the stock price being too high and the potential for strong dividend increases being very poor. Slowing sales and rising material costs have made it so that I wouldn’t consider adding more shares unless the price drops below $120/share.
If the stock price continues to rise we will continue to trim it because there is no justification in my mind for the stock to sell at its current price. Lackluster dividend increases aren’t even the worst of CLX’s problems now that the safety of the dividend has come into question. In short, the stock price needs to drop considerably before we would see the cost/benefit ratio balance out. The lot details of the current position are shown below.
CLX – Lot Details – Cost Basis – 2022-9 (Charles Schwab)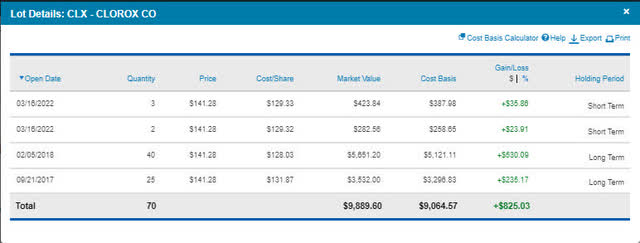
Equinix (EQIX)
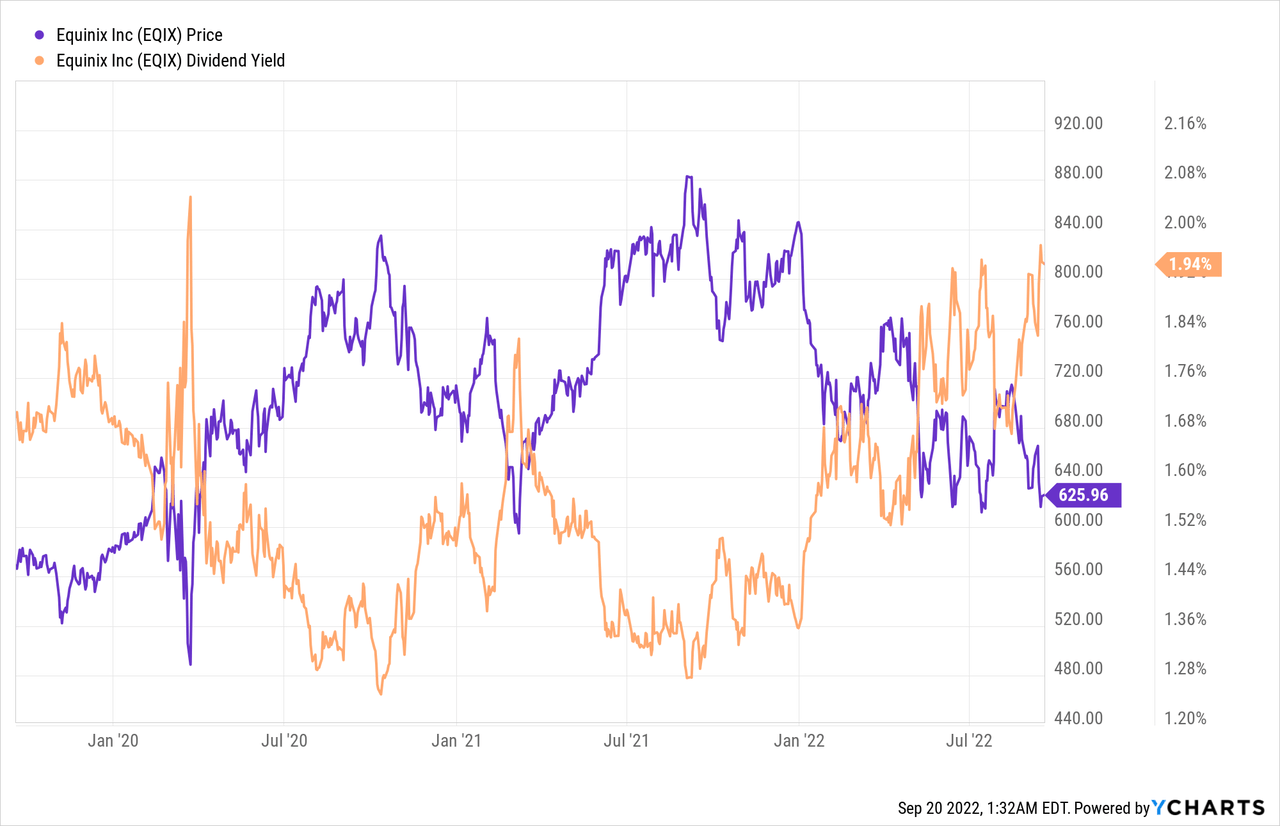
EQIX is currently trading close to a 2% dividend yield and that has been a strong resistance point for the share price over the last three years. EQIX is a behemoth in the data center space and frankly, most of the arguments given for why there is more downside were addressed by Colorado Wealth Management in his article 6 Myths Wrecked: Strong Buy Equinix. Simply put, EQIX is available at a great entry price and the risk/reward is definitely worth it which is why we picked up more shares.
EQIX is currently trading at a 2% dividend yield so we plan to add to the position with $600/share being a strong resistance point.
Jane’s Traditional IRA
2022-9-17 – Jane Traditional IRA (Charles Schwab)
Boeing (BA)
We recently trimmed back Jane’s position in Boeing and then with this sale eliminated the position altogether. Boeing continues to struggle and without a dividend or the potential of a near-term stock price turnaround, we decided it was best to take the gains and then get back to focusing on stocks that have better upside potential.
UMH Properties (UMH)
UMH operates in the affordable housing market and that is something that has become a hot topic in many communities. UMH carries the ground lease and also serves as the financing company which allows them to charge interest rates of 7-10% over 15+ year terms. We purchased more shares on apparent weakness that is misunderstood and all economic trends favor UMH’s business model by offering housing solutions that consumers want.
We will continue to add to UMH on weakness and the price is a great entry point for prospective investors.
Digital Realty (DLR)
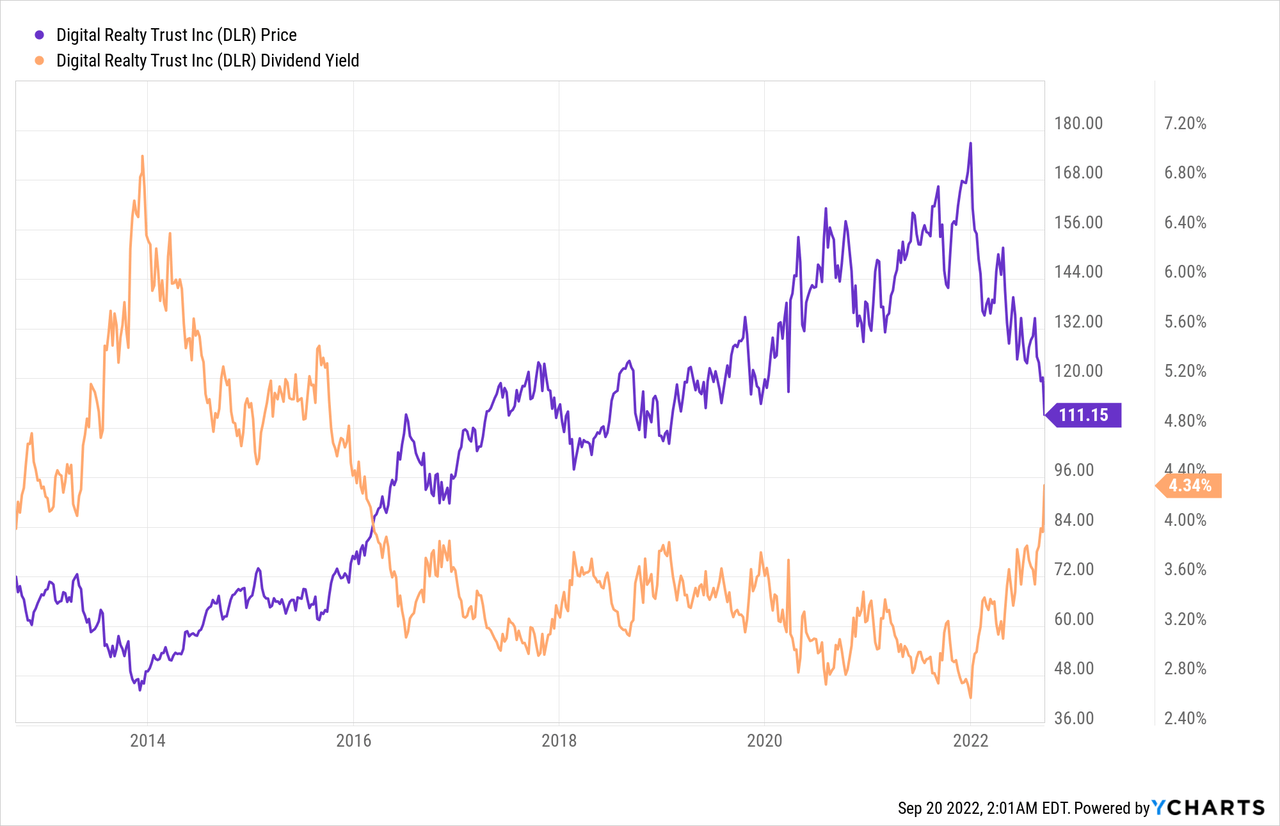
Our limit trade for the purchase of 10 shares was executed on September 2nd and the price has continued to fall even further as we see how low the 52-week-low can go. We have traded DLR regularly for quite some time and the heyday predictability of the past looks like it’s something we won’t be seeing anytime soon.
No less than a month ago would I have told you that shares trading at a dividend yield close to a 4% dividend yield would have been very attractive. Now it looks like a new price range will have us testing the $100/share marker. The important news is that the dividend is well covered with an AFFO payout ratio of 75%. You would have to go back nearly a decade ago to buy DLR when it was at the same yield.
Crown Castle International (CCI)
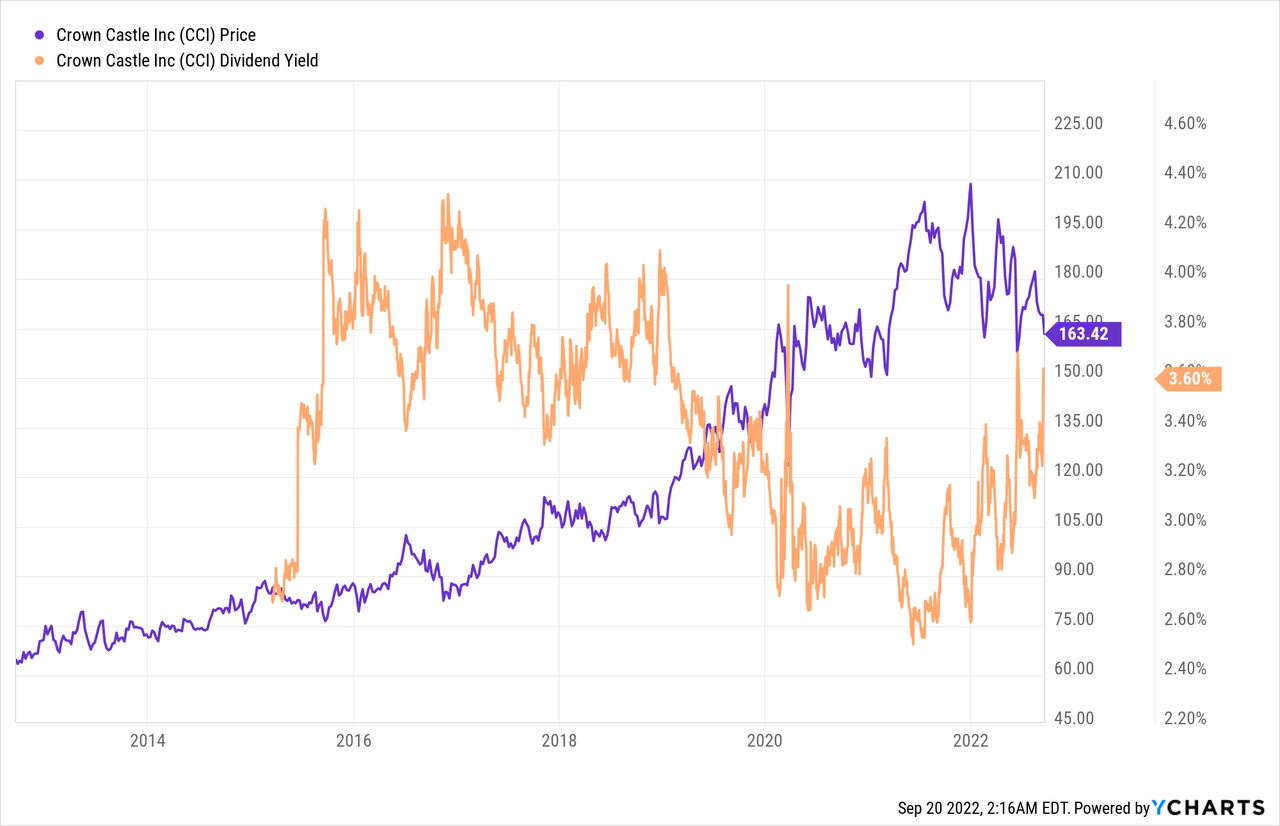
CCI has been traded a few times and we have been able to reduce the average cost of the position by quite a bit by buying and selling in small 5-10 share tranches. Here is the trading record for CCI over the last 12 months. With the dividend yield currently higher than 3.5%, we rank this as a Strong Buy with a resilient business model and high single-digit/low double-digit dividend growth going forward.
CCI – 12 Month Trade History (Charles Schwab)
In my opinion, I would be astounded if the stock price fell to the point where the dividend yield was able to exceed 4%. When you look at CCI’s business model now compared to 2016 the stability and track record (not to mention the demand for its services because of 5G) it is hard to believe that the current buying opportunity is available.
Jane’s Roth IRA
2022-9-17 – Jane Roth IRA (Charles Schwab)
STORE Capital (STOR)
The decision to sell STOR was easy to make after the stock price jumped over 20% and we were able to exit the position for the same price per share as GIC and Blue Owl’s Oak Street were buying it for – $32.25/share. With the board of directors unanimously agreeing with the sale there seems like little chance of a higher bid being made.
Cohen & Steers REIT & Preferred Income Fund (RNP)
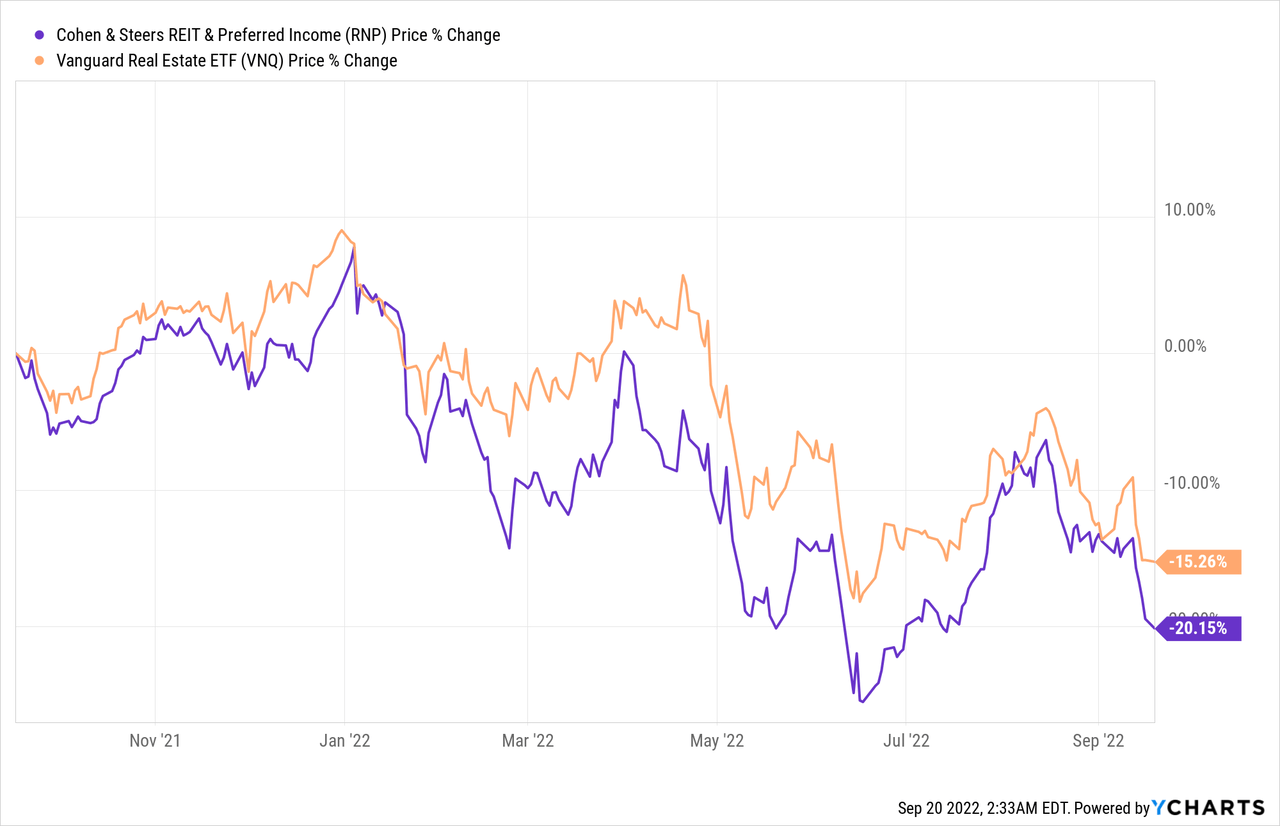
The stock price continues to fall with significant weakness in the real estate sector. Compared to a real estate ETF it is also important to consider that RNP fluctuations are going to be more extreme because it is a closed-end fund that utilizes leverage to achieve an above-average dividend yield (in the example below Vanguard’s Real Estate ETF (VNQ) is generating a 3.16% yield vs 7.44% yield offered by RNP).
We are looking to continue expanding the position because RNP is a great income play that includes a sizeable holding of preferred stock while maintaining exposure to REITs that we do not hold shares of.
New York Community Bank (NYCB)
This is a new holding in Jane’s portfolio and has been on and off my radar for a while. I plan to write a more in-depth article on Seeking Alpha that takes a deeper dive into why we chose to pull the trigger but until then I will hit on the main points.
Earnings growth in 2020 and 2021 have improved the payout ratio significantly and even with this positive news, the share price has experienced major resistance. The share price challenges NYCB has been facing appear to be related to the Flagstar Bancorp (FBC) merger that has been delayed after it was expected to close at the end of 2021. The most recent update is that the merger has been extended to October 31.
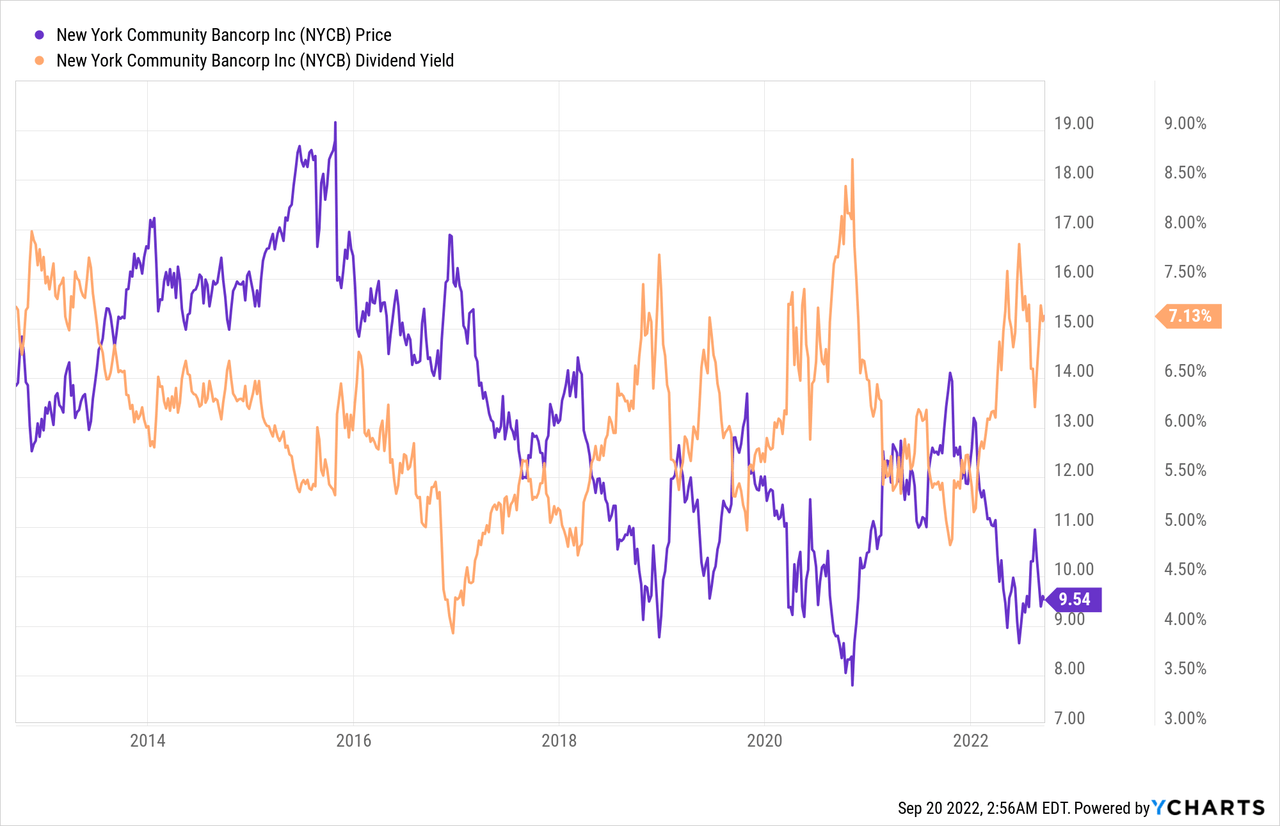
NYCB’s current yield of over 7% shows a decade-long history of being range bound between 5%-7.5% dividend yield. Although it hasn’t been able to generate the kind of dividend growth many investors would hope for it has still managed to drop its payout ratio from 90% down to 53%. As its loan portfolio grows they need cheap deposits and that is where FBC comes into play by supplying the cheap deposits needed and providing exposure to other regions (currently 54% of its physical footprint is concentrated in the state of New York).
Broadcom (AVGO)
We will always consider adding shares of AVGO when the dividend yield is greater than 3% and the big reason for this is because the 10-year dividend growth CAGR comes in at a whopping 41%! Even if we look at the five-year CAGR it’s just under 35%. While we don’t expect to see dividend increases this large in the future I do believe that 10-15% growth is still possible.
AVGO – FastGraphs – 2022-9 (FastGraphs)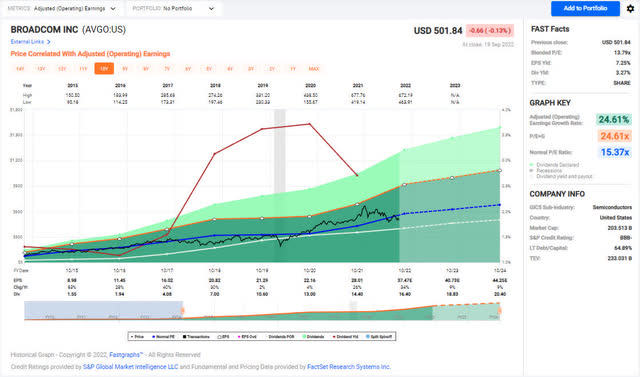
American Tower (AMT)
When we compare AMT and CCI we receive a nearly identical P/FFO Ratio but the similarities stop there with the dividend yield of sitting roughly 140 bps lower than that of CCI. AMT has been growing its dividend at 17%+ over the last three years while CCI’s dividend growth over the time frame is coming in at about half of that. The P/AFFO payout ratio is also considerably lower for AMT which further supports why it can offer such substantial dividend increases.
We recently sold off the highest-cost shares from the position to add back to cash reserves and prepare for more attractive pricing on AMT’s shares. We love the stock but would prefer to maximize our yield and upside by purchasing shares at a much more reasonable valuation. Even then, the Fastgraphs chart indicates that buying the stock at a discount to 22.90X P/AFFO is unrealistic at this point in time because shares haven’t traded at a discount to this since the start of 2019.
AMT – FastGraphs – 2022-9 (FastGraphs)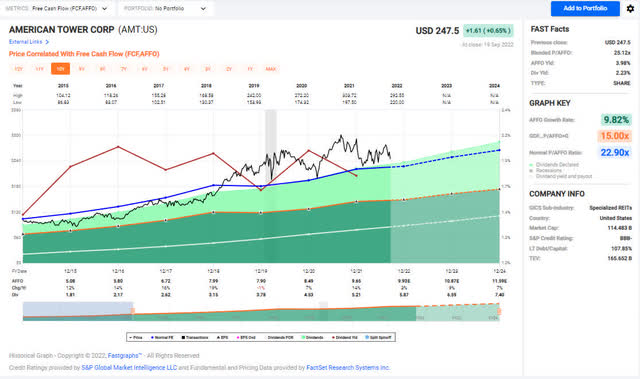
John’s Traditional IRA
2022-9-17 – John Traditional IRA (Charles Schwab)
CSX (CSX)
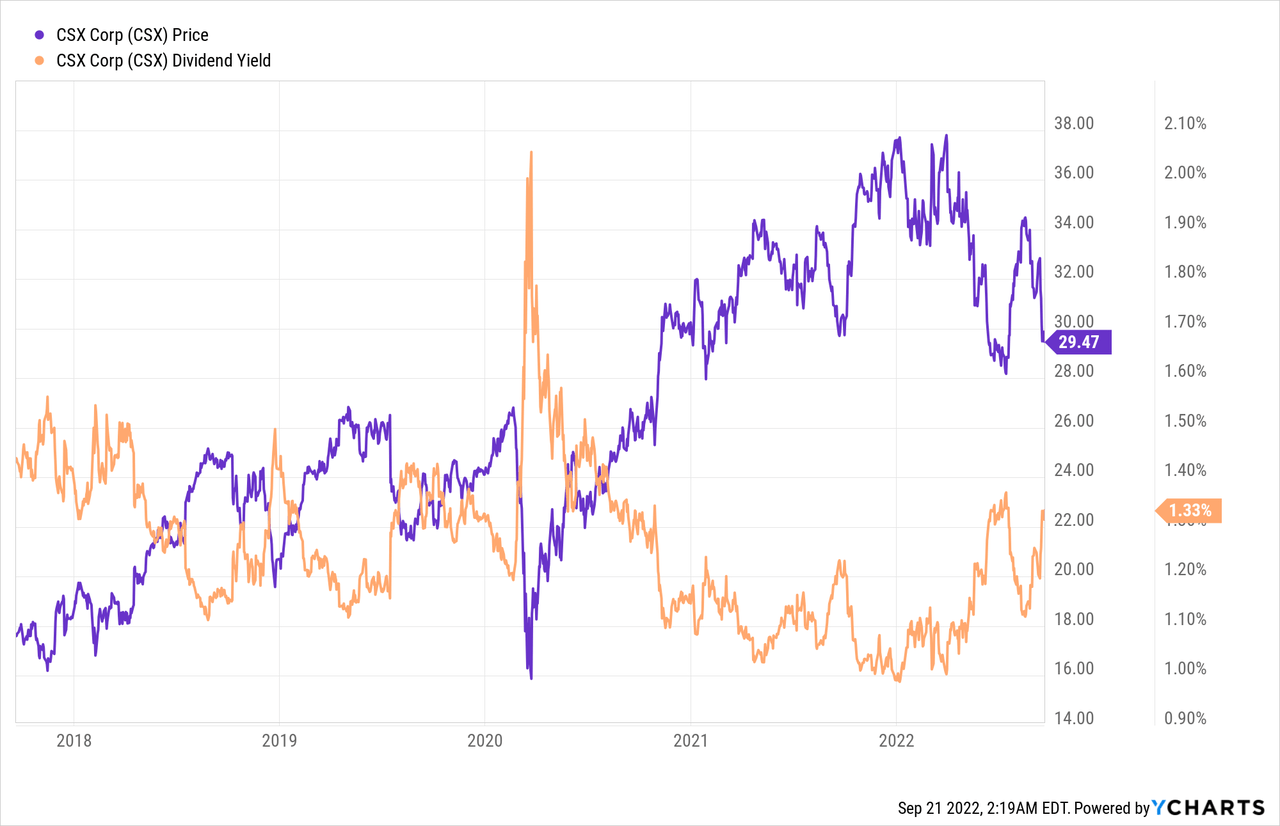
We recently sold shares of CSX as the valuation reached levels that were too optimistic for a company that will experience reduced volumes during a recessionary environment. I think the real potential of a strike was also enough to raise concerns about the stock valuation but now that a tentative agreement has been reached it means that the stock is available at a price close to its 52-week-low.
We are definitely interested buyers when shares are close to or under $30/share and will look to add more over the next week. It is also worth noting that the current price supports the historical resistance point of 1.4-1.5% dividend yield (that was only broken during the initial phase of COVID). Dividend investors likely don’t find the yield of CSX compelling but the five-year history that shows we are at the high end of the yield which indicates that CSX grows its dividend by a healthy margin (high single digits).
Bank OZK Preferred Series A (OZKAP)
Adding more shares of OZKAP is pretty straightforward because the current discount means we are able to lock in a yield of 6.4% while maintaining the potential upside that would come from the redemption of the stock. The common stock currently trades for a dividend yield of just over 3% so the risk/reward benefit for John is much more appealing on the preferred share side.
Healthcare Realty (HR)
Shares of HR were acquired after Healthcare Trust of America (HTA) agreed to be purchased and created the largest pure-play medical office building REIT. The stock price has plunged since the transaction closed even though the most recent earnings report was largely positive. Other than the initial impact during COVID, HR is trading at a price that hasn’t been seen for nearly a decade and Fastgraphs supports the notion that the stock price is cheap compared to historical pricing.
The main issue with HR in John’s portfolio is that it is already such a large position that we can’t justify increasing the size of the position much more than it already is.
HR – FastGraphs – 2022-9 (FastGraphs)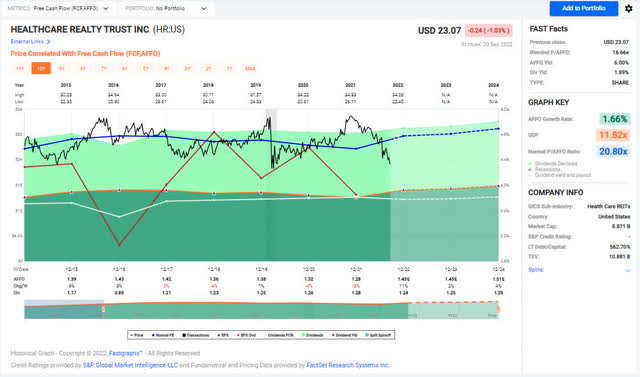
Crown Castle
We discussed our thoughts on CCI previously in this article so I won’t reiterate the same talking points.
John’s Roth IRA
2022-9-17 – John Roth IRA (Charles Schwab)
Sun Communities (SUI)
SUI has long been the gold standard for manufactured housing REITs and offered returns compelling returns and reasonable/conservative dividend growth. With that said, there was no way we could justify purchasing shares at the previous 52-week-high of $211/share which would have locked in a dividend yield of 1.5%. With the stock trading under $160/share (now under $150/share), the risk/reward scenario has improved significantly to the point where we could justify establishing our first position.
FastGraphs supports this as it is very uncommon over the last four years that SUI would trade under its 10-year P/AFFO ratio of 26.54X. Other than the initial outbreak of COVID in early 2020, the stock hasn’t been available at this valuation since the last quarter of 2018.
SUI – FastGraphs 2022-9 (FastGraphs)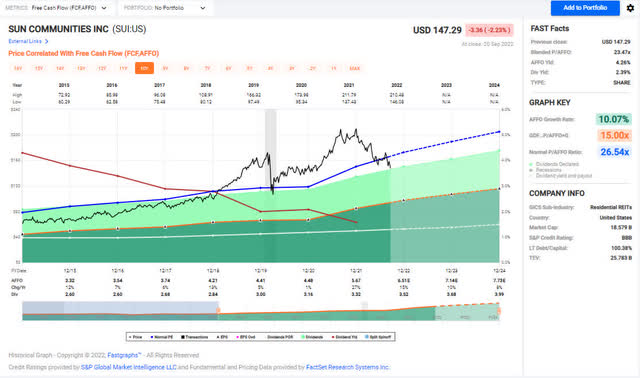
Recent/Pending Limit Trades
There have been a few limit orders that have been filled but we are being more cautious with our use of limit purchases because of the volatility in the market. There are currently two limit orders that are sales and no limit orders for purchases. Both pending sales are from Jane’s Traditional IRA.
2022-9-17 – Jane Traditional IRA Limit Trades (Charles Schwab)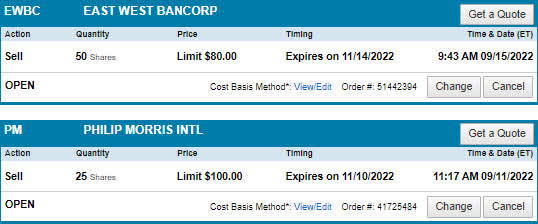
East West Bancorp (EWBC)
EWBC is a great stock but we see little upside past $80. This was set prior to the most recent federal reserve rate hike so we might have to drop it to $75 in the coming weeks. The goal is to trim the position and add back to the cash reserves. The cost basis of the EWBC position is extremely low.
EWBC – Lot Details – Cost Basis (Charles Schwab)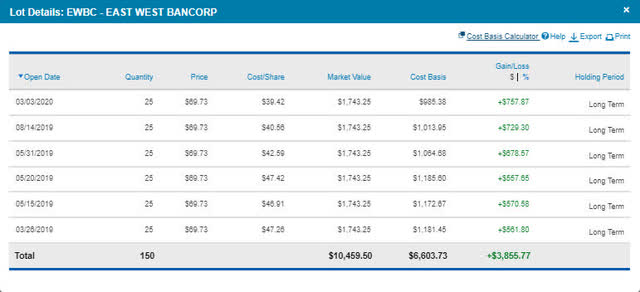
Philip Morris (PM)
We have traded around this position quite a bit with the goal of dropping the average cost basis (and for anyone who has followed my articles they would be able to see this has been a great success). We are pretty happy where the overall cost basis is currently which is why I have the price target set at $100/share but I may consider increasing it from the 25 shares currently marked for sale up to the full 50 shares. The image below shows the details of the cost basis by purchase date.
PM – Lot Details – Cost Basis (Charles Schwab)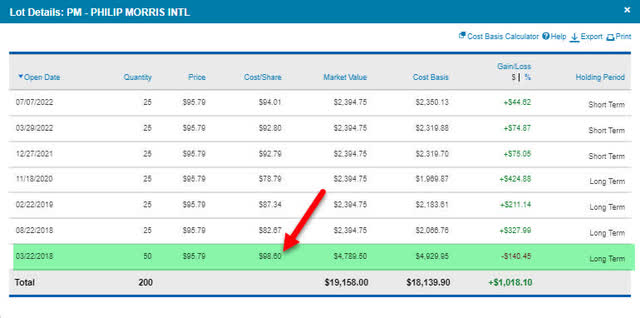
Conclusion
This has been a very active month of trading with many buying opportunities as share prices of a handful of stocks have reach 52-week-lows (and in some cases multiple year lows). This activity is fueled even more by the hawkish stance of the Federal Reserve raising the interest rates another 75 basis points.
What I find most interesting about our current economic environment is the anecdotal evidence around us that signifies a major shift that has been rapid because of the industry I work in.
- Housing Supply – We have seen a major increase in the number of houses for sale over the last few months. We are beginning to see the price drops in my market and the drop among homes for the average consumer needs to go down another 20% just to bring their monthly mortgage payment in-line with what it would be when we saw record low mortgage rates. One of our largest competitors in the area recently laid off 100 mortgage lenders and I expect to see a lot more companies make the same changes.
- Car Lot Inventory – CarMax (KMX) used to be the only dealership in town that had a lot that was constantly full of vehicles. Literally every major dealership now has a lot full of vehicles. Being that my job is to work closely with dealerships, I have seen many large financial institutions pullback their finance offering because they no longer see the benefit of offering exceptionally low rates to attract business (my wife and I previously financed a vehicle at 1.89% on 60 months which was a rate that was lower than the lowest rate my own employer could finance me for with my employee discount). Those types of offers have all disappeared and now most buyers are happy if they can get a rate of 3.49% on a 60 month term or 3.99% on an 84 month term. A major reason for this pullback is that financial institutions will have to start raising funds again as they are fully lent out because of aggressive lending policies as they attempt to gain or protect market share.
John and Jane are long all stocks mentioned in this article.
The following link can be used for my previous update – The Retirees Dividend Portfolio: Recent Purchases And Limit Trades Through August 19th


Be the first to comment