

The current environment can be categorized as nothing less than a turbulent and uncertain market. wildpixel
Market Update
In my last article, The Retirees’ Dividend Portfolio: John And Jane’s September Taxable Account Update, I was discussing the brutal market drop that started in the middle of September and continued through the end of October. The situation now has been a complete reverse of this and the market has made a significant recovery largely because of subsiding inflation concerns.
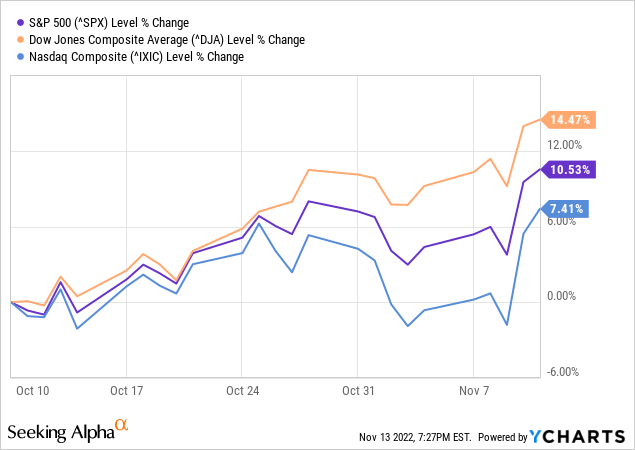
One of the most important things to notice is just how much the Nasdaq composite has seriously lagged behind the S&P 500 and the Dow Jones Industrial Average. This suggests that investors have grown cautious about sky-high tech valuations and that this rebound may be short-lived.
The Taxable account has performed well with the account balance on November 10th reaching the second highest point when compared to end-of-month balances that we track on John and Jane’s statements. This balance is also after we take into consideration that $1,000/month is currently being withdrawn to supplement their monthly income. When we take this out the account balance would be a close tie with the highest balance in 2022.
Background
For those who are interested in John and Jane’s full background, please click the following link here for the last time I published their full story. The details below are updated for 2022.
- This is a real portfolio with actual shares being traded.
- I am not a financial advisor and merely provide guidance based on a relationship that goes back several years.
- John retired in January 2018 and now only collects Social Security income as his regular source of income.
- Jane officially retired at the beginning of 2021, and she is collecting Social Security as her only regular source of income.
- John and Jane have decided to start taking draws from the Taxable Account and John’s Traditional IRA to the tune of $1,000/month each. These draws are currently covered in full by the dividends generated in each account.
- John and Jane have other investments outside of what I manage. These investments primarily consist of minimal-risk bonds and low-yield certificates.
- John and Jane have no debt and no monthly payments other than basic recurring bills such as water, power, property taxes, etc.
The reason why I started helping John and Jane with their retirement accounts is that I was infuriated by the fees they were being charged by their previous financial advisor. I do not charge John and Jane for anything that I do, and all I have asked of them is that they allow me to write about their portfolio anonymously in order to help spread knowledge and to make me a better investor in the process.
Generating a stable and growing dividend income is the primary focus of this portfolio, and capital appreciation is the least important characteristic. My primary goal was to give John and Jane as much certainty in their retirement as I possibly can because this has been a constant point of stress over the last decade.
Dividend Increases
Four companies paid increased dividends/distributions or a special dividend during the month of October in the Taxable Account.
Altria
MO is a better-run company than recent headlines have suggested but their missteps have definitely made investors skeptical of the direction the stock price is going. On a positive note, the current board of directors and executive team have long maintained a favorable shareholder return policy with the company dedicating the bulk of its cash flow to shareholders in the form of dividends and share repurchases.
It looks like shares might be moving back into the upper $30/share range which would be an excellent time to accumulate more.
MO – FastGraphs – 2022-11 (FastGraphs)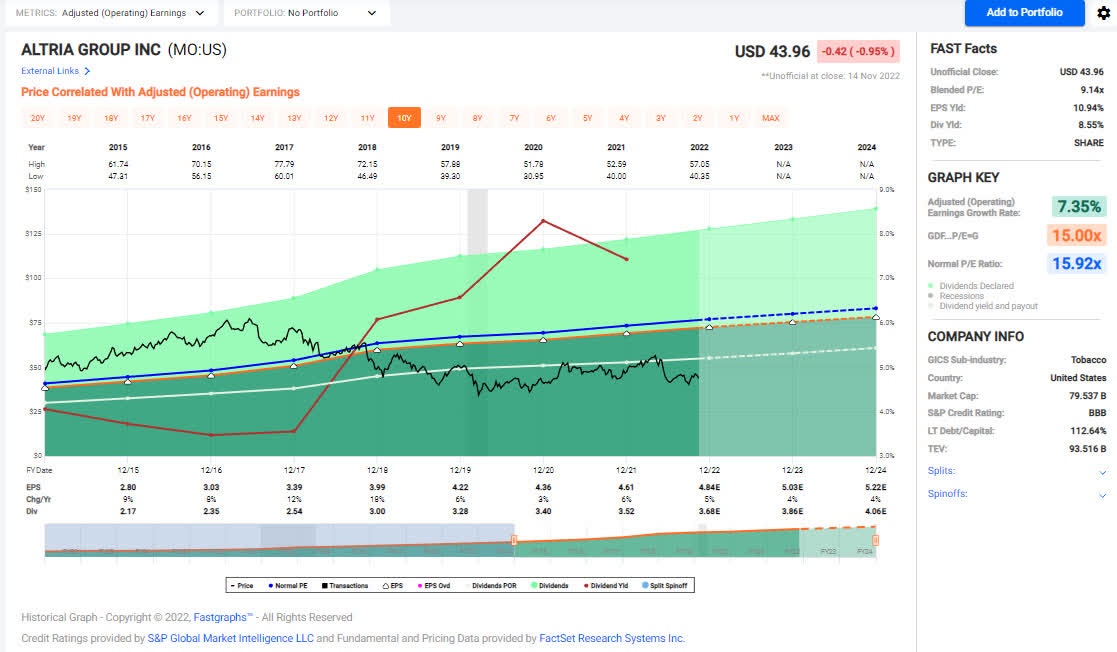
The dividend was increased from $.90/share per quarter to $.94/share per quarter. This represents an increase of 4.4% and a new full-year payout of $3.76/share compared with the previous $3.60/share. This results in a current yield of 8.63% based on the current share price of $43.67.
Realty Income
We added a small tranche of shares to John’s portfolio back in October when the price moved into the mid-$55/share range which was the lowest point seen over the last year. The stock price has consistently held strong at $60/share so when this occurred it made sense to add more. The industry still holds Realty Income as the gold standard of REITs and even though there are REITs with stronger growth and more compelling dividend increases it would be foolish to underestimate this REIT. Q3-2022 resulted in a revenue beat and boosted guidance for the year.
With the market getting more competitive and rates continuing to rise investors should hold out for a price closer to the mid-$50/share range before adding.
O – FastGraphs – 2022-11 (FastGraphs)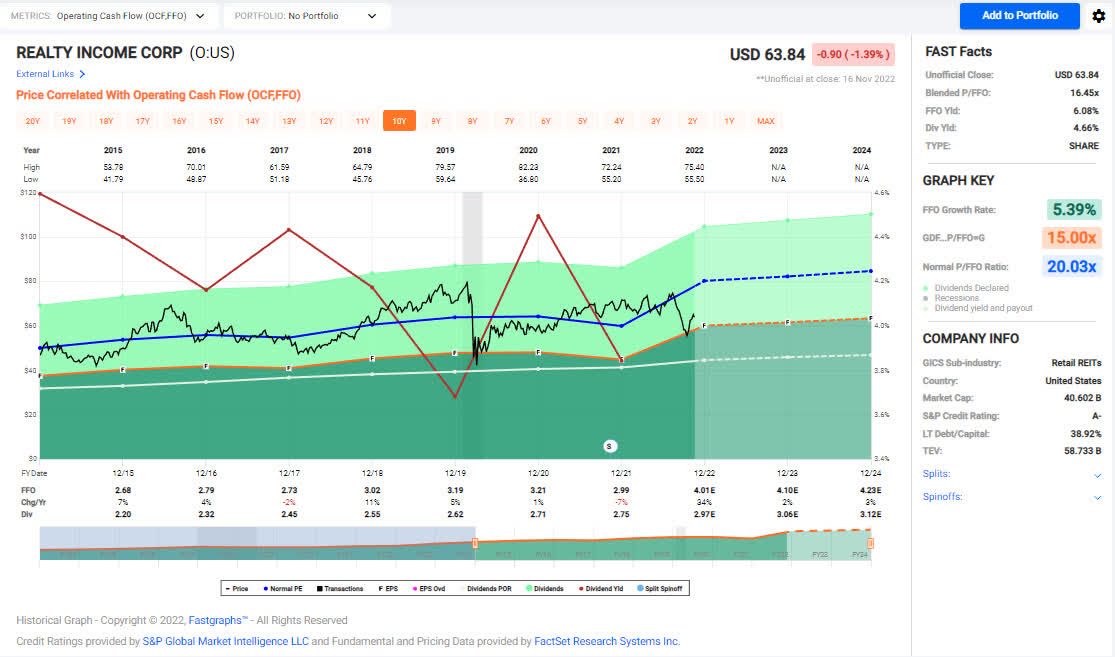
The dividend was increased from $.2475/share per month to $.2480/share per quarter. This represents an increase of .2% and a new full-year payout of $2.976/share compared with the previous $2.97/share. This results in a current yield of 4.66% based on the current share price of $64.41.
RPM International
We have been looking to add RPM to John and Jane’s portfolio with it sitting on the watchlist for at least two years now. We finally decided to pull the trigger on the pull back in March which proved to be an excellent entry point in the mid $70/share range. Since then, the stock price has skyrocketed with J.P. Morgan (JPM) calling out RPM’s ability to charge a premium for its products which led to stronger-than-expected profit growth. Looking at the FastGraphs image below it becomes clear that analyst expectations for RPM’s growth is very strong which has led the stock price to push record highs.
Although we like RPM, we are not interested in adding additional shares because the stock is priced for perfection. We won’t be adding to the position unless we see a pullback into the very low $80/share range (even then, we would prefer to wait and add at $75/share).
RPM – FastGraphs – 2022-11 (FastGraphs)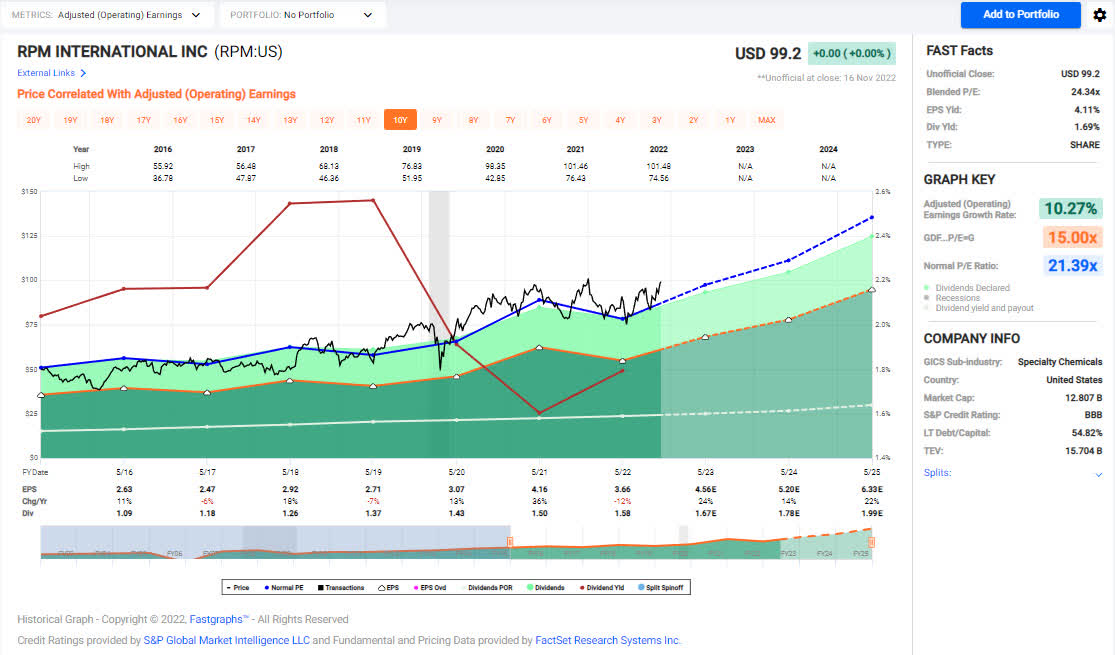
The dividend was increased from $.40/share per quarter to $.42/share per quarter. This represents an increase of 5% and a new full-year payout of $1.68/share compared with the previous $1.60/share. This results in a current yield of 1.69% based on the current share price of $98.91.
WP Carey (WPC)
Like Realty Income, we added to this position in John’s account in the month of October as well. WPC has seen its stock price skyrocket over the last year pushing valuations that have not been seen since the end of 2018. The increased share price shouldn’t have come as a surprise because WPC is consistently boosting guidance with each of earnings announcement it makes. On the Q3-2022 earnings report it was noted by the CEO Jason Fox that “As current CPI numbers flow through to rents, we expect our same-store growth to move even higher in 2023, and to continue seeing the benefits into 2024.” In other words, investors can continue to expect a premium pricing from WPC shares.
We will always add on dips in the low $70/share range but we will also trim back to our lowest cost positions when the share price pushes $90/share. With the current yield at nearly 5.5% we are very comfortable accumulating shares when the price is low and selling when they reach peak value.
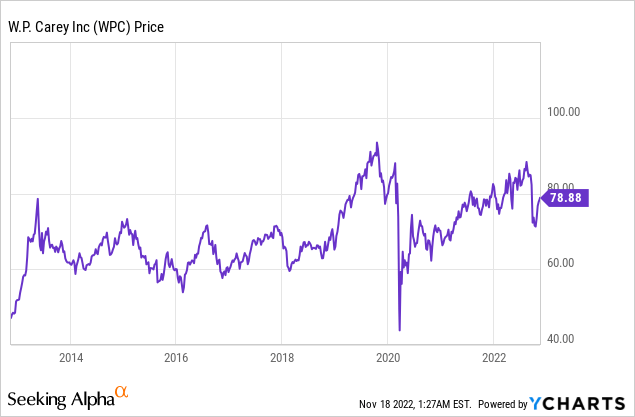
The dividend was increased from $1.059/share per quarter to $1.061/share per quarter. This represents an increase of .2% and a new full-year payout of $.4.244/share compared with the previous $4.236/share. This results in a current yield of 5.42% based on the current share price of $78.88.
Positions
The Taxable Account currently consists of 43 unique positions at market close on November 17, 2022. There were a handful of purchases that added to existing positions during the month of October.
2022 – October Taxable Transaction History (Charles Schwab)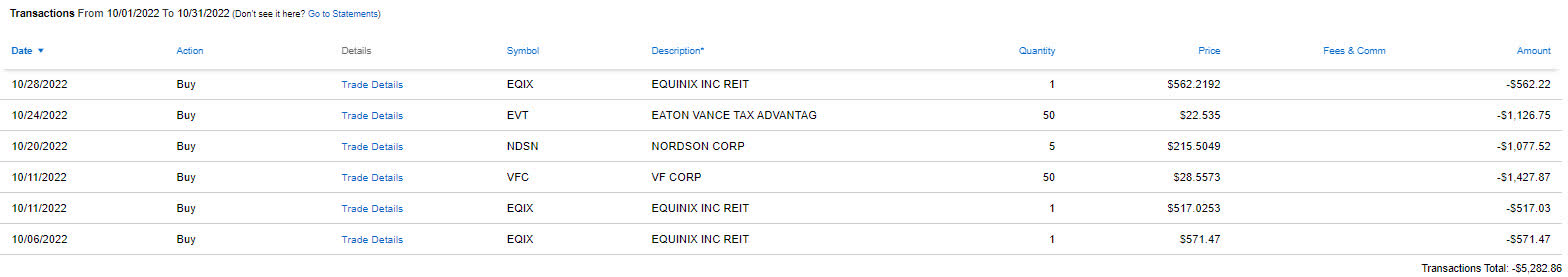
For additional information why we made some of these trades I would encourage you to check out my article that discusses the rationale for why we chose to buy/sell.
The Retirees Dividend Portfolio – Account Transactions Through October 31st
October Income Tracker – 2021 Vs. 2022
Prior to the special dividend from Old Republic International (ORI) it was estimated that the income generated in the Taxable Account would be less than what was generated in 2021. The Taxable Account is currently estimated to generate an average of $1,750.11/month of dividend income in 2022. This is now higher than the average monthly income of $1,704.23 generated in 2021 (John and Jane’s dividend income is approximately 2.7% ahead of 2021 performance).
A new item for readers to consider is the impact of draws on the Taxable Account which started in January in the amount of $1,000/month. The good news is that the portfolio generates more monthly income from dividends and distributions than John and Jane are looking to withdraw. The challenge for me is that I am used to running an account that is typically flush with excess cash that would allow greater ability to reinvest funds. Therefore, I will need to be more considerate of cash balances available at a given time. This also underscores the importance of the Cash Balance table in the images below that tracks the amount of cash on hand.
SNLH = Stocks No Longer Held – Dividends in this row represent the dividends collected on stocks that are no longer held in that portfolio. We still count the dividend income that comes from stocks no longer held in the portfolio, even though it is non-recurring. All images below come from Consistent Dividend Investor, LLC. (also referred to as CDI as the source below).
2022 – October – Taxable Dividend Breakdown (CDI)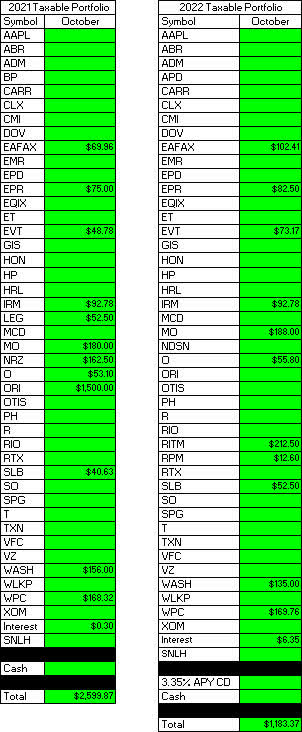
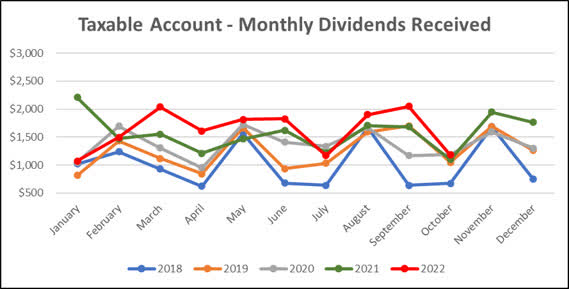
Here is a graphical illustration of the dividends received on a monthly basis. I have begun updating the chart to also reflect the dividends earned going back to January of 2018.
**Because of the large special dividend payouts that have been distorting the graphs below I have decided to remove the special dividend from the total for the graphs only. The special dividends will be reflected in all other tables.
2022 – October – Taxable Monthly Dividend Graph (CDI) 2022 – October – Taxable Monthly Dividend Line Graph (CDI)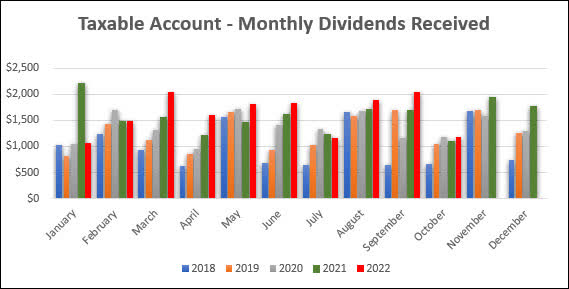
The table below represents all income generated in 2021 and collected/expected dividends in 2022.
2022 – October – Taxable Annual Estimate (CDI)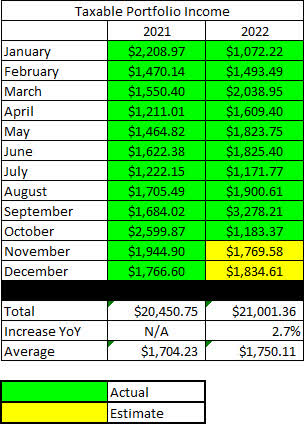
Below gives an extended look back at the dividend income generated when I first began writing these articles.
2022 – October – Taxable Dividend History (CDI)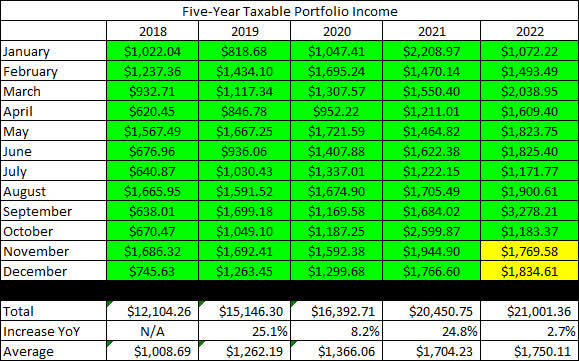
The Taxable Account balances below are from October 31, 2022, and all previous months are taken from the end-of-month statement provided by Charles Schwab.
2022 – October – Taxable Month End Balance (CDI)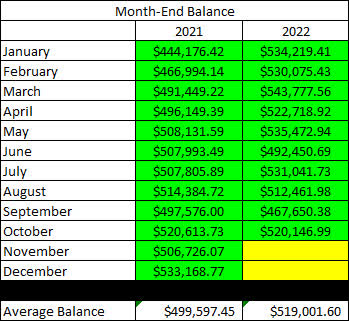
The next image is the only new table being added to the report for 2022. As mentioned previously, this is the first year that John and Jane will begin taking withdrawals from their Taxable Account (and also from John’s Traditional IRA). For this reason, I want to keep a record of these withdrawals because they will also have an impact on the account balance in the cash balance table (after this image).
2022 – October – Taxable Cash Balance (CDI)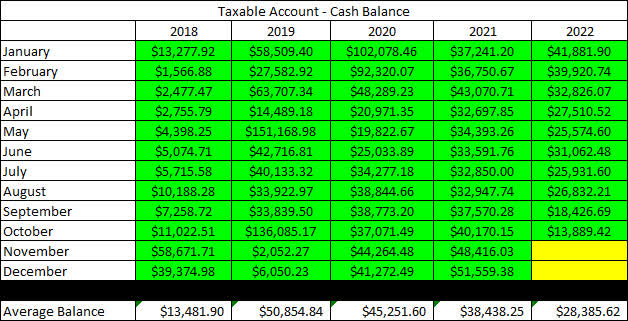
**It should be noted that the cash balance is reported as of September low by $20K which was the amount that was invested into the three month CD. Although this is an investment comparable to cash I wanted to err on the side of conservative reporting.
There were large changes in cash at the end of 2019 and then again in 2020 (this was from the purchase of a physical asset and the sale of another) which explains why the balance fluctuated so much during this time. A lot of cash was deployed in March and April of 2020 as the pandemic caused share prices to plummet. John and Jane no longer qualify to make contributions to their Traditional or Roth IRAs, so there will also not be any funds taken from the Taxable Account to cover these contributions (which is what they typically did in the past).
The next image provides a history of the unrealized gain/loss at the end of each month going back to the beginning in January of 2018.
2022 – October – Taxable Unrealized Gain-Loss (CDI)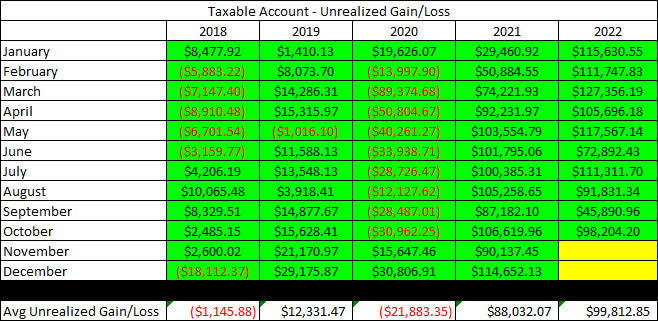
The main reason for including this is to help readers understand that the key to this strategy is to accept the risk, and I personally find that this table is an excellent representation of the volatility in the account. It is important to remember that tolerance for risk can vary significantly, but John and Jane are okay with additional risk because they are focused on generating income from these stocks.
In an effort to be transparent about John and Jane’s Taxable Account, I like to include an unrealized Gain/Loss summary. The numbers used are based on the closing prices from November 17th, 2022.
2022 – October – Taxable Gain-Loss Update (CDI)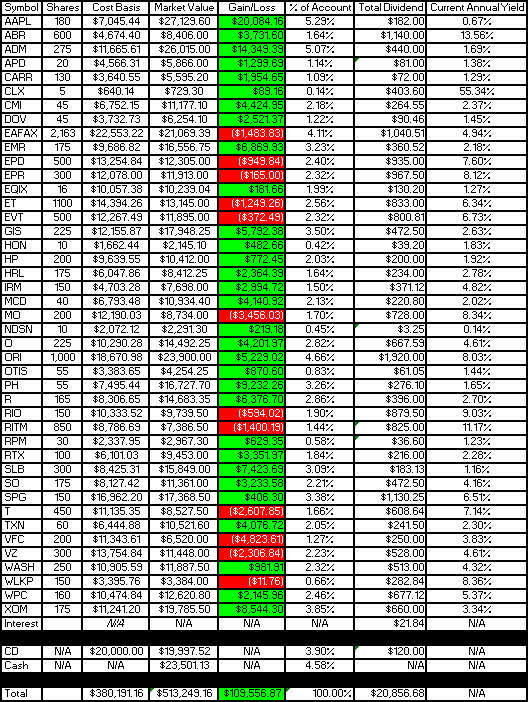
When reading the yield column, it is important to understand that the dividend yield is dependent on whether or not we have received a full year of income (this is the only way to keep it mostly accurate without requiring a lot of manual input or calculation on my part). I have updated these for the start of the year, so all yields reflected in the last column are accurate. I actually prefer this method because it will show the reduced yield of a position added partway through the year (thus reflecting an accurate benefit vs. inflated benefit).
Lastly, I wanted to include the Monthly Year-Over-Year Income Comparison to show how the Taxable Account is trending.
2022 – October – Taxable Monthly Year-Over-Year Comparison (CDI)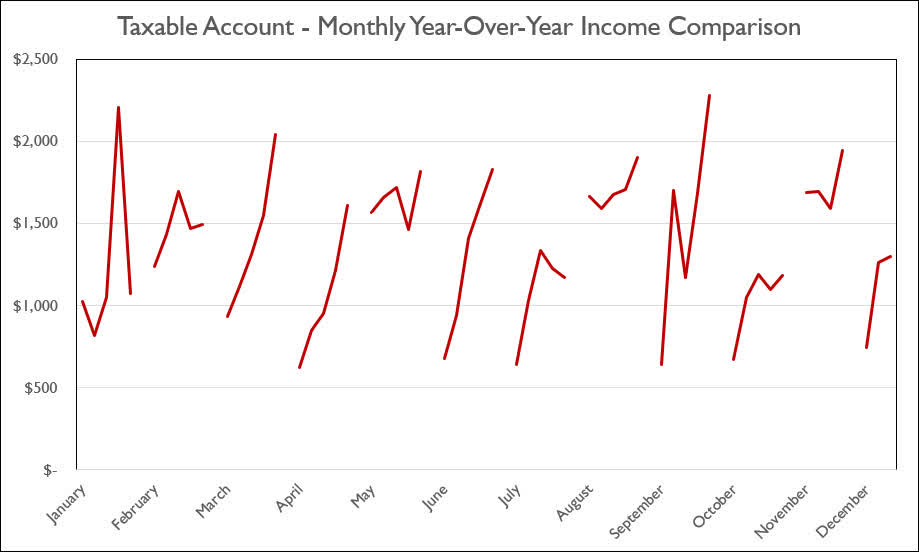
Conclusion
The market recovery over the last two weeks has been pretty impressive but I definitely have concerns about the Nasdaq and these overvalued tech companies that lack proven business models. Seeing announcements from Meta (META) and Amazon (AMZN) regarding hiring freezes and large employee layoffs are definitely worth paying attention to.
John and Jane’s portfolios remain largely focused on companies in the S&P 500 and DJIA indexes so they are definitely in a better position to weather the upcoming downturn.
In John and Jane’s Taxable Account, they are currently long the following mentioned in this article: Apple (NASDAQ:AAPL), Arbor Realty (NYSE:ABR), Archer-Daniels-Midland (NYSE:ADM), Air Products and Chemicals (APD), Carrier Global Corporation (NYSE:CARR), Clorox (NYSE:CLX), Cummins (NYSE:CMI), Dover Corporation (NYSE:DOV), Eaton Vance Floating-Rate Advantage Fund A (MUTF:EAFAX), Emerson Electric (EMR), Enterprise Products Partners (NYSE:EPD), EPR Properties (NYSE:EPR), Equinix (NASDAQ:EQIX), Energy Transfer (NYSE:ET), Eaton Vance Tax-Advantaged Dividend Income Fund (NYSE:EVT), General Mills (NYSE:GIS), Honeywell (NASDAQ:HON), Helmerich & Payne (NYSE:HP), Hormel (NYSE:HRL), Iron Mountain (NYSE:IRM), McDonald’s (MCD), Altria (NYSE:MO), Nordson (NDSN), Realty Income (O), Old Republic International (ORI), Otis Worldwide Corporation (NYSE:OTIS), Parker-Hannifin (NYSE:PH), Ryder System (NYSE:R), Rio Tinto (RIO), Rithm Capital (RITM), RPM International (RPM), Raytheon Technologies (NYSE:RTX), Schlumberger (NYSE:SLB), Southern Company (NYSE:SO), Simon Property Group (SPG), AT&T (NYSE:T), Texas Instruments (NASDAQ:TXN), V.F. Corporation (VFC), Verizon (NYSE:VZ), Washington Trust (NASDAQ:WASH), Westlake Chemical (NYSE:WLKP), W. P. Carey (NYSE:WPC), and Exxon Mobil (XOM).
Editor’s Note: This article covers one or more microcap stocks. Please be aware of the risks associated with these stocks.
Be the first to comment