

jetcityimage
Market Update
The last few weeks of the market have been brutal and we have focused on reducing exposure to certain positions without resorting to panic selling. Panic selling goes against the whole purpose of this portfolio but the cash we hold on hand is critical for helping us establish new positions or increasing existing positions where the value is compelling.
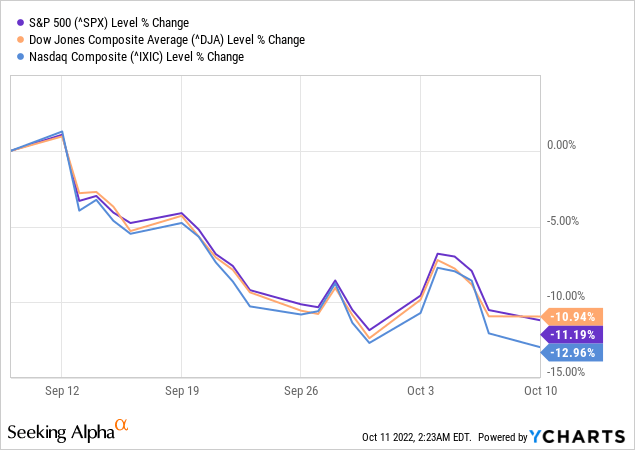
Over the last month, all three major indexes were down double-digit percentages.
Using the same starting date of September 9th, the Taxable Account originally had an account balance (cash plus all investments) of $520.5K. Today, that same account balance sits at $480.5k, or a loss of $40k of investment value. This works out to be a loss of 7.7% over the same time period.
For good measure, if we subtracted out the dividend income earned in September of $3,278.21 but added back in the $1,000 withdrawn we would arrive at an account balance of $478.2K. This would result in a loss of 8.1% which still beats the performance of the best index by nearly 300 basis points.
Background
For those who are interested in John and Jane’s full background, please click the following link here for the last time I published their full story. The details below are updated for 2022.
- This is a real portfolio with actual shares being traded.
- I am not a financial advisor and merely provide guidance based on a relationship that goes back several years.
- John retired in January 2018 and now only collects Social Security income as his regular source of income.
- Jane officially retired at the beginning of 2021, and she is collecting Social Security as her only regular source of income.
- John and Jane have decided to start taking draws from the Taxable Account and John’s Traditional IRA to the tune of $1,000/month each. These draws are currently covered in full by the dividends generated in each account.
- John and Jane have other investments outside of what I manage. These investments primarily consist of minimal-risk bonds and low-yield certificates.
- John and Jane have no debt and no monthly payments other than basic recurring bills such as water, power, property taxes, etc.
The reason why I started helping John and Jane with their retirement accounts is that I was infuriated by the fees they were being charged by their previous financial advisor. I do not charge John and Jane for anything that I do, and all I have asked of them is that they allow me to write about their portfolio anonymously in order to help spread knowledge and to make me a better investor in the process.
Generating a stable and growing dividend income is the primary focus of this portfolio, and capital appreciation is the least important characteristic. My primary goal was to give John and Jane as much certainty in their retirement as I possibly can because this has been a constant point of stress over the last decade.
Dividend Decreases
Rio Tinto (RIO) is the only company that decreased its interim dividend (paid semi-annually) but we won’t discuss this further because it is well-known that this is a variable dividend policy and announcing large decreases and increases would create a lot of extra fluff in the article.
Dividend Increases
Six companies paid increased dividends/distributions or a special dividend during the month of September in the Taxable Account.
- Cummins (CMI)
- Dover (DOV)
- Nordson (NDSN)
- Old Republic International (ORI)
- Ryder System (R)
- Simon Property Group (SPG)
Cummins
CMI has performed exceptionally well YTD 2022 relative to the rest of the market over the same period. The dividend increase of 8.3% is consistent with the five-year average growth rate of 7.34% but significantly under the 10-year average growth rate of 13.29%. Considering many of the changes that are taking place at CMI including the potential spin-off of the filtration business and its advancement into the clean energy arena that includes electric, hydrogen, etc. CMI shares remain attractive at yields over 3% and those looking for exceptionally strong pricing may even wait for yields closer to 3.25%. Considering John and Jane have exposure to CMI in their Taxable And Retirement Portfolios, we are more likely to wait until shares are closer to the $190/share price point before adding additional shares.
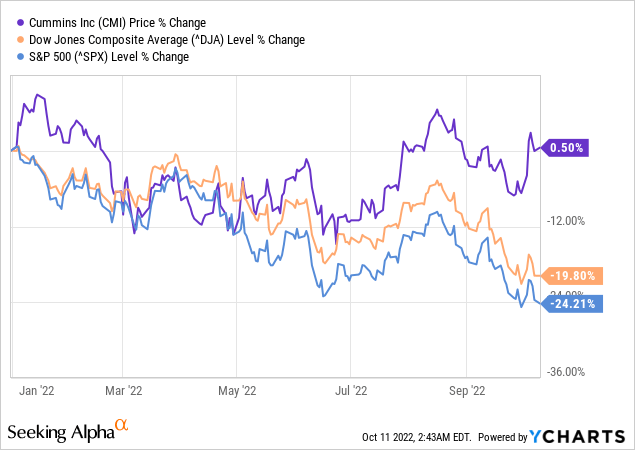
The dividend was increased from $1.45/share per quarter to $1.57/share per quarter. This represents an increase of 8.3% and a new full-year payout of $6.28/share compared with the previous $5.80/share. This results in a current yield of 2.88% based on the current share price of $219.24.
Dover
DOV is currently the opposite of CMI in terms of how the stock price has performed YTD-2022. Dividend investors are also likely to scoff at the paltry dividend yield of 1.67% and its three-year average dividend growth rate of 1.28%. So why did this dividend king with a 65-year track record of consecutive annual dividend increases? Is there a reason why DOV has avoided offering large dividend increases even though it currently has a low payout ratio of 25%? Lastly, what has allowed its share price to continue to increase (the stock price has tripled over the last decade) and subsequently caused its dividend yield to reach a record low?
The chart below covers most of what investors need to know about DOV. Over the last few years, the company has gone from a stereotypical dividend king with a slow-growth business model to a company that continues to break EPS records and massive increases in revenue. DOV has managed to do this by investing heavily in acquisitions. Since 2020, DOV has acquired 17 companies, and since 2010 company has completed over 50 acquisitions.
In short, the pullback is a welcome occurrence because anything that gets the yield closer to 2% is attractive to me based on its historical yield. With that said, investors will likely need to consider buying shares at a less attractive yield simply because the company is firing on all cylinders and should be regarded as a high-powered growth stock that happens to pay a dividend.
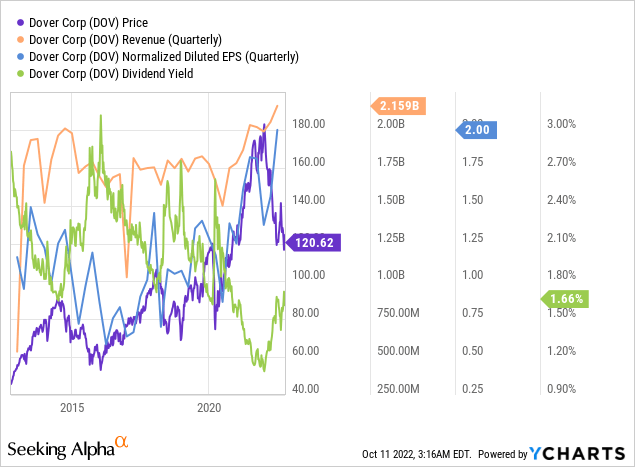
The dividend was increased from $.50/share per quarter to $.505/share per quarter. This represents an increase of 1% and a new full-year payout of $2.02/share compared with the previous $2.00/share. This results in a current yield of 1.67% based on the current share price of $120.62.
Nordson
NDSN is a niche company that offers compelling earnings growth and a phenomenal dividend growth trajectory that is uncommon to see for a company that has a track record of 58 years of consecutive annual dividend increases. Don’t let the current yield of 1.21% fool you because anything over a 1% dividend yield is attractive based on the average historical yield. NDSN’s average dividend increase for its three-year and 10-year averages is over 15% which is one of the highest I have ever seen for a company with a meaningful dividend growth history. Even with these significant increases, the company has been able to maintain a payout ratio lower than 30% over the last five years. NDSN is extremely compelling by under $200/share but this has only been available for a short window of time in the last 18 months. We will likely establish limit trades for a small number of shares at $210/share and $200/share.
Nordson (FastGraphs)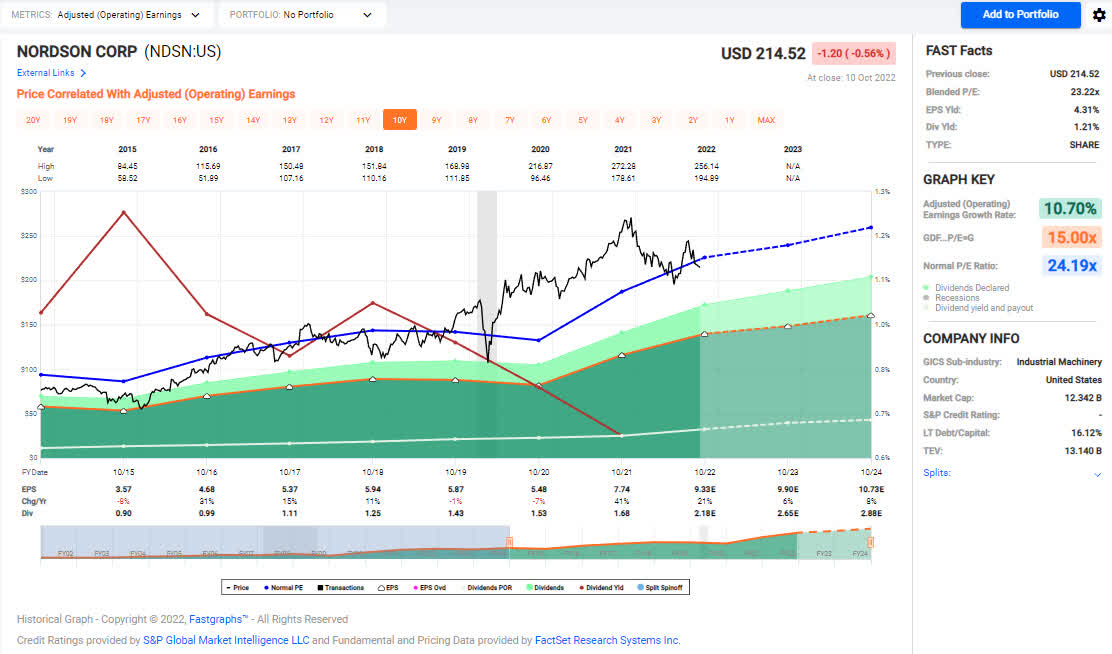
The dividend was increased from $.51/share per quarter to $.65/share per quarter. This represents an increase of 27.5% and a new full-year payout of $2.60/share compared with the previous $2.04/share. This results in a current yield of 1.21% based on the current share price of $214.52.
Old Republic International
ORI has quickly become one of my favorite dividend-paying stocks because its model is based on a conservative quarterly dividend with small and sustainable annual increases but the company provides shareholders with incredible special dividends that can result in a yield that is nearly double the normal dividend payout. Since 2018, ORI has issued five special dividends totaling $5.50/share meanwhile the regular quarterly dividend payments through FY-2022 will amount to $4.22/share. This works out to be an average annual dividend payout of $1.94/share annually over the last five years and results in an effective yield of 8.78%. It is likely that there will be fewer special dividends moving forward because most of these special dividends were the result of the high number of transactions for its Title Insurance segment. Regardless, ORI has provided a stable dividend with regular annual increases since 1983, or over 40 years and we expect they will continue to provide favorable special dividends when earnings allow.
ORI (FastGraphs)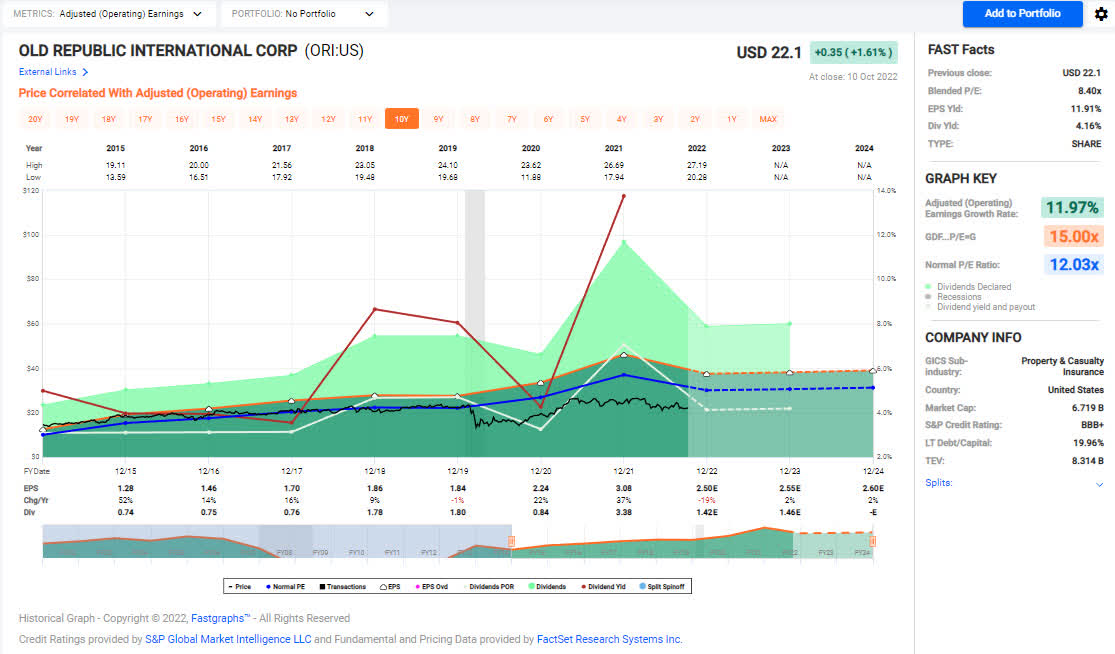
ORI paid a one-time special dividend of $100/share in the month of September.
Ryder System
Ryder is an interesting stock and rather than regurgitate what others have said about the company I would strongly encourage anyone who is interested to read Leo Nelissen’s article What To Make Of Ryder’s Dividends And Ridiculous Valuation for a comprehensive review of what is taking place. Ryder is not particularly known for its dividend history, although it does come with a 16 year history of consecutive annual dividend increases. Unlike many companies that have been around as long as Ryder has, the average dividend growth over the last three years is nearly double the average dividend growth over the last 10 years. The company also carries a low payout ratio of 22.6%. We have considered trimming the position on a number of occasions but the reality is that the stock is likely worth considerably more as Leo pointed out in his article. We plan to continue holding shares for the time being.
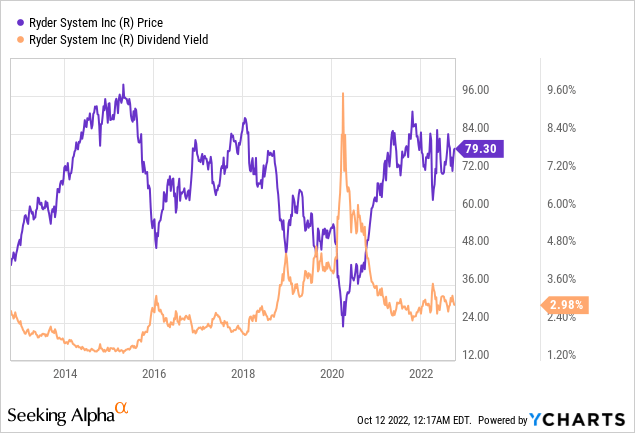
The dividend was increased from $.58/share per quarter to $.62/share per quarter. This represents an increase of 6.9% and a new full-year payout of $2.48/share compared with the previous $2.32/share. This results in a current yield of 3.05% based on the current share price of $79.30.
Simon Property Group
We recently sold some of the high-cost position for SPG to harvest capital losses and offset some of the gains there were realized after the sale of Apple (AAPL) stock. We opted to sell shares because I think it will be a considerable amount of time before the stock price moves back up into the $175/share range. Furthermore, the current yield is compelling and if shares dropped into the low $80/share range we would consider making another sizable purchase.
SPG recently raised the FY-2022 guidance after a strong Q2 2022 earnings report. In this report I was most pleased to see that occupancy has increased to 93.9% as of June 30, 2022 compared to 93.3% on March 31 of the same year. At this point there is really no competitor with the size and resources to replicate what SPG can do so even though it share price is taken a beating over the last several months it is absolutely critical to remember that SPG is one of the best position companies to handle a downturn and likely has the ability to strategically acquire its competition at discounted prices.
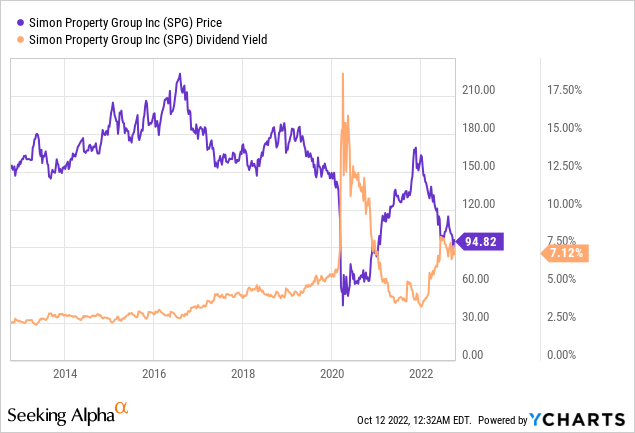
The dividend was increased from $1.65/share per quarter to $1.75/share per quarter. This represents an increase of 6.1% and a new full-year payout of $7.00/share compared with the previous $6.60/share. This results in a current yield of 7.57% based on the current share price of $94.82.
Positions
The Taxable Account currently consists of 44 unique positions at market close on October 9th, 2022. There was only one purchase that took place during the month of August.
2022 – September Taxable Transaction History (Charles Schwab)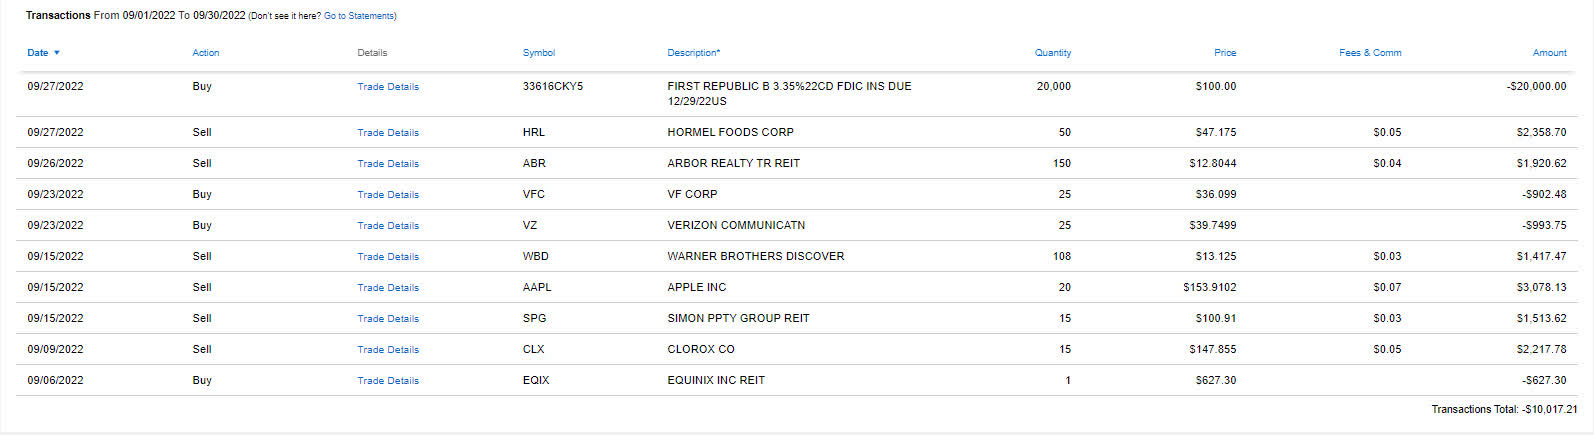
I will discuss these trades more in-depth in my article that discusses these trades. The link below is my purchases/trades article from September 24, 2022.
The Retirees Dividend Portfolio: Recent Purchases And Limit Trades Through September 17th
September Income Tracker – 2021 Vs. 2022
The Taxable Account is now finally in the black for 2022, and this is thanks to the large special dividends paid by Old Republic International. Prior to the special dividend it was estimated that the income generated in the Taxable Account would be less than what was generated in 2021. The Taxable Account is currently estimated to generate an average of $1,746.15/month of dividend income in 2022. This is now higher than the average monthly income of $1,704.23 generated in 2021 (John and Jane are approximately 2.5% ahead of 2021 performance).
A new item for readers to consider is the impact of draws on the Taxable Account which started in January in the amount of $1,000/month. The good news is that the portfolio generates more monthly income from dividends and distributions than John and Jane are looking to withdraw. The challenge for me is that I am used to running an account that is typically flush with excess cash that would allow greater ability to reinvest funds. Therefore, I will need to be more considerate of cash balances available at a given time. This also underscores the importance of the Cash Balance table in the images below that tracks the amount of cash on hand.
SNLH = Stocks No Longer Held – Dividends in this row represent the dividends collected on stocks that are no longer held in that portfolio. We still count the dividend income that comes from stocks no longer held in the portfolio, even though it is non-recurring. All images below come from Consistent Dividend Investor, LLC. (also referred to as CDI as the source below).
2022 – September – Taxable Dividend Breakdown (CDI)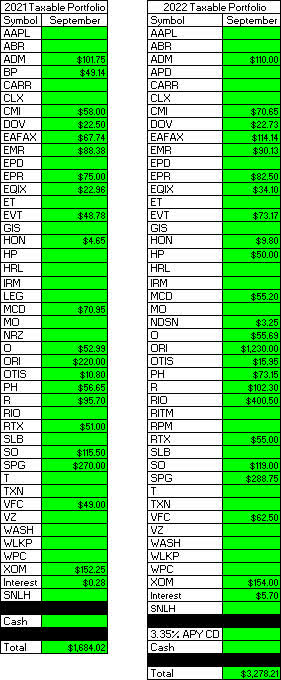
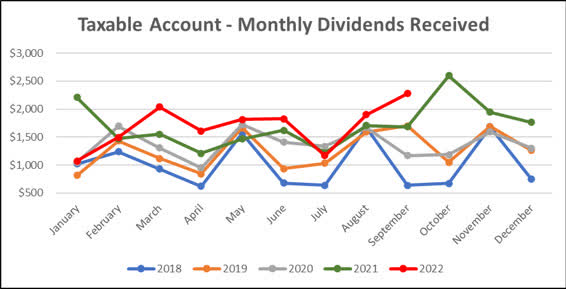
Here is a graphical illustration of the dividends received on a monthly basis. I have begun updating the chart to also reflect the dividends earned going back to January of 2018.
2022 – September – Taxable Monthly Dividend Graph (CDI) 2022 – September – Taxable Monthly Dividend Line Graph (CDI)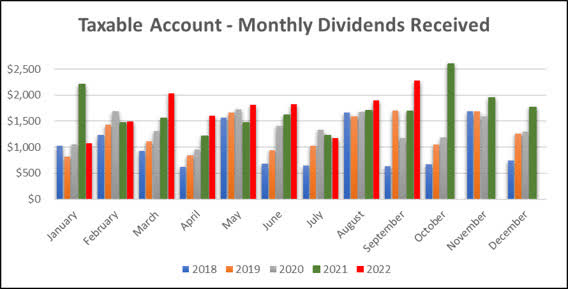
The table below represents all income generated in 2021 and collected/expected dividends in 2022.
2022 – September – Taxable Annual Estimate (CDI)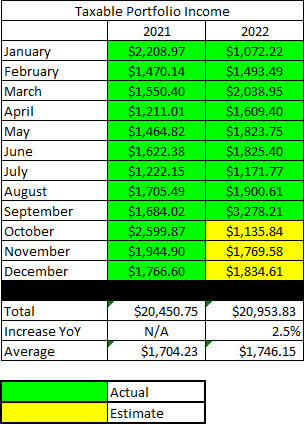
Below gives an extended look back at the dividend income generated when I first began writing these articles.
2022 – September – Taxable Dividend History (CDI)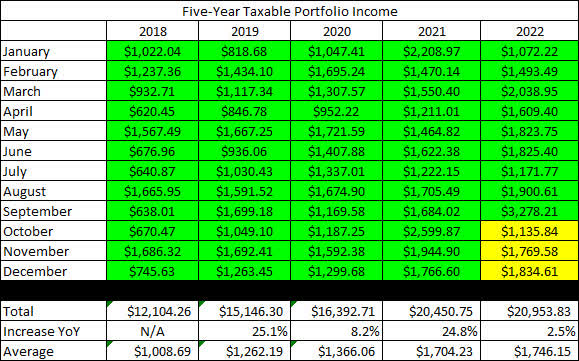
The Taxable Account balances below are from September 30, 2022, and all previous months are taken from the end-of-month statement provided by Charles Schwab.
2022 – September – Taxable Month End Balance (CDI)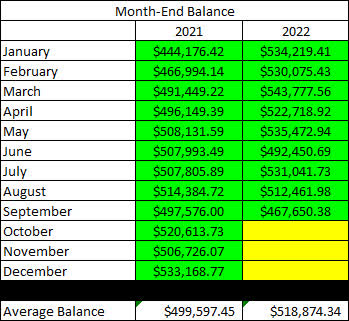
The next image is the only new table being added to the report for 2022. As mentioned previously, this is the first year that John and Jane will begin taking withdrawals from their Taxable Account (and also from John’s Traditional IRA). For this reason, I want to keep a record of these withdrawals because they will also have an impact on the account balance in the cash balance table (after this image).
2022 – September – Taxable Cash Balance (CDI)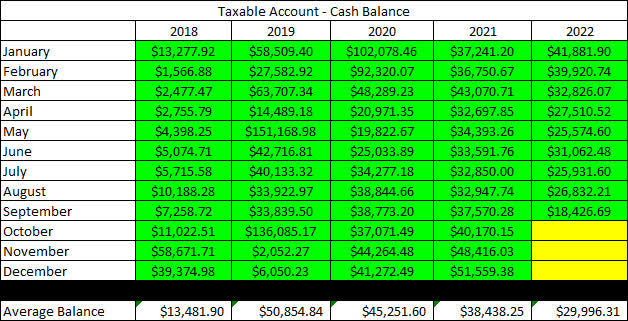
**It should be noted that the cash balance is reported as of September low by $20K which was the amount that was invested into the three month CD. Although this is an investment comparable to cash I wanted to err on the side of conservative reporting.
There were large changes in cash at the end of 2019 and then again in 2020 (this was from the purchase of a physical asset and the sale of another) which explains why the balance fluctuated so much during this time. A lot of cash was deployed in March and April of 2020 as the pandemic caused share prices to plummet. John and Jane no longer qualify to make contributions to their Traditional or Roth IRAs, so there will also not be any funds taken from the Taxable Account to cover these contributions (which is what they typically did in the past).
The next image provides a history of the unrealized gain/loss at the end of each month going back to the beginning in January of 2018.
2022 – September – Taxable Unrealized Gain-Loss (CDI)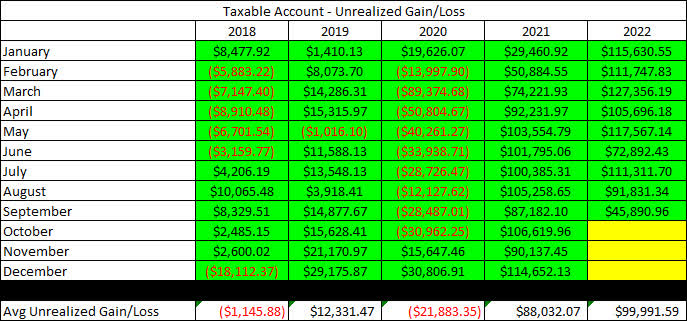
The main reason for including this is to help readers understand that the key to this strategy is to accept the risk, and I personally find that this table is an excellent representation of the volatility in the account. It is important to remember that tolerance for risk can vary significantly, but John and Jane are okay with additional risk because they are focused on generating income from these stocks.
In an effort to be transparent about John and Jane’s Taxable Account, I like to include an unrealized Gain/Loss summary. The numbers used are based on the closing prices from October 9th, 2022.
2022 – September – Taxable Gain-Loss Update (CDI)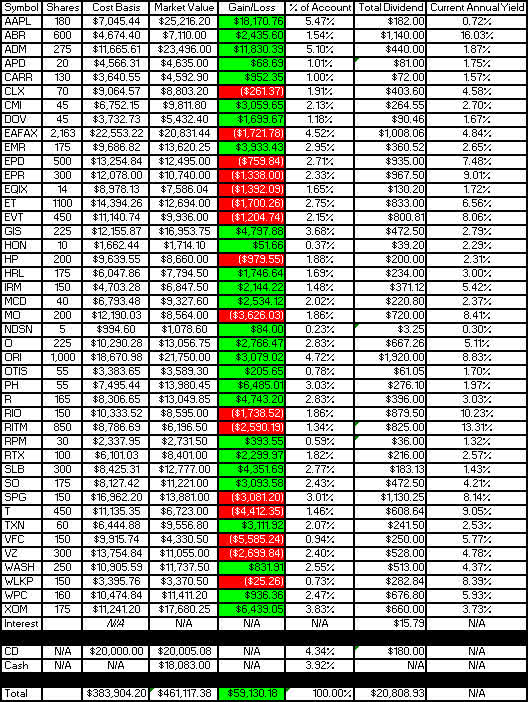
When reading the yield column, it is important to understand that the dividend yield is dependent on whether or not we have received a full year of income (this is the only way to keep it mostly accurate without requiring a lot of manual input or calculation on my part). I have updated these for the start of the year, so all yields reflected in the last column are accurate. I actually prefer this method because it will show the reduced yield of a position added partway through the year (thus reflecting an accurate benefit vs. inflated benefit).
Lastly, I wanted to include the Monthly Year-Over-Year Income Comparison to show how the Taxable Account is trending.
2022 – September – Taxable Monthly Year-Over-Year Comparison (CDI)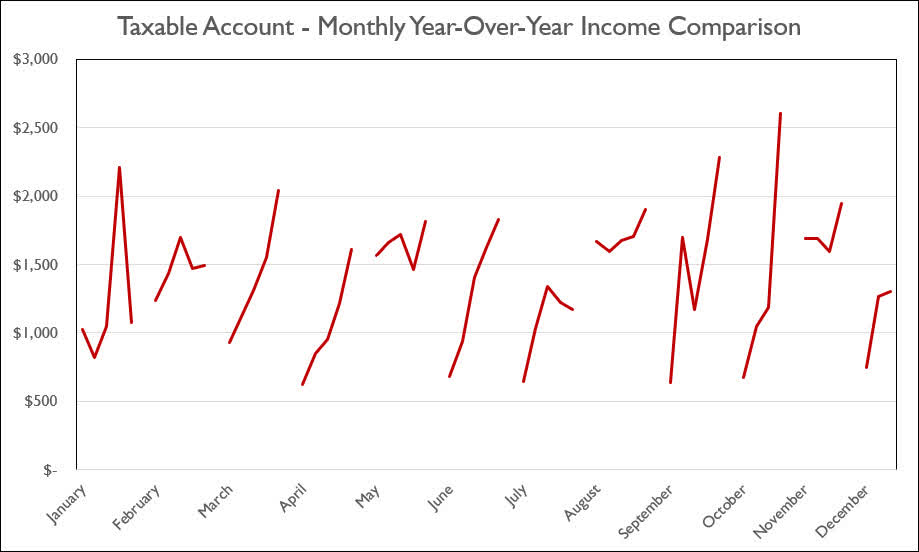
Conclusion
Of the six companies that paid increased dividends during the month of September I found the following three to be the most interesting to compare.
As major industrials that operate in different segments I thought it would be interesting to see just how compelling the risk/reward scenario would be. Let’s start by comparing the 10-year history as it related to the dividend yield and share price.
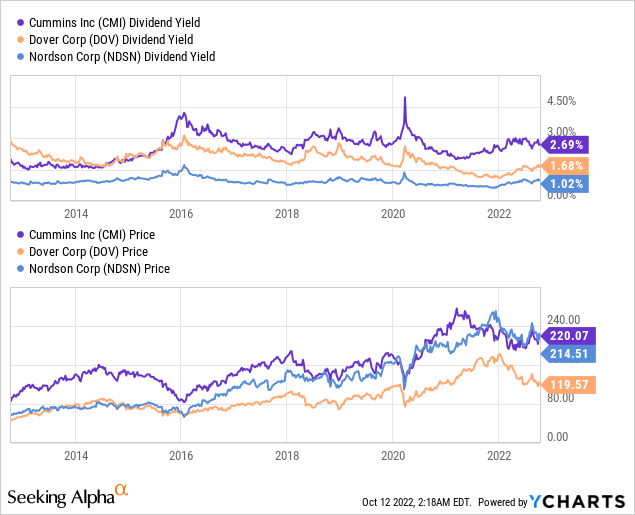
What is ironic about NDSN’s dividend yield is that even though it offers the lowest yield (by a longshot) it has the highest 10-year average growth rate of all three companies. This may strike investors as odd, but when we consider the rapid ascent of its share price (which has nearly tripled over the last ten years) we can say that the reason why the dividend yield remains low is because the stock price is growing so quickly that it is able to offset the growth of the dividend. NDSN’s dividend is the only one of the three companies that has maintained a short-term growth (three-year average) rate that is comparable to its long-term rate (ten-year average).
Cummins
- 10-Year Average – 13.3%
- 3-Year Average – 7.8%
Dover
- 10-Year Average – 8.74%
- 3-Year Average – 1.28%
Nordson
- 10-Year Average – 15.3%
- 3-Year Average – 15.1%
Simply put, CMI and DOV’s dividend increases are getting lower while Nordson is about to provide above-average increases because of their strong business model and exceptionally low payout ratio.
Another interesting perspective to consider is what a $10k investment into each company a decade ago would have provided as a return?
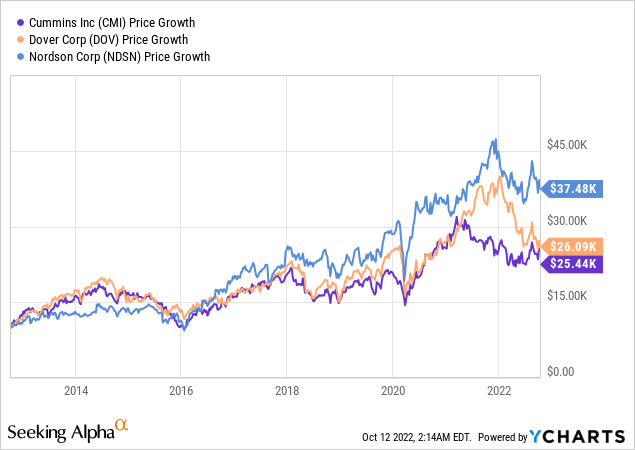
Let me be clear and say that I believe all three investments present compelling reasons to consider owning them as part of an investment portfolio. With that said, it would be difficult to not arrive at the conclusion that NDSN has proven to be a superior investment. NDSN selling on the low-end of its 52-week-range should be considered an excellent entry point.
In John and Jane’s Taxable Account, they are currently long the following mentioned in this article: Apple (NASDAQ:AAPL), Arbor Realty (NYSE:ABR), Archer-Daniels-Midland (NYSE:ADM), Air Products and Chemicals (APD), Carrier Global Corporation (NYSE:CARR), Clorox (NYSE:CLX), Cummins (NYSE:CMI), Dover Corporation (NYSE:DOV), Eaton Vance Floating-Rate Advantage Fund A (MUTF:EAFAX), Emerson Electric (EMR), Enterprise Products Partners (NYSE:EPD), EPR Properties (NYSE:EPR), Equinix (NASDAQ:EQIX), Energy Transfer (NYSE:ET), Eaton Vance Tax-Advantaged Dividend Income Fund (NYSE:EVT), General Mills (NYSE:GIS), Honeywell (NASDAQ:HON), Helmerich & Payne (NYSE:HP), Hormel (NYSE:HRL), Iron Mountain (NYSE:IRM), McDonald’s (MCD), Altria (NYSE:MO), Nordson (NDSN), Realty Income (O), Old Republic International (ORI), Otis Worldwide Corporation (NYSE:OTIS), Parker-Hannifin (NYSE:PH), Ryder System (NYSE:R), Rio Tinto (RIO), Rithm Capital (RITM), RPM International (RPM), Raytheon Technologies (NYSE:RTX), Schlumberger (NYSE:SLB), Southern Company (NYSE:SO), Simon Property Group (SPG), AT&T (NYSE:T), Texas Instruments (NASDAQ:TXN), V.F. Corporation (VFC), Verizon (NYSE:VZ), Washington Trust (NASDAQ:WASH), Westlake Chemical (NYSE:WLKP), W. P. Carey (NYSE:WPC), and Exxon Mobil (XOM).
Be the first to comment