

jetcityimage/iStock Editorial via Getty Images
The month of June was pretty rough even for the most conservative of investment portfolios. Part of the reason why John and Jane felt the hurt was because the DJIA and the S&P 500 experienced losses that were on par with the drop in the Nasdaq.
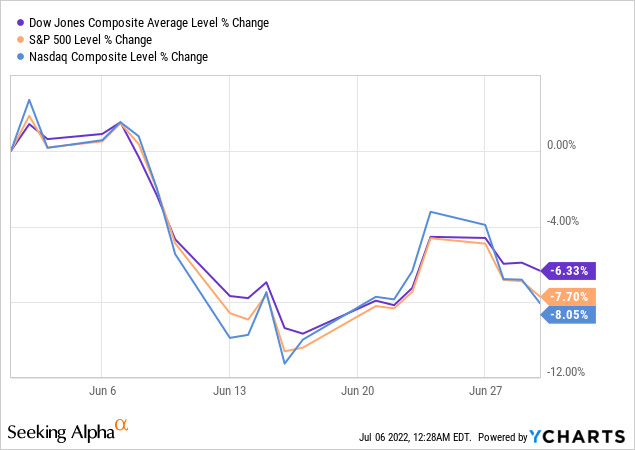
Previously the Nasdaq had dropped considerably more than the DJIA and the S&P 500 which is why the portfolio didn’t see a major loss in value during the months of April and May.
Even with all of the market volatility that didn’t stop several of the stocks in the Taxable account from providing hefty dividend increases. We even used the opportunity to execute some trades that included adding a starter position in Nordson (NDSN) while eliminating some high cost shares of strong performers like Exxon (XOM).
Background
For those who are interested in John and Jane’s full background, please click the following link here for the last time I published their full story. The details below are updated for 2022.
- This is a real portfolio with actual shares being traded.
- I am not a financial advisor and merely provide guidance based on a relationship that goes back several years.
- John retired in January 2018 and now only collects Social Security income as his regular source of income.
- Jane officially retired at the beginning of 2021, and she is collecting Social Security as her only regular source of income.
- John and Jane have decided to start taking draws from the Taxable Account and John’s Traditional IRA to the tune of $1,000/month each. These draws are currently covered in full by the dividends generated in each account.
- John and Jane have other investments outside of what I manage. These investments primarily consist of minimal risk bonds and low-yield certificates.
- John and Jane have no debt and no monthly payments other than basic recurring bills such as water, power, property taxes, etc.
The reason why I started helping John and Jane with their retirement accounts is that I was infuriated by the fees they were being charged by their previous financial advisor. I do not charge John and Jane for anything that I do, and all I have asked of them is that they allow me to write about their portfolio anonymously in order to help spread knowledge and to make me a better investor in the process.
Generating a stable and growing dividend income is the primary focus of this portfolio, and capital appreciation is the least important characteristic. My primary goal was to give John and Jane as much certainty in their retirement as I possibly can because this has been a constant point of stress over the last decade.
Dividend Increases
Five companies paid increased dividends/distributions or a special dividend during the month of June in the Taxable Account.
Otis Worldwide – OTIS continues to look more attractive after the most recent dividend increase with the price touching on 52-week-lows. I find it interesting that roughly 50% of elevators are currently serviced by independent operators which means that OTIS is in a great position to be able to acquire competitors over the next several years. Even with this is a positive, OTIS does have a fairly large amount of debt and with notes coming due and interest rates rising it will likely result in a higher cost of funds. Unless the company outperforms significantly in 2022, I would not expect to see such a hefty dividend increase in 2023. I would currently rank OTIS as a Strong Hold but investors focused on long-term results may want to add a few shares.
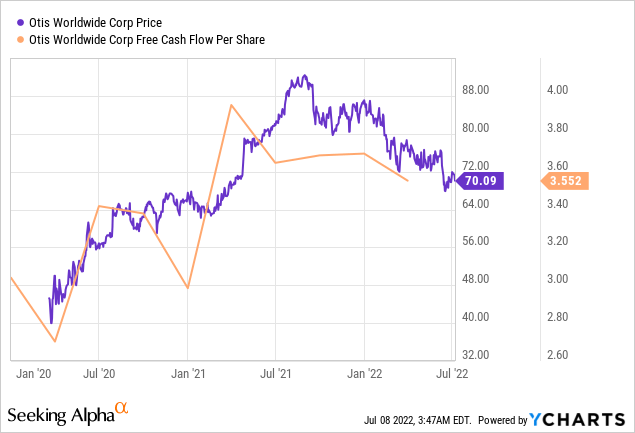
The dividend was increased from $.24/share per quarter to $.29/share per quarter. This represents an increase of 20.8% and a new full-year payout of $1.12/share compared with the previous $.92/share. This results in a current yield of 1.63% based on the current share price of $70.09.
Parker-Hannifin – PH’s dividend record is one of the most impressive on the market with 65 years of increases and a payout ratio so low that it allows for raises like this one. Even better, PH’s stock price has dropped to the point where purchasing shares is looking significantly more attractive. My favorite metric to track for PH is where the current dividend yield is relative to the historical yield over the last 10 years. To purchase PH, I am typically targeting a dividend yield of at least 2% because that’s traditionally been an excellent point to purchase shares (based on the new dividend yield this means purchasing shares under $266/share is where we want to be). PH is a solid choice for a long-term pick up at this price and I would rank the stock as a Buy. **The image below does not reflect the increased dividend yield which is 2.18% based on a closing price of $250.96.
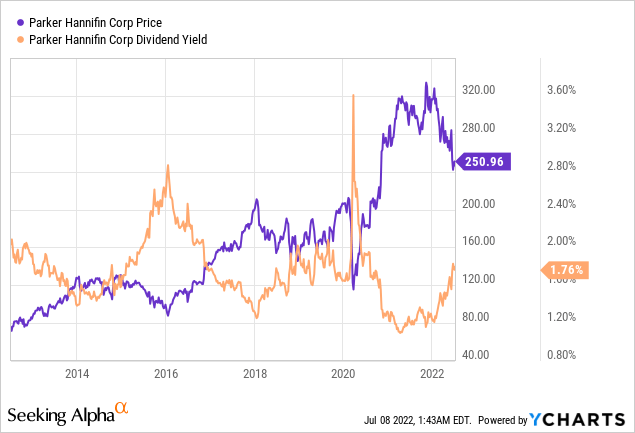
The dividend was increased from $1.03/share per quarter to $1.33/share per quarter. This represents an increase of 29.1% and a new full-year payout of $5.32/share compared with the previous $4.12/share. This results in a current yield of 2.12% based on the current share price of $250.96.
Raytheon – RTX is a good hold in the current market but after the most recent dividend increase the yield isn’t quite high enough to justify purchasing more shares. At the new annualized dividend rate of $2.20/year I would be looking for a share price to move above a 2.5% yield (share would need to drop below $88/share). Referencing PH’s chart above we can see similar activity from RTX’s activity below. RTX is still very relevant in the aerospace and defense sector so as soon as it moves into the right price range it would make sense to add to this position. **The current dividend yield in the chart below does not include the increase which would result in a yield of 2.34%.
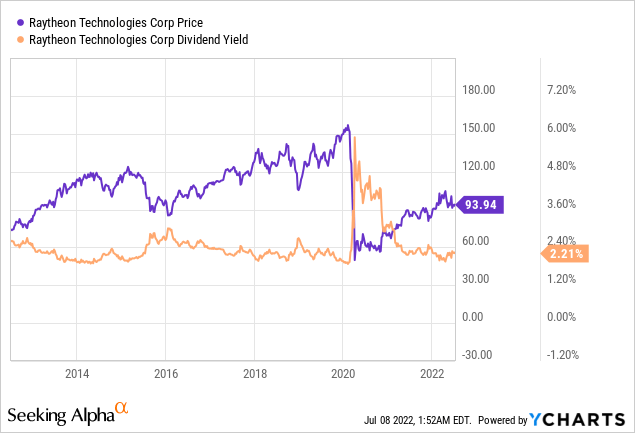
The dividend was increased from $.51/share per quarter to $.55/share per quarter. This represents an increase of 7.8% and a new full-year payout of $2.20/share compared with the previous $2.04/share. This results in a current yield of 2.34% based on the current share price of $93.94.
Simon Property Group – At the end of 2021 we sold a small chunk of high-cost shares at $160.22/share which was near the mark of SPG’s 52-week-high. We sold these shares because the cost basis has been in the $180/share range so we used the small loss to offset other gains from the sale of shares. John and Jane have a fairly large position in SPG and we are at the point where the risk/reward is beginning to look too attractive to pass up. Remember, SPG is an investment grade REIT that is well-positioned to not only weather economic downturns but also to thrive by picking up assets on the cheap and expand its portfolio.
Most recently, SPG has made a name for itself by purchasing distressed retailers in a joint venture with Authentic Brands Group that include names like Brooks Brothers, Lucky Brand, Aeropostale, and Forever 21 and Eddie Bauer. For those who are interested in learning more about how SPG is benefitting from its 2020 retailer purchases I would encourage you to read the article Simon Property’s 2020 retail acquisitions are already paying off by Danny Parisi that discusses just how these bets are truly paying off.
Simon Property Group (FastGraphs)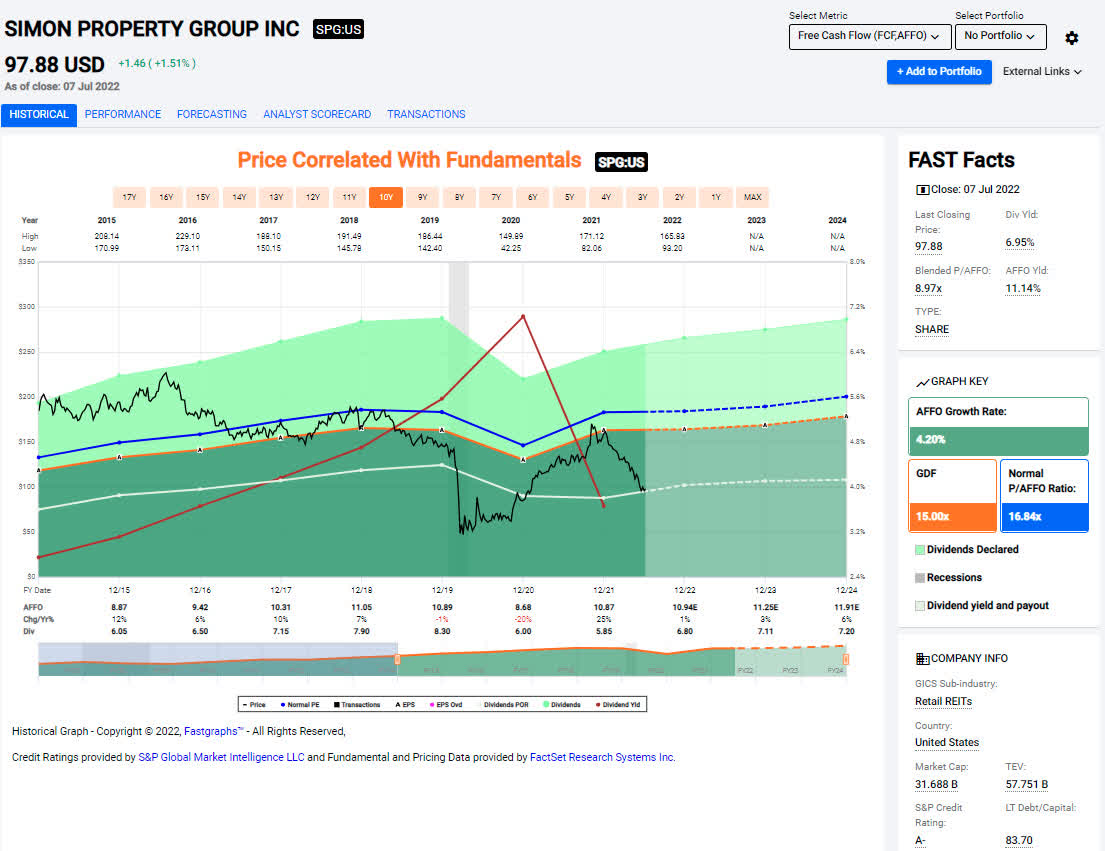
The dividend was increased from $1.65/share per quarter to $1.70/share per quarter. This represents an increase of 3% and a new full-year payout of $6.80/share compared with the previous $6.60/share. This results in a current yield of 7.05% based on the current share price of $97.88.
Southern Company – SO represents a solid dividend-paying utility that offers stability at the expense of lower dividend growth due to a higher payout ratio. Projections show that earnings growth might be returning which would improve the margin of safety for the dividend payout (currently the payout is at 78%). SO’s current 10-year dividend growth rate comes in at an underwhelming 3.38%. The current position held by John and Jane has a rather low-cost basis at around $46.44/share. At this point I believe that there are better investment opportunities but there is the possibility that future EPS growth could make SO more attractive with stock price appreciation and a dividend growth rate that exceeds its previous averages. The FastGraphs image below shows that it is currently trading above historical P/E ratios so that number will need to come down or see a turnaround in earnings per share in the middle to upper single digit range.
Southern Company (FastGraphs)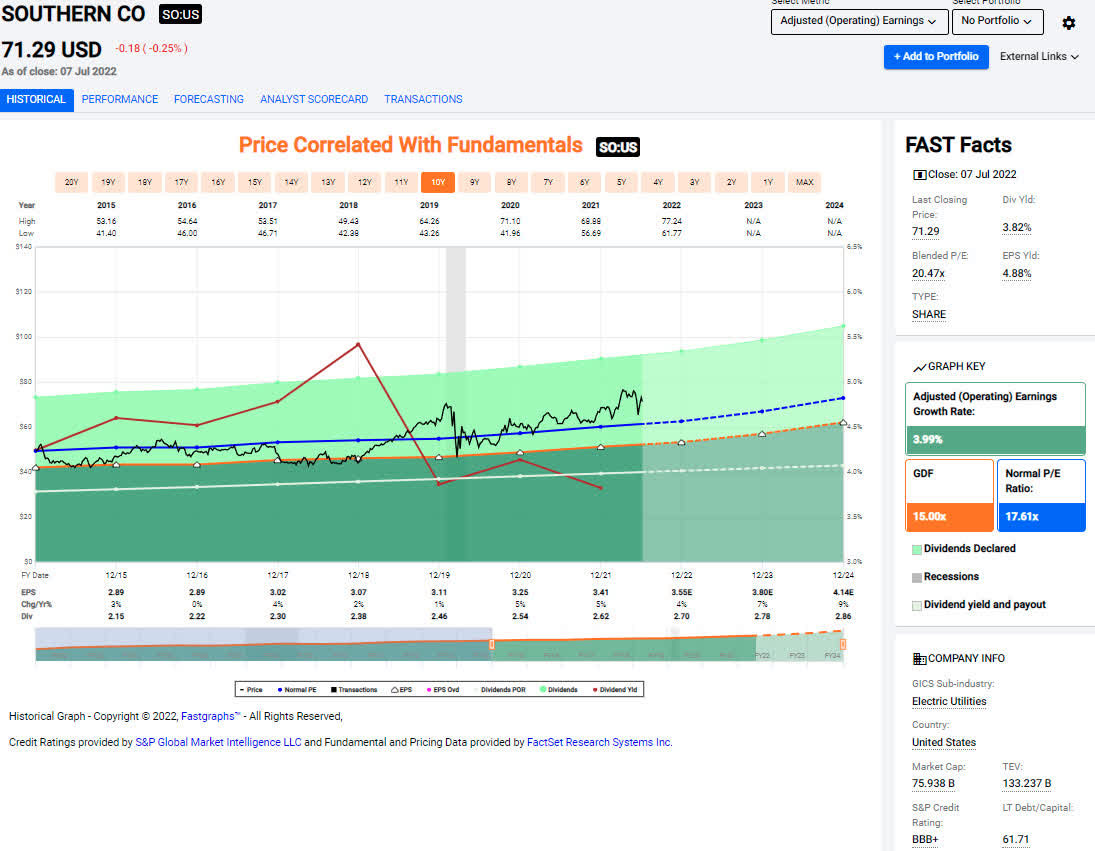
The dividend was increased from $.66/share per quarter to $.68/share per quarter. This represents an increase of 3% and a new full-year payout of $2.72/share compared with the previous $2.64/share. This results in a current yield of 3.81% based on the current share price of $71.29.
Positions
The Taxable Account currently consists of 44 unique positions at market close on July 7th, 2022. There were several purchases/sales that took place during the month of June.
2022 – June Taxable Transaction History (Charles Schwab)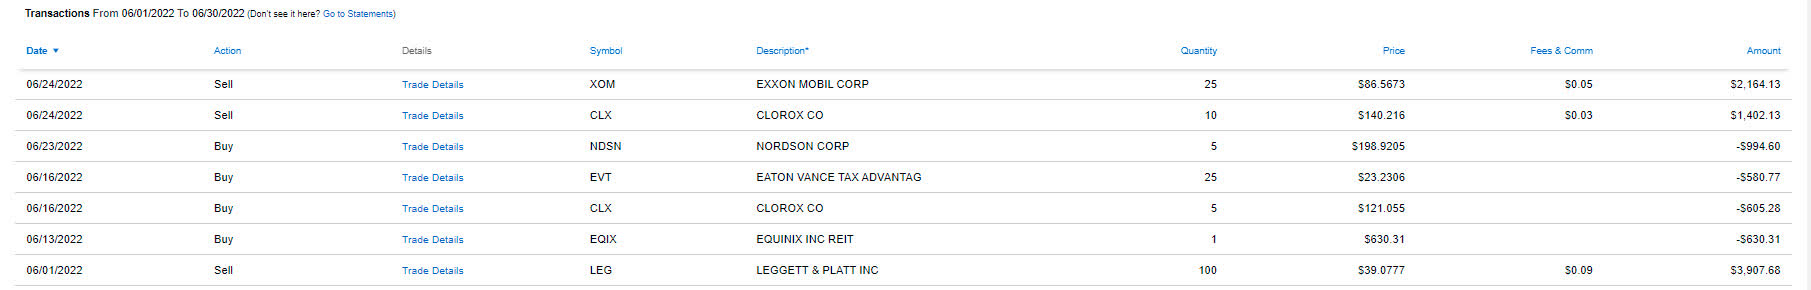
I will be writing a separate article in the future about some of the trades I have made and the logic behind them. For these update articles I will keep them focused on exact numbers but focus less on the reasons behind the trades.
For the trades above, the primary focus has always been to reduce exposure to high-cost positions (XOM is a great example of this). The same can be said with Clorox (CLX) where we were able to buy shares at a near 52-week-low and then subsequently sell shares almost a week later had a share price that indicates the stock is overvalued.
June Income Tracker – 2021 Vs. 2022
The Taxable Account is still running in the red for the year and this is the direct result of some massive special dividends paid by Old Republic International (ORI) in 2021. The Taxable Account is currently estimated to generate an average of $1,604.67/month of dividend income in 2022. This is slightly lower than the average monthly income of $1,704.23 generated in 2021 (running at about -5.8% behind 2021 performance).
A new item for readers to consider is the impact of draws on the Taxable Account which started in January in the amount of $1,000/month. The good news is that the portfolio generates more monthly income from dividends and distributions than John and Jane are looking to withdraw. The challenge for me is that I am used to running an account that is typically flush with excess cash that would allow greater ability to reinvest funds. Therefore, I will need to be more considerate of cash balances available at a given time. This also underscores the importance of the Cash Balance table in the images below that tracks the amount of cash on hand.
SNLH = Stocks No Longer Held – Dividends in this row represent the dividends collected on stocks that are no longer held in that portfolio. We still count the dividend income that comes from stocks no longer held in the portfolio, even though it is non-recurring. All images below come from Consistent Dividend Investor, LLC. (also referred to as CDI as the source below).
2022 – June – Taxable Dividend Breakdown (CDI)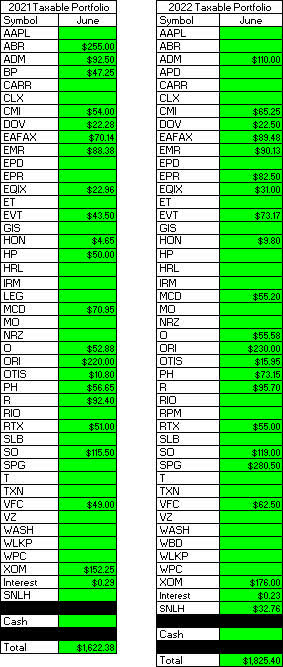
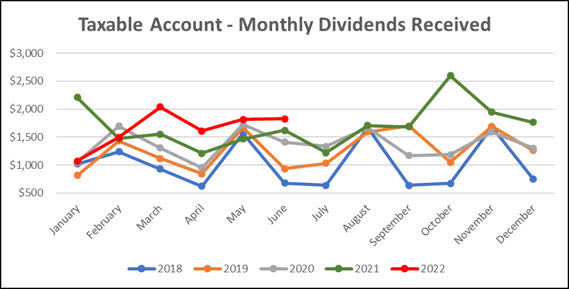
Here is a graphical illustration of the dividends received on a monthly basis. I have begun updating the chart to also reflect the dividends earned going back to January of 2018.
2022 – June – Taxable Monthly Dividend Graph (CDI) 2022 – June – Taxable Monthly Dividend Line Graph (CDI)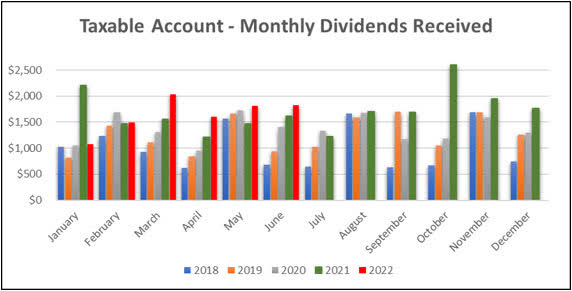
The table below represents all income generated in 2021 and collected/expected dividends in 2022.
2022 – June – Taxable Annual Estimate (CDI)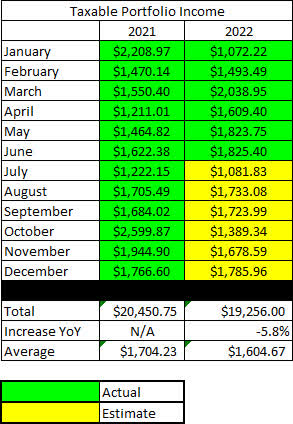
Below gives an extended look back at the dividend income generated when I first began writing these articles.
2022 – June – Taxable Dividend History (CDI)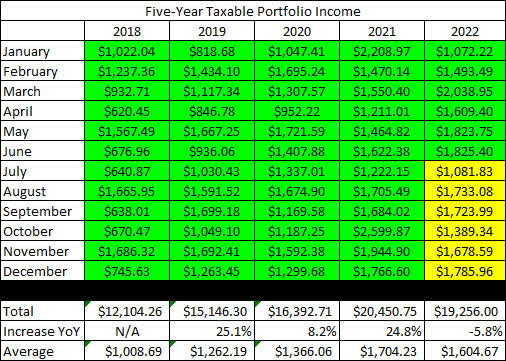
The Taxable Account balances below are from June 30, 2022, and all previous months are taken from the end-of-month statement provided by Charles Schwab.
2022 – June – Taxable Month End Balance (CDI)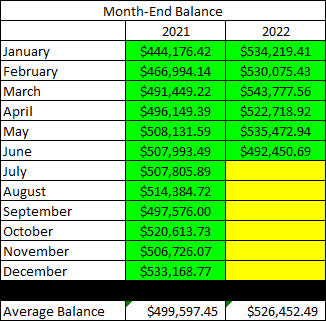
The next image is the only new table being added to the report for 2022. As mentioned previously, this is the first year that John and Jane will begin taking withdrawals from their Taxable Account (and also from John’s Traditional IRA). For this reason, I want to keep a record of these withdrawals because they will also have an impact on the account balance in the cash balance table (after this image).
2022 – June – Taxable Withdrawals (CDI)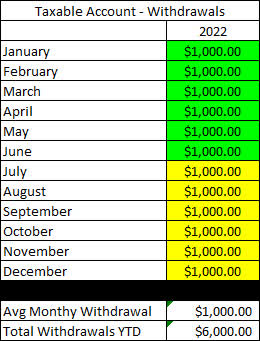
The next image indicates how much cash John and Jane had in their Taxable Account at the end of the month as indicated on their Charles Schwab statements.
2022 – June – Taxable Cash Balance (CDI)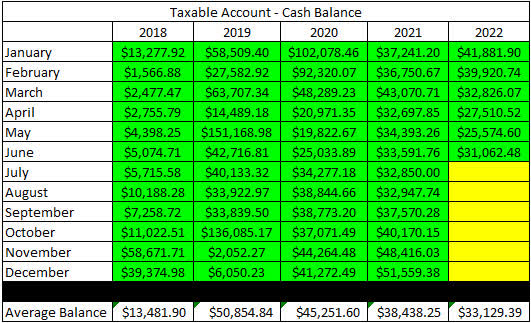
There were large changes in cash at the end of 2019 and then again in 2020 (this was from the purchase of a physical asset and the sale of another) which explains why the balance fluctuated so much during this time. A lot of cash was deployed in March and April of 2020 as the pandemic caused share prices to plummet. John and Jane no longer qualify to make contributions to their Traditional or Roth IRAs, so there will also not be any funds taken from the Taxable Account to cover these contributions (which is what they typically did in the past).
The next image provides a history of the unrealized gain/loss at the end of each month going back to the beginning in January of 2018.
2022 – June – Taxable Unrealized Gain-Loss (CDI)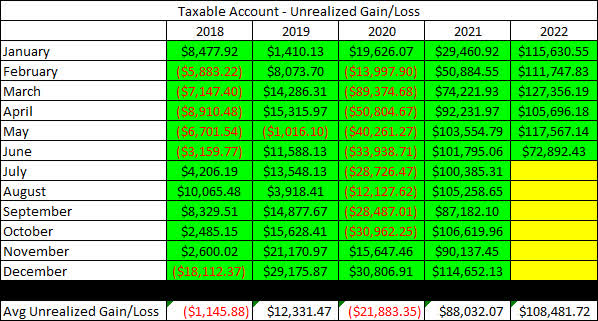
The main reason for including this is to help readers understand that the key to this strategy is to accept the risk, and I personally find that this table is an excellent representation of the volatility in the account. It is important to remember that tolerance for risk can vary significantly, but John and Jane are okay with additional risk because they are focused on generating income from these stocks.
In an effort to be transparent about John and Jane’s Taxable Account, I like to include an unrealized Gain/Loss summary. The numbers used are based on the closing prices from July 7th, 2022.
2022 – June – Taxable Gain-Loss Update (CDI)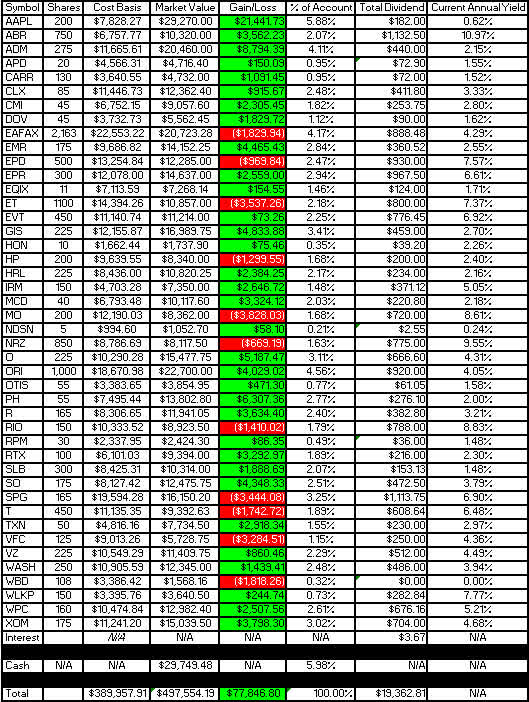
When reading the yield column, it is important to understand that the dividend yield is dependent on whether or not we have received a full year of income (this is the only way to keep it mostly accurate without requiring a lot of manual input or calculation on my part). I have updated these for the start of the year, so all yields reflected in the last column are accurate. I actually prefer this method because it will show the reduced yield of a position added partway through the year (thus reflecting an accurate benefit vs. inflated benefit).
Lastly, I wanted to include the Monthly Year-Over-Year Income Comparison to show how the Taxable Account is trending.
2022 – June – Taxable Monthly Year-Over-Year Comparison (CDI)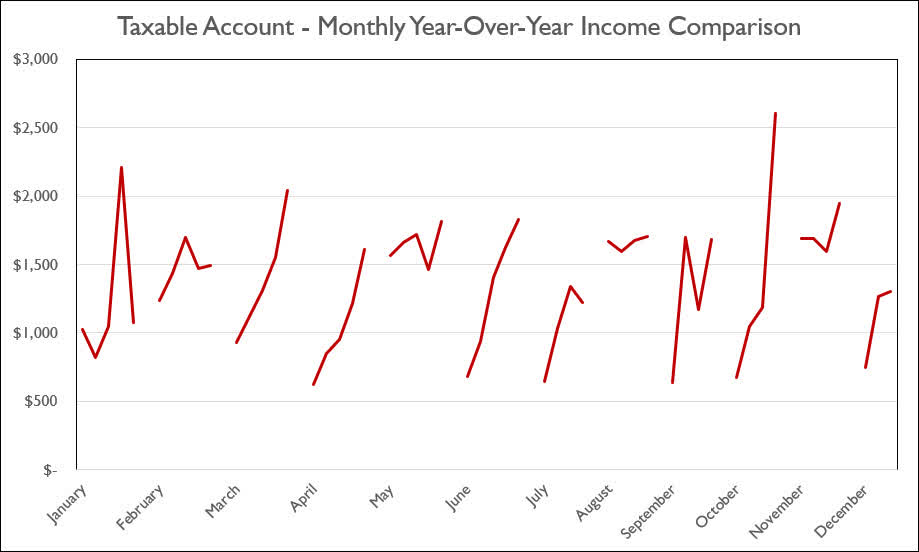
Conclusion
I cannot emphasize enough how important it is that investors remind themselves why they are choosing to focus on a dividend-growth model versus a price appreciation model. During the month of June, we saw more than $40,000 of value erased from the Taxable Account but we also saw several dividend increases (including two that paid increases of 20% or more). As I write this article the Taxable Account total balance $497.5K what really matters to me is that the dividend increases are sustainable because this is how we achieve a higher level of certainty when it comes to generating income (or retirement income in John and Jane’s situation).
Although we make more trades in John and Jane’s Retirement Accounts (the motivation for this is to avoid taxable events) we still use cash reserves to buy undervalued shares while also utilizing limit trades to sell overvalued shares and rotate capital into sectors and companies that are undervalued. The results of these trades are that we reduce the overall risk by eliminating shares that would be the most upside-down during market correction.
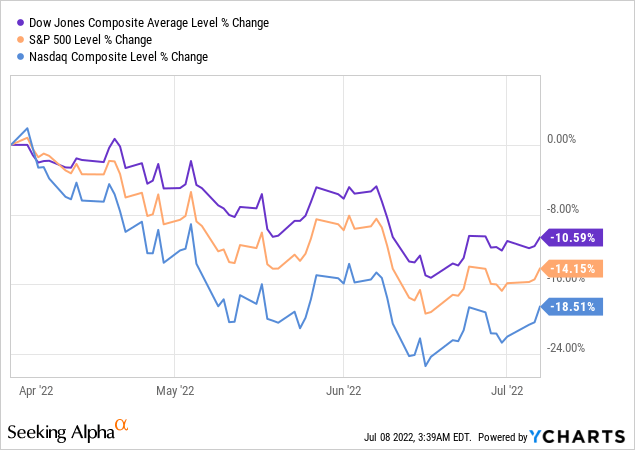
Even with the acceleration of losses for the DJIA and S&P 500 the Nasdaq is still the worst performer since the beginning of April.
In John and Jane’s Taxable Account, they are currently long the following mentioned in this article: Apple (NASDAQ:AAPL), Arbor Realty (NYSE:ABR), Archer-Daniels-Midland (NYSE:ADM), Air Products and Chemicals (APD), Carrier Global Corporation (NYSE:CARR), Clorox (NYSE:CLX), Cummins (NYSE:CMI), Dover Corporation (NYSE:DOV), Eaton Vance Floating-Rate Advantage Fund A (MUTF:EAFAX), Emerson Electric (EMR), Enterprise Products Partners (NYSE:EPD), EPR Properties (NYSE:EPR), Equinix (NASDAQ:EQIX), Energy Transfer (NYSE:ET), Eaton Vance Tax-Advantaged Dividend Income Fund (NYSE:EVT), General Mills (NYSE:GIS), Honeywell (NASDAQ:HON), Helmerich & Payne (NYSE:HP), Hormel (NYSE:HRL), Iron Mountain (NYSE:IRM), McDonald’s (MCD), Altria (NYSE:MO), Nordson (NDSN), New Residential (NYSE:NRZ), Realty Income (O), Old Republic International (ORI), Otis Worldwide Corporation (NYSE:OTIS), Parker-Hannifin (NYSE:PH), Ryder System (NYSE:R), Rio Tinto (RIO), RPM International (RPM), Raytheon Technologies (NYSE:RTX), Schlumberger (NYSE:SLB), Southern Company (NYSE:SO), Simon Property Group (SPG), AT&T (NYSE:T), Texas Instruments (NASDAQ:TXN), V.F. Corporation (VFC), Verizon (NYSE:VZ), Washington Trust (NASDAQ:WASH), Warner Bros. Discovery (WBD), Westlake Chemical (NYSE:WLKP), W. P. Carey (NYSE:WPC), and Exxon Mobil (XOM).
Be the first to comment