

imaginima
Background
For those who are interested in John and Jane’s full background, please click the following link here for the last time I published their full story. The details below are updated for 2022.
- This is a real portfolio with actual shares being traded.
- I am not a financial advisor and merely provide guidance based on a relationship that goes back several years.
- John retired in January 2018 and now only collects Social Security income as his regular source of income.
- Jane officially retired at the beginning of 2021, and she is collecting Social Security as her only regular source of income.
- John and Jane have decided to start taking draws from the Taxable Account and John’s Traditional IRA to the tune of $1,000/month each. These draws are currently covered in full by the dividends generated in each account.
- John and Jane have other investments outside of what I manage. These investments primarily consist of minimal-risk bonds and low-yield certificates.
- John and Jane have no debt and no monthly payments other than basic recurring bills such as water, power, property taxes, etc.
The reason why I started helping John and Jane with their retirement accounts is that I was infuriated by the fees they were being charged by their previous financial advisor. I do not charge John and Jane for anything that I do, and all I have asked of them is that they allow me to write about their portfolio anonymously in order to help spread knowledge and to make me a better investor in the process.
Generating a stable and growing dividend income is the primary focus of this portfolio, and capital appreciation is the least important characteristic. My primary goal was to give John and Jane as much certainty in their retirement as I possibly can because this has been a constant point of stress over the last decade.
Dividend Increases
Five companies paid increased dividends/distributions or a special dividend during the month of August in the Taxable Account.
- Arbor Realty (ABR)
- Clorox (CLX)
- Enterprise Products Partners (EPD)
- Energy Transfer (ET)
- General Mills (GIS)
Arbor Realty
This stock flew under the radar for years after it was decimated during the financial crisis where the sky-high stock price of over $30/share dropped below $1.00/share. It is worth pointing out that ABR is a much more well-rounded company than it was in 2008 even though it is still heavily involved in riskier types of finance that include mezzanine and bridge loans. For this reason, investors should be careful to pay attention to the risk(s) associated with this company (especially if credit markets see reduced liquidity).
Outside of these risks, John and Jane’s ABR position has a very low-cost basis which gives us quite a bit of downside protection. The risk of adding to shares at the current price really depends on how much the need for specialty financing diminishes as a result of higher interest rates.
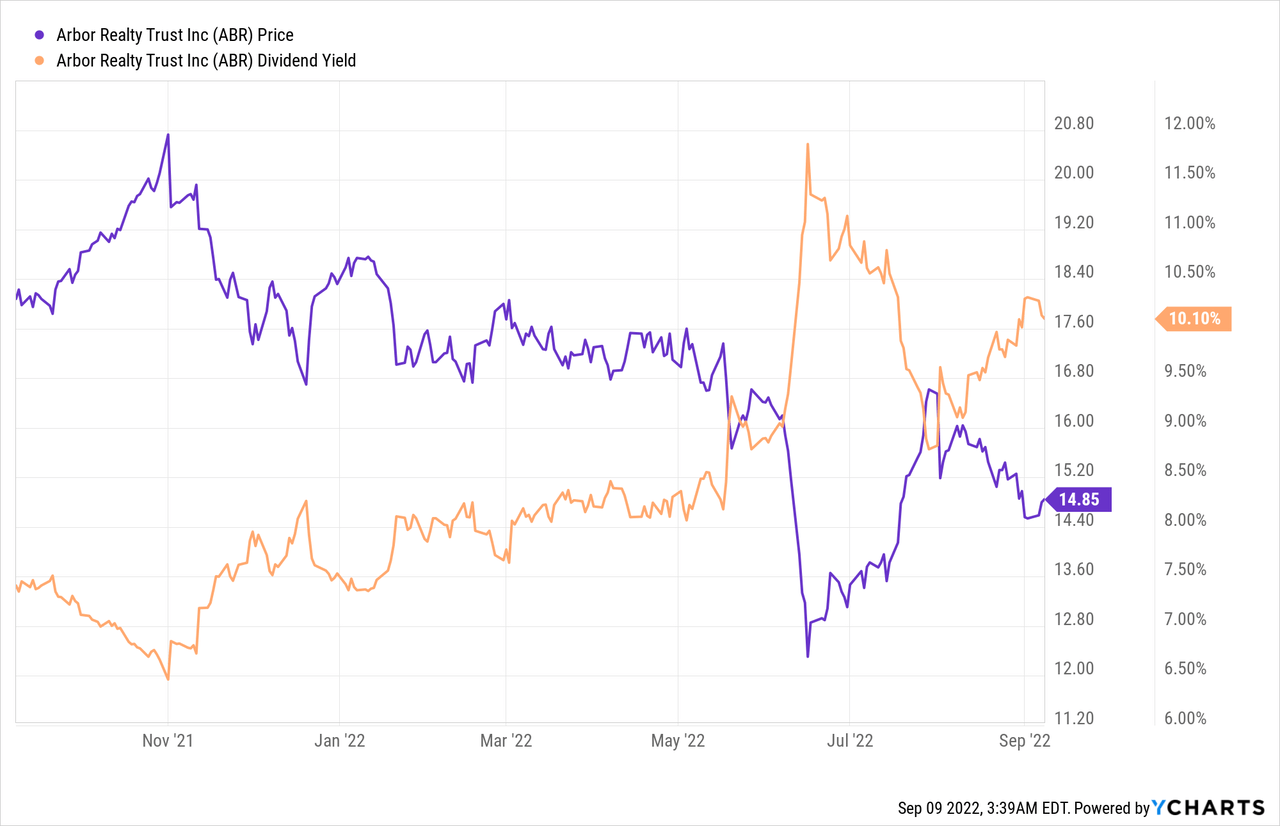
The dividend was increased from $.38/share per quarter to $.39/share per quarter. This represents an increase of 2.6% and a new full-year payout of $1.56/share compared with the previous $1.52/share. This results in a current yield of 10.54% based on the current share price of $14.85.
Clorox
Clorox stock price saw record highs during COVID and the valuation became stretched (especially when we consider this was a temporary increase in sales of cleaning products) and is probably one of the most overvalued consumer staple companies. We recently added shares at $120 and wouldn’t consider anything over that due to slowing sales and the problem is compounded by rising materials/input costs. CLX has struggled to grow its dividend in recent years as the payout ratio gets less safe.
The lackluster increases over the last three years have put this stock on the shortlist to have the size of the position reduced. The image below paints a bleak picture of earnings in 2023 with a recovery expected to take place in 2024.
CLX – FastGraphs (FastGraphs)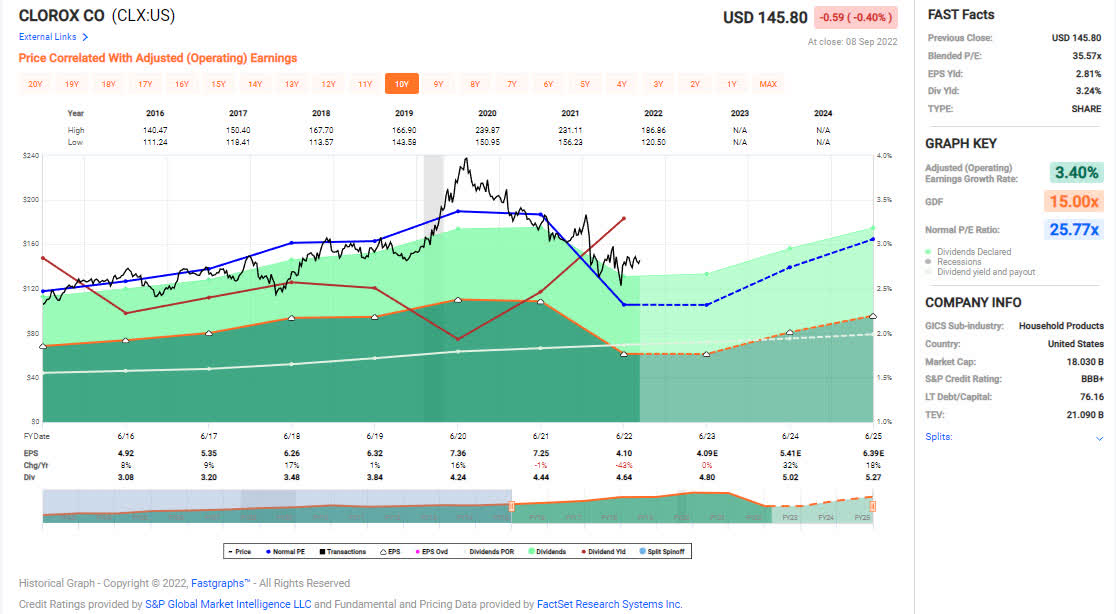
The dividend was increased from $1.16/share per quarter to $1.18/share per quarter. This represents an increase of 1.7% and a new full-year payout of $4.72/share compared with the previous $4.64/share. This results in a current yield of 3.22% based on the current share price of $145.80.
Enterprise Products Partners
Prior to COVID, this MLP (issues a K1 at tax time) was raising its distribution quarterly and had managed to do over the span of 15 years (that’s roughly 60 consecutive quarterly distribution increases). Although their increases haven’t been quarterly they have been slightly bigger than before which means they are back to the same level of increases that are made every six months. Either way, we are happy to see distribution growth resume, especially when demand for its products is so strong. Revenues for Q2-2022 are up 70% year-over-year and distributable cash flow increased 30% during the same time. EPD announced that it has three organic growth projects that are in process which will bolster the numbers even further.
The distribution yield definitely looks low relative to the last two years but it is important to consider that EPD’s entire way of business was under attack throughout COVID and brought into question whether or not operations were sustainable with demand being incredibly low. EPD will benefit from energy prices looking like they will remain high and the demand outstripping the supply for at least the next year or two.
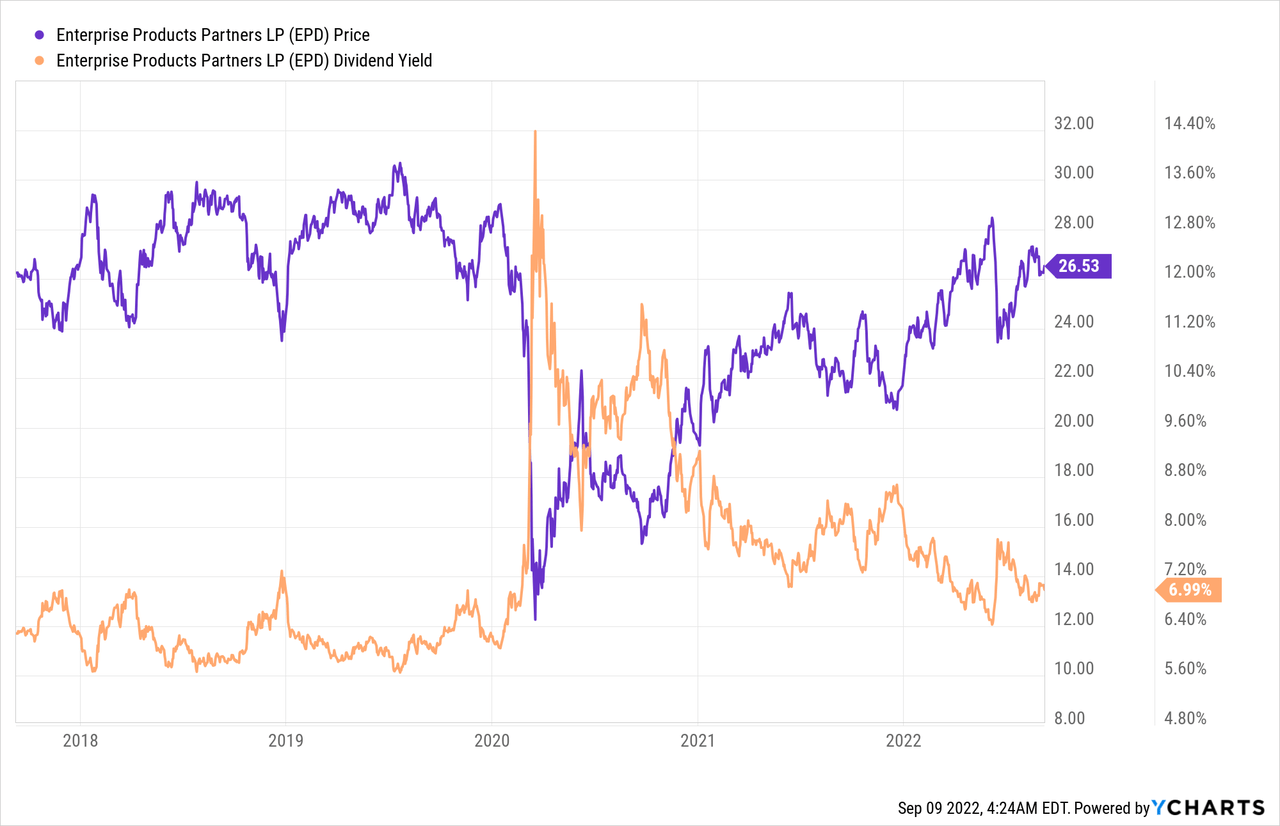
The dividend was increased from $.465/share per quarter to $.475/share per quarter. This represents an increase of 2.2% and a new full-year payout of $1.90/share compared with the previous $1.86/share. This results in a current yield of 7.21% based on the current share price of $26.53.
Energy Transfer
There are similarities between ET and EPD in the sense that revenue and distributable cash flow were up considerably. Revenue posted a year-over-your increase of 71.5% (compared to Q2-2021) with distributable cash flow seeing an increase of 35% over the same timeframe.
We recently increased the size of John and Jane’s ET position (during the months of April/May) so that the taxable account holds 1100 shares. Distribution increases over the last three quarters have been 14.8%, 14.3%, and the most recent increase coming in at 15%. As a result of the increase in the size of this position and the distribution increases ET now generates more than double the quarterly income it did only 12 months ago.
Is worth pointing out that the distribution was cut in half in Q3-2020 and the company has publicly announced that they plan to return to the previous distribution of $.305/share per quarter which means that investors should see strong increases over the next few quarters as well.
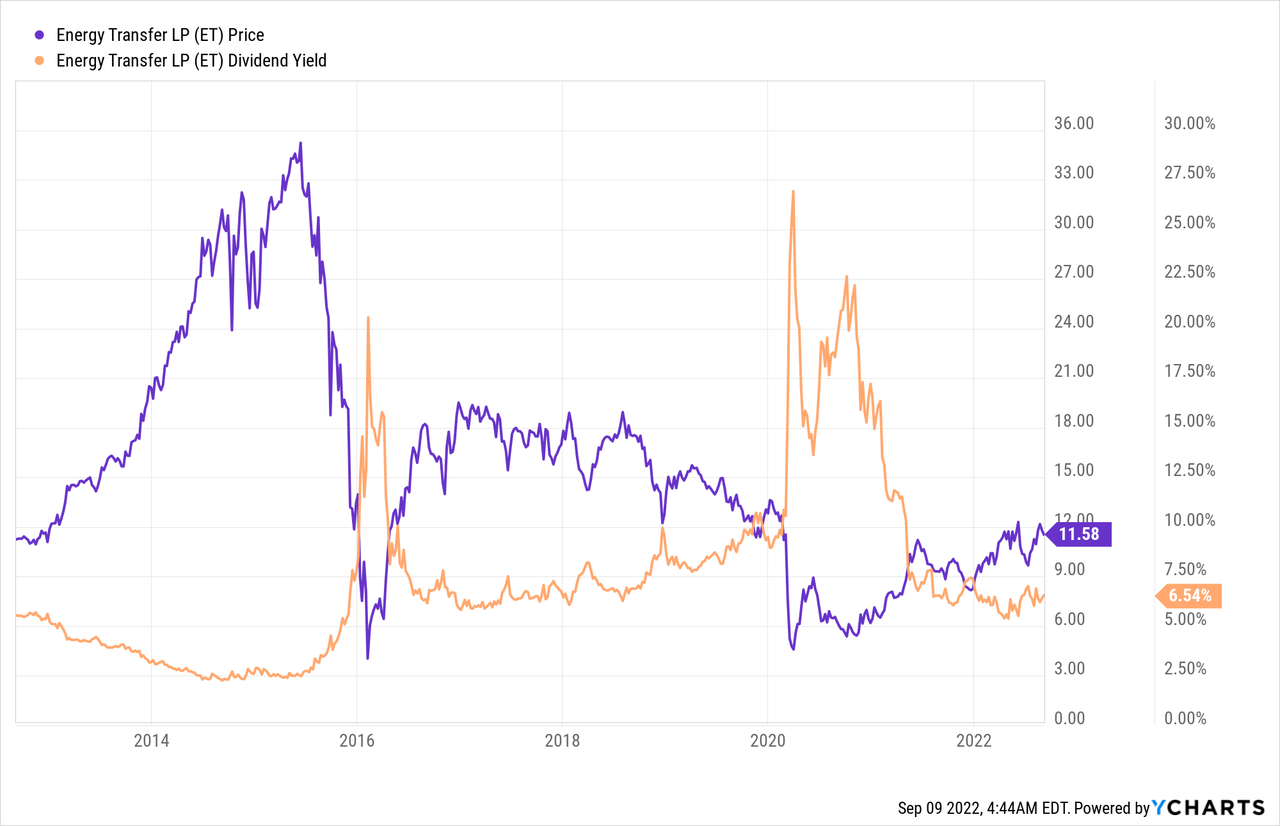
The dividend was increased from $.20/share per quarter to $.23/share per quarter. This represents an increase of 15% and a new full-year payout of $.92/share compared with the previous $.80/share. This results in a current yield of 8.02% based on the current share price of $11.58.
General Mills
When GIS was originally added to the portfolio there wasn’t much room for upside after the company purchased Blue Buffalo Pet Products for $8 billion in cash. This purchase resulted in a massive increase in long-term debt that weighed heavily on the earnings. Fortunately, GIS management did the right thing by biting the bullet and difficult short-term decisions that resulted in long-term benefits.
The chart below shows the major decline GIS shares experienced between 2017 and 2019 (share value was nearly cut by half). Normally when a company completes a large purchase like Blue Buffalo Pet Products it should result in a positive outlook but this was not a transaction among investors. COVID actually benefitted GIS tremendously and pushed sales that allowed the company to deleverage faster than they originally projected.
We will be waiting on a pullback before adding shares. We really couldn’t justify increasing the size of the position when there are investments with more upside potential that have a dividend yield greater than 3%.
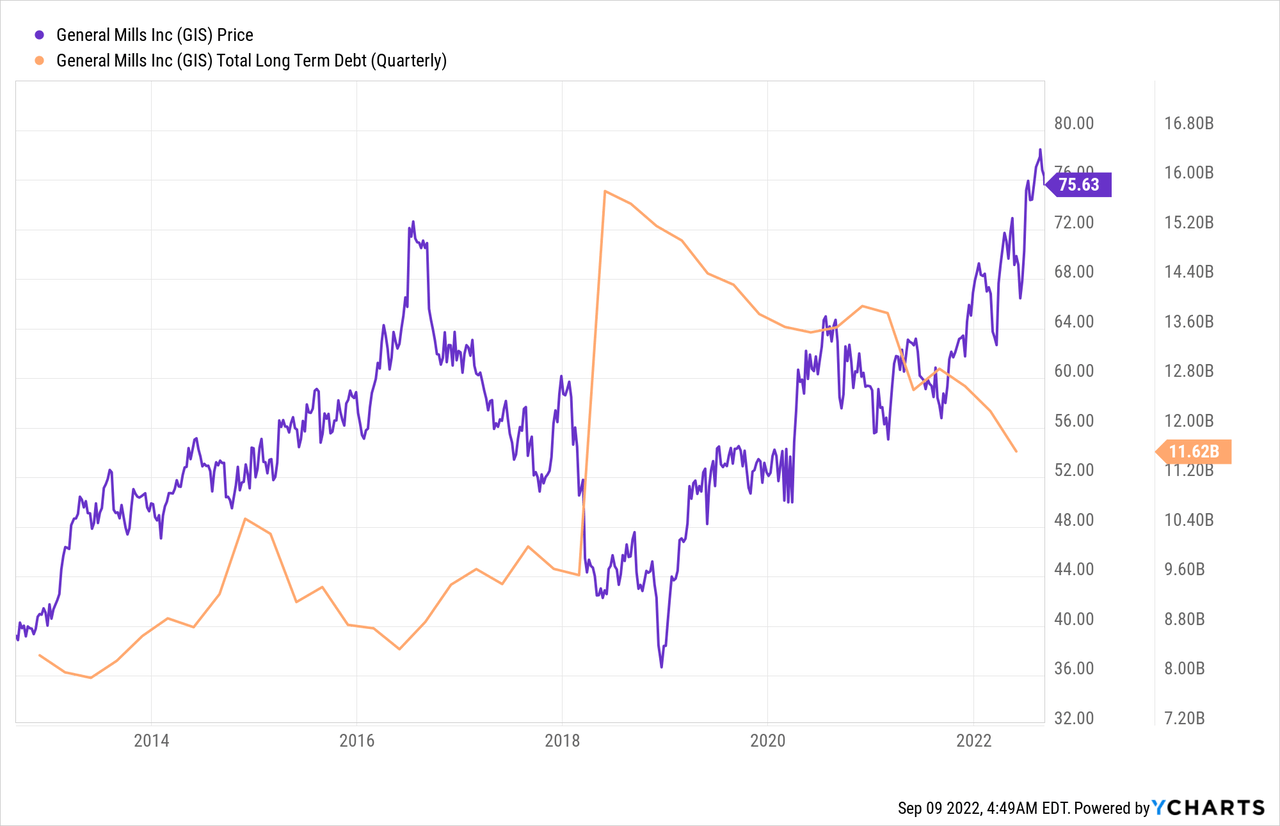
The dividend was increased from $.51/share per quarter to $.54/share per quarter. This represents an increase of 5.9% and a new full-year payout of $2.16/share compared with the previous $2.04/share. This results in a current yield of 2.83% based on the current share price of $75.63.
Positions
The Taxable Account currently consists of 44 unique positions at market close on September 9th, 2022. There was only one purchase that took place during the month of August.
2022 -August Taxable Transaction History (Charles Schwab)
I will discuss these trades more in-depth in my article that discusses these trades. The link below is my purchases/trades article from August 23, 2022.
The Retirees Dividend Portfolio: Recent Purchases And Limit Trades Through August 19th
August Income Tracker – 2021 Vs. 2022
The Taxable Account is still running in the red for the year, and this is the direct result of some massive special dividends paid by Old Republic International (ORI) in 2021. The Taxable Account is currently estimated to generate an average of $1,626.12/month of dividend income in 2022. This is slightly lower than the average monthly income of $1,704.23 generated in 2021 (running at about -4.6% behind 2021 performance).
A new item for readers to consider is the impact of draws on the Taxable Account which started in January in the amount of $1,000/month. The good news is that the portfolio generates more monthly income from dividends and distributions than John and Jane are looking to withdraw. The challenge for me is that I am used to running an account that is typically flush with excess cash that would allow greater ability to reinvest funds. Therefore, I will need to be more considerate of cash balances available at a given time. This also underscores the importance of the Cash Balance table in the images below that tracks the amount of cash on hand.
SNLH = Stocks No Longer Held – Dividends in this row represent the dividends collected on stocks that are no longer held in that portfolio. We still count the dividend income that comes from stocks no longer held in the portfolio, even though it is non-recurring. All images below come from Consistent Dividend Investor, LLC. (also referred to as CDI as the source below).
2022 – August – Taxable Dividend Breakdown (CDI)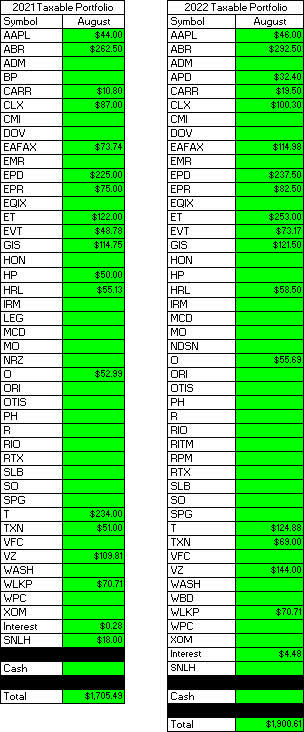
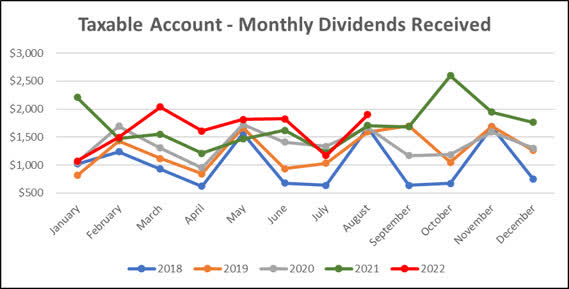
Here is a graphical illustration of the dividends received on a monthly basis. I have begun updating the chart to also reflect the dividends earned going back to January of 2018.
2022 – August – Taxable Monthly Dividend Graph (CDI) 2022 – August – Taxable Monthly Dividend Line Graph (CDI)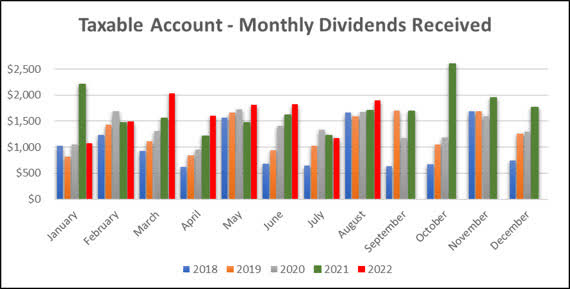
The table below represents all income generated in 2021 and collected/expected dividends in 2022.
2022 – August – Taxable Annual Estimate (CDI)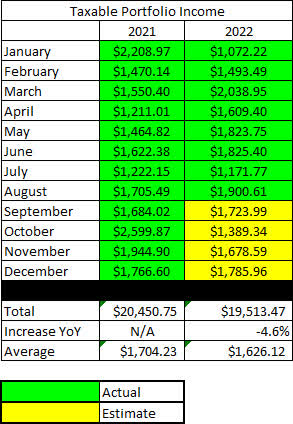
Below gives an extended look back at the dividend income generated when I first began writing these articles.
2022 – August – Taxable Dividend History (CDI)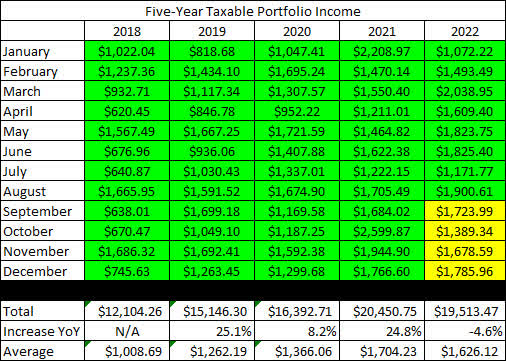
The Taxable Account balances below are from August 31, 2022, and all previous months are taken from the end-of-month statement provided by Charles Schwab.
2022 – August – Taxable Month End Balance (CDI)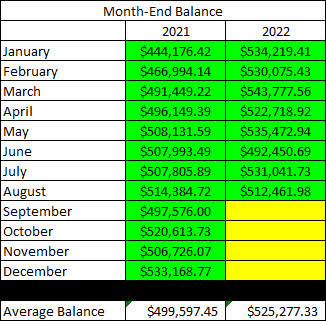
The next image is the only new table being added to the report for 2022. As mentioned previously, this is the first year that John and Jane will begin taking withdrawals from their Taxable Account (and also from John’s Traditional IRA). For this reason, I want to keep a record of these withdrawals because they will also have an impact on the account balance in the cash balance table (after this image).
2022 – August – Taxable Withdrawals (CDI)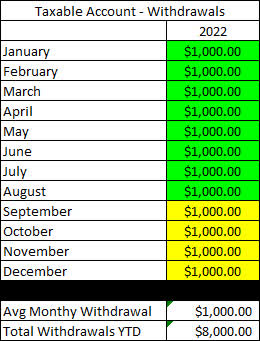
The next image indicates how much cash John and Jane had in their Taxable Account at the end of the month as indicated on their Charles Schwab statements.
2022 – August – Taxable Cash Balance (CDI)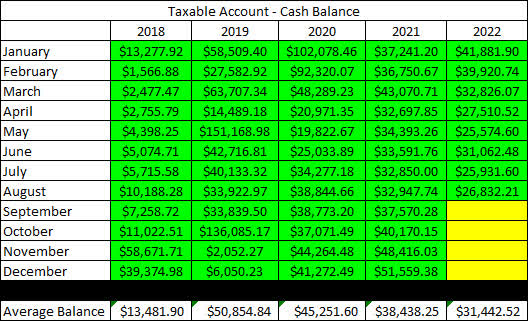
There were large changes in cash at the end of 2019 and then again in 2020 (this was from the purchase of a physical asset and the sale of another) which explains why the balance fluctuated so much during this time. A lot of cash was deployed in March and April of 2020 as the pandemic caused share prices to plummet. John and Jane no longer qualify to make contributions to their Traditional or Roth IRAs, so there will also not be any funds taken from the Taxable Account to cover these contributions (which is what they typically did in the past).
The next image provides a history of the unrealized gain/loss at the end of each month going back to the beginning in January of 2018.
2022 – August – Taxable Unrealized Gain-Loss (CDI)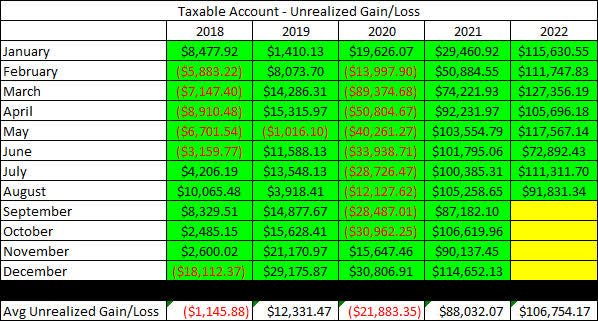
The main reason for including this is to help readers understand that the key to this strategy is to accept the risk, and I personally find that this table is an excellent representation of the volatility in the account. It is important to remember that tolerance for risk can vary significantly, but John and Jane are okay with additional risk because they are focused on generating income from these stocks.
In an effort to be transparent about John and Jane’s Taxable Account, I like to include an unrealized Gain/Loss summary. The numbers used are based on the closing prices from September 9th, 2022.
2022 – August – Taxable Gain-Loss Update (CDI)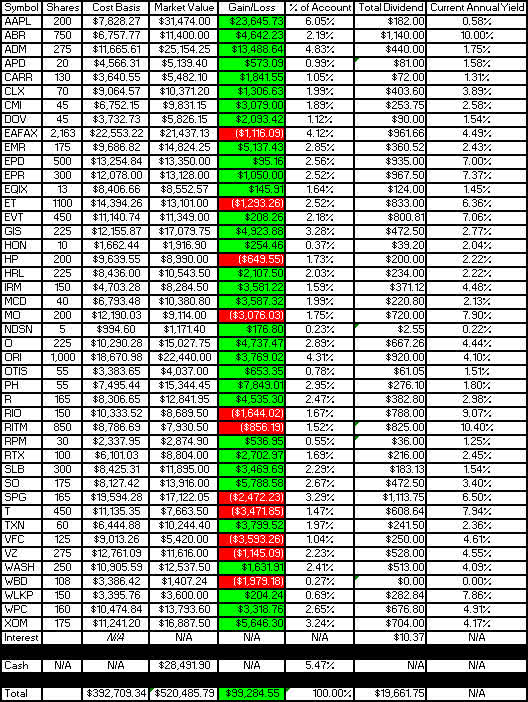
When reading the yield column, it is important to understand that the dividend yield is dependent on whether or not we have received a full year of income (this is the only way to keep it mostly accurate without requiring a lot of manual input or calculation on my part). I have updated these for the start of the year, so all yields reflected in the last column are accurate. I actually prefer this method because it will show the reduced yield of a position added partway through the year (thus reflecting an accurate benefit vs. inflated benefit).
Lastly, I wanted to include the Monthly Year-Over-Year Income Comparison to show how the Taxable Account is trending.
2022 – August – Taxable Monthly Year-Over-Year Comparison (CDI)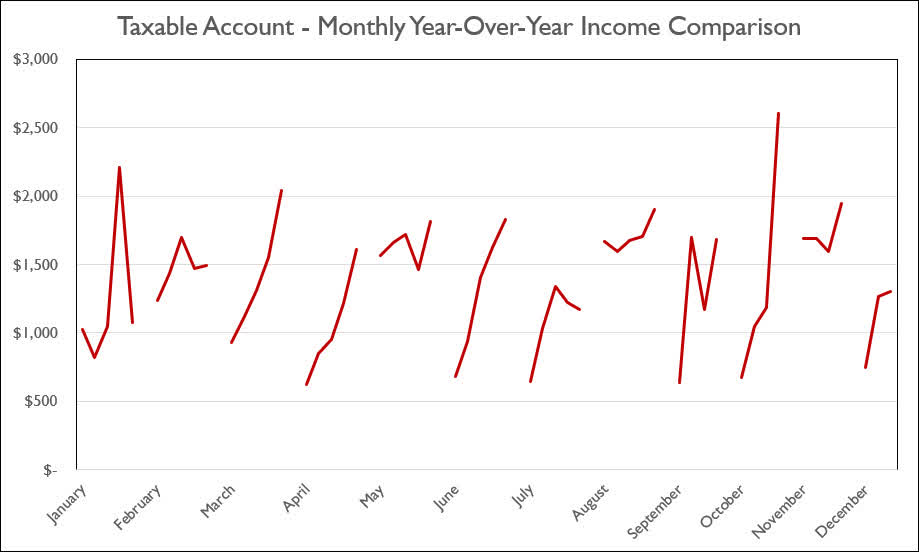
Conclusion
The VIX index is something I haven’t reviewed in a while, and the good news is that its remains at relatively reasonable levels.
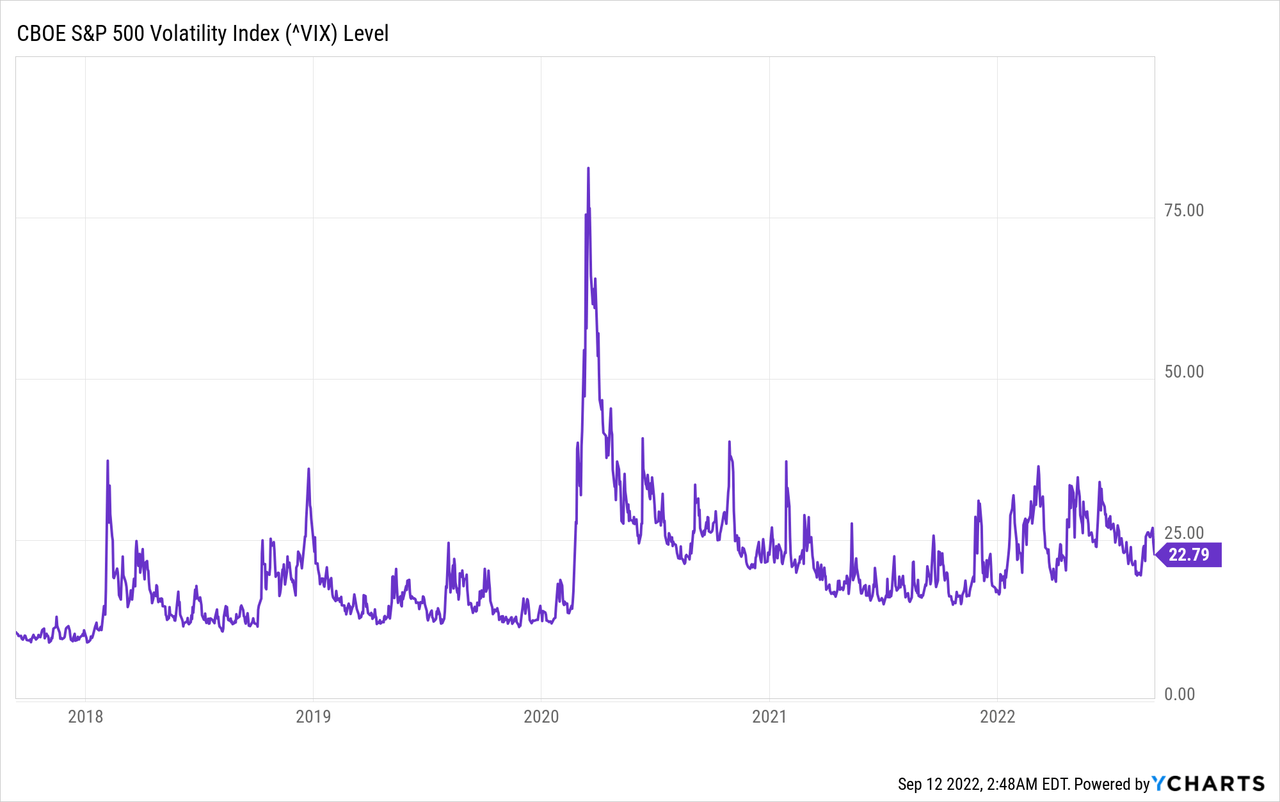
Even with the VIX looking stable, I have major reservations about the state of the U.S. economy, especially when it comes to the absurd state of housing prices and rising interest rates. The market that I live in is estimated to see a 10-20% decline and we are already seeing an unprecedented increase in the available amount of inventory that is available.
I did the math after looking at my own housing situation. My wife and I ended up financing our house in March 2022 with a $325k mortgage at 3.875%. This gives us a monthly payment of $2,050/month with property taxes and insurance. Had we waited until today and purchased the same house at the same price, we would have seen our rate move up to 6.10% (national average) and the payment would have been $2,650/month.
In order for our payment to be the same, we would have needed to see a mortgage amount closer to $250k in order to maintain the same payment with taxes and insurance.
For these reasons, I am very skeptical about the ability of borrowers to be able to sell their homes for what they want and for buyers to be able to afford what a seller wants. These two problems can cause the housing market to crash even more quickly than it rose. This is especially concerning when I read articles like The housing correction intensifies-Blackstone to stop buying homes in these 38 regional housing markets where a private equity firm like Blackstone (BX) announces they will no longer purchase homes in certain markets that have been extremely hot (I live in one of these markets).
I want to emphasize that my concern has a lot more to do with residential real estate, which is why John and Jane’s exposure remains low, with Rithm Capital (RITM) being the main stock in the Taxable Account that has exposure to this sector.
In John and Jane’s Taxable Account, they are currently long the following mentioned in this article: Apple (NASDAQ:AAPL), Arbor Realty (NYSE:ABR), Archer-Daniels-Midland (NYSE:ADM), Air Products and Chemicals (APD), Carrier Global Corporation (NYSE:CARR), Clorox (NYSE:CLX), Cummins (NYSE:CMI), Dover Corporation (NYSE:DOV), Eaton Vance Floating-Rate Advantage Fund A (MUTF:EAFAX), Emerson Electric (EMR), Enterprise Products Partners (NYSE:EPD), EPR Properties (NYSE:EPR), Equinix (NASDAQ:EQIX), Energy Transfer (NYSE:ET), Eaton Vance Tax-Advantaged Dividend Income Fund (NYSE:EVT), General Mills (NYSE:GIS), Honeywell (NASDAQ:HON), Helmerich & Payne (NYSE:HP), Hormel (NYSE:HRL), Iron Mountain (NYSE:IRM), McDonald’s (MCD), Altria (NYSE:MO), Nordson (NDSN), Realty Income (O), Old Republic International (ORI), Otis Worldwide Corporation (NYSE:OTIS), Parker-Hannifin (NYSE:PH), Ryder System (NYSE:R), Rio Tinto (RIO), Rithm Capital (RITM), RPM International (RPM), Raytheon Technologies (NYSE:RTX), Schlumberger (NYSE:SLB), Southern Company (NYSE:SO), Simon Property Group (SPG), AT&T (NYSE:T), Texas Instruments (NASDAQ:TXN), V.F. Corporation (VFC), Verizon (NYSE:VZ), Washington Trust (NASDAQ:WASH), Warner Bros. Discovery (WBD), Westlake Chemical (NYSE:WLKP), W. P. Carey (NYSE:WPC), and Exxon Mobil (XOM).
Be the first to comment