

Spencer Platt
Robinhood Markets (NASDAQ:HOOD) recently got some good news as the SEC indicated that a ban on payment for order flow (PFOF) was no longer being considered. It was a little over a year ago when SEC Chairman Gary Gensler suggested that such a ban was possible. PFOF is a payment from market makers to brokerages, in exchange for which the brokerage directs trade orders to the market maker. Robinhood makes a large amount of its revenue from PFOF. Forbes reports that about half of Robinhood’s total revenue in 2021, $974 million, came from PFOF. There’s nothing innately wrong with the concept of PFOF, although these payments create “an inherent conflict of interest,” to quote Gary Gensler, because brokerage firms have a duty to direct trades based on the best execution for clients. If the SEC had pursued shutting down PFOF, HOOD’s business model would have gotten a lot harder to pull off.
Seeking Alpha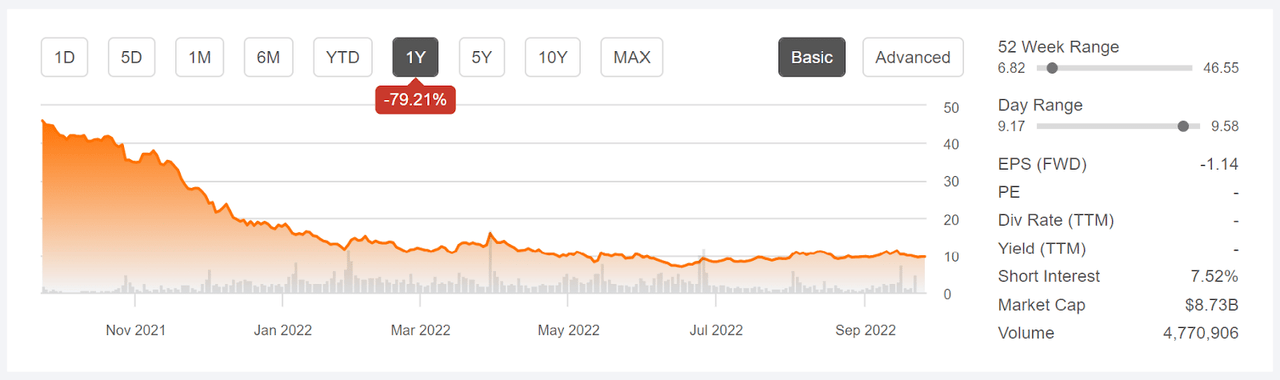
12-Month price history and basic statistics for HOOD
After a much-hyped IPO in late July of 2021, in which HOOD was priced at $38 per share, there were substantial gains and the shares reached the mid-$50s by early August. One year ago, on Sept. 23, 2021, the shares were trading at about $46. Since then, the shares have been in a broad decline and now trade at $9.49, 75% below the IPO price and down 79% for the last 12 months.
HOOD has achieved rapid growth in its user base, recently reaching 22.9M funded accounts and 14M monthly active users (MAUs). There are signs that the growth has stalled out and, in some cases, has reversed. Revenue (slide 11) and MAUs (slide 7) are down substantially over the past year. Average revenue per users in Q2 of 2022 was about half what it was in Q2 of 2021 (slide 10).
HOOD’s client profile is somewhat different from that of the other major brokerage firms. Robinhood clients are more likely to have low FICO scores (<650) than clients at ETrade, Schwab, and TD Ameritrade and Robinhood clients are less likely to have credit scores of 750 or higher. Robinhood clients also have lower average account sizes than these major brokerages as well. Robinhood clients tend to be younger than those at other brokerage firms, which explains a lot, if not all, of these differences.
With the exception of Q3 of 2021, HOOD’s first quarter as a publicly-listed stock, the company has come very close to the consensus estimates for EPS. There’s a steady reduction in quarterly losses over time, and Q3 of 2022 (which will be reported on Oct. 26, 2022) are expected to continue on this trend. The consensus outlook is for EPS to remain negative for the next two years.
ETrade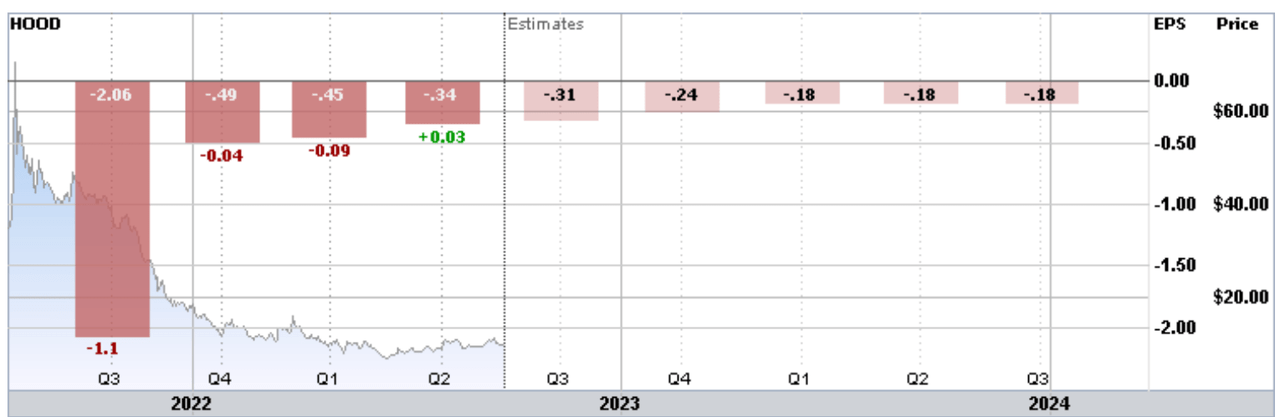
Trailing (4 quarters) and estimated future quarterly EPS for HOOD. Green (red) values are amounts by which reports EPS beat (missed) the consensus expected level
Robinhood faces a number of major challenges, even with a potential ban of PFOF off the table. First, with cryptocurrencies falling dramatically and many of the exciting tech stocks now trading far below their highs, Robinhood’s clients will trade less. This, in turn, will reduce PFOF income. Second, there’s continued scrutiny from regulators about the gamification of trading that Robinhood typifies. Third, the valuations of growth stocks suffer disproportionately when interest rates rise because so much of the net present value depends on earnings that are expected to be realized far out into the future.
I last wrote about HOOD on Nov. 24, 2021, at which time I assigned a hold rating on the shares. For companies like HOOD, for which the valuation is almost entirely determined by projected earnings growth, the key challenge is in establishing some confidence in the outlook. I rely on two forms of consensus outlooks. The first is the Wall Street analyst consensus rating and price target. The second is the market-implied outlook, a probabilistic price forecast that represents the consensus view among buyers and sellers of options, as reflected in options prices. As of Nov. 24, 2021, the Wall Street consensus rating on HOOD was a buy and the consensus 12-month price target was 57% above the share price at that time. There also was a high level of dispersion among the individual analyst price targets, which reduces the predictive value of the consensus price target. By contrast to the Wall Street consensus outlook, the market-implied outlook for HOOD was substantially bearish, with extremely high expected volatility. In compromising between the bullish Wall Street consensus and the bearish market-implied outlook, I assigned a neutral / hold rating on the shares.
Seeking Alpha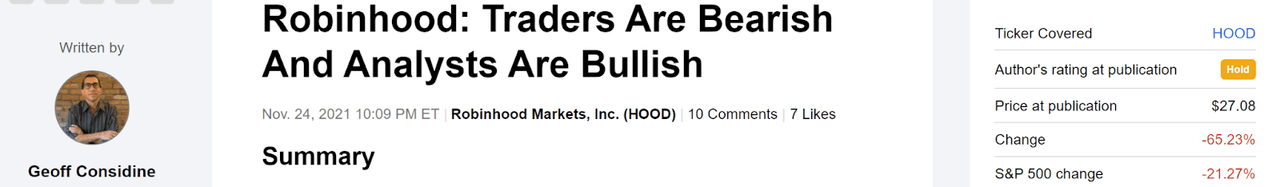
Previous analysis of HOOD and subsequent performance vs. the S&P 500 (Seeking Alpha)
For readers who are unfamiliar with the market-implied outlook, a brief explanation is needed. The price of an option on a stock is largely determined by the market’s consensus estimate of the probability that the stock price will rise above (call option) or fall below (put option) a specific level (the option strike price) between now and when the option expires. By analyzing the prices of call and put options at a range of strike prices, all with the same expiration date, it’s possible to calculate a probabilistic price forecast that reconciles the options prices. This is the market-implied outlook. For a deeper explanation and background, I recommend this monograph published by the CFA Institute.
I have calculated updated market-implied outlooks for HOOD and I have compared these with the current Wall Street consensus outlook in revisiting my rating.
Wall Street Consensus Outlook for HOOD
ETrade calculates the Wall Street consensus outlook for HOOD by combining the views of 10 ranked analysts who have published ratings and price targets over the past three months. The consensus rating is hold, having fallen from a buy rating in mid-December of 2021. The consensus 12-month price target is 24.8% above the current share price. As a rule of thumb, I largely discount the consensus price target when the highest individual price target is more than twice the lowest. In this case, the highest price target is 4 times the lowest price target. As this level of dispersion in analyst opinions, the consensus is not likely to be a useful guide.
ETrade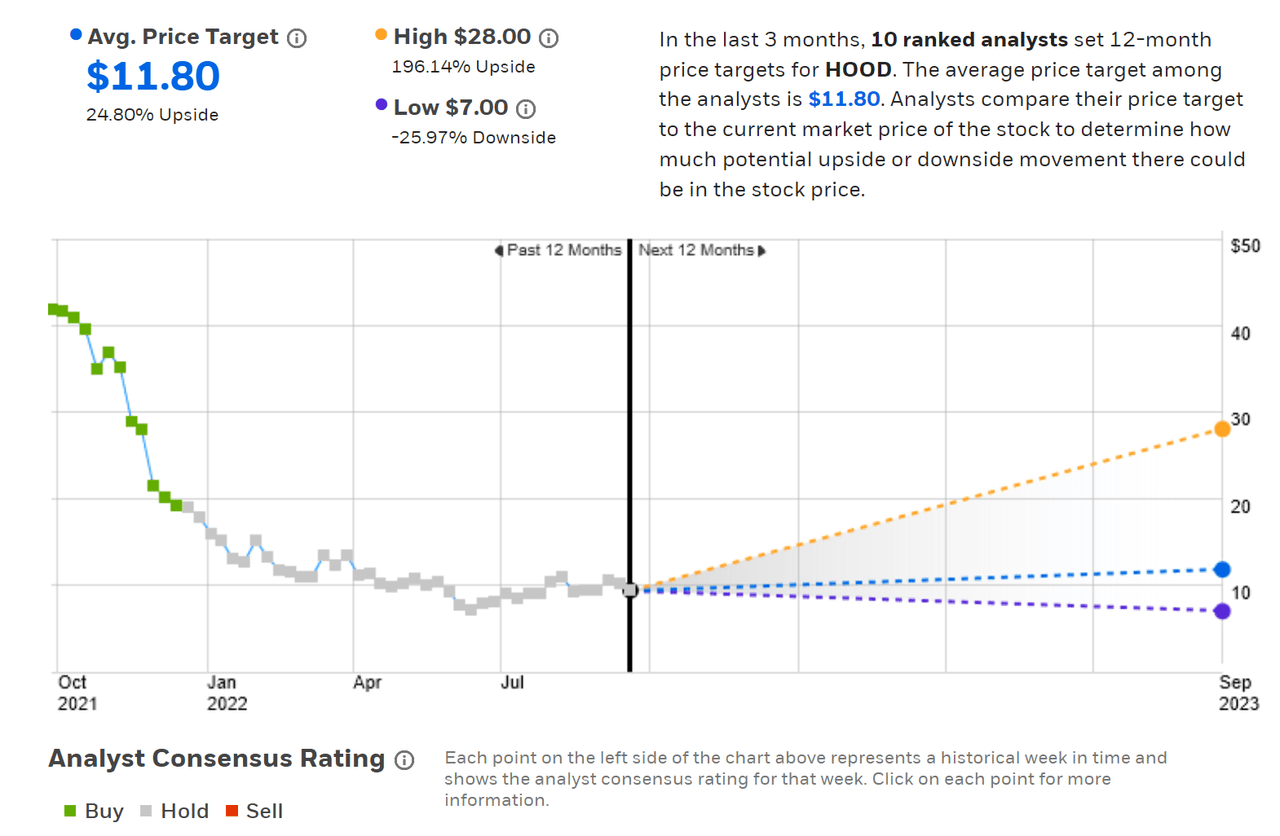
Wall Street analyst consensus rating and 12-month price target for HOOD
Seeking Alpha’s version of the Wall Street consensus outlook is calculated using ratings and price targets issued over the past 90 days by 14 analysts. The consensus rating is a hold, having shifted from a buy at the start of April. The consensus 12-month price target is 20% above the current share price.
Seeking Alpha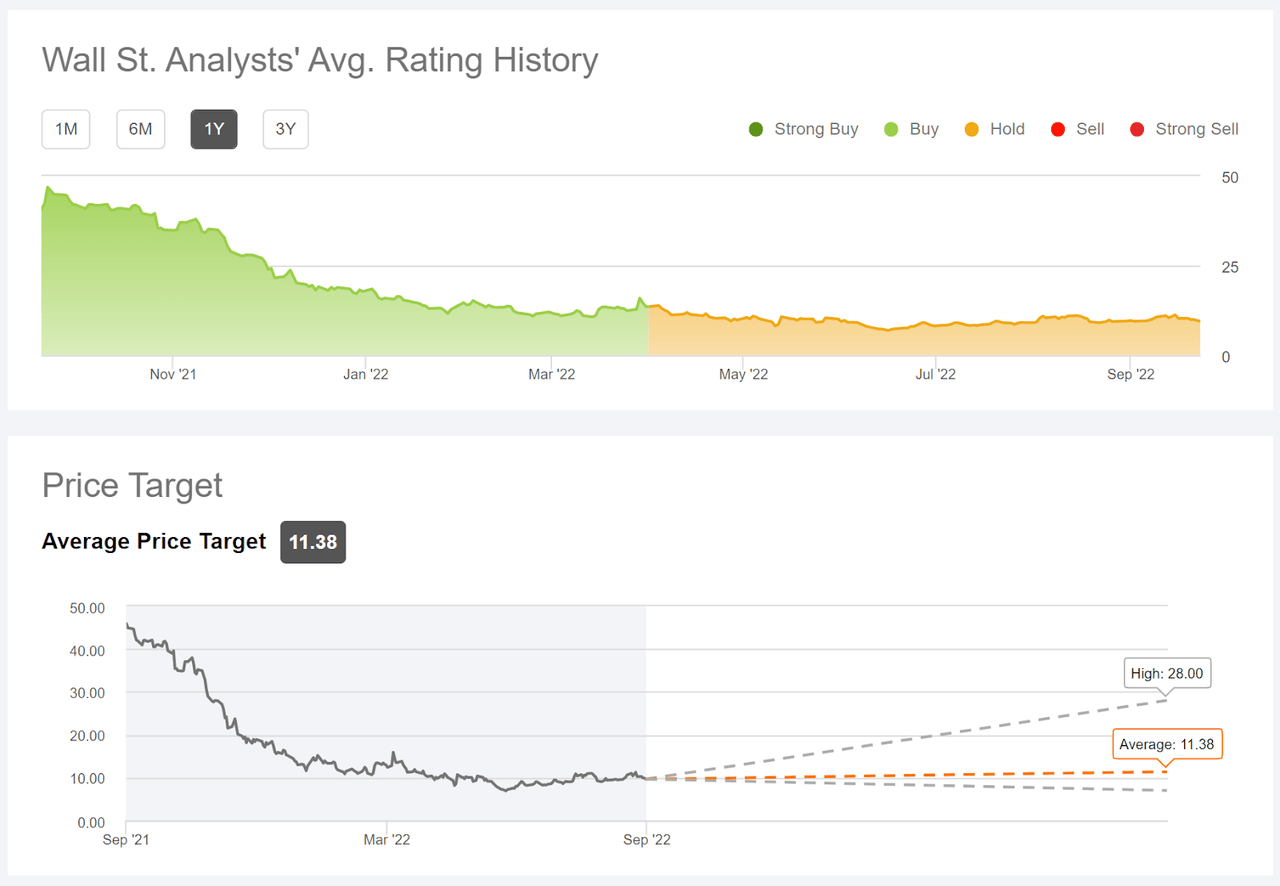
Wall Street analyst consensus rating and 12-month price target for HOOD
The Wall Street consensus rating on HOOD is neutral, with a consensus 12-month price target that is in the range of 20%-25% above the current share price. While the consensus price target tends to have predictive value when there’s fairly low spread among the analyst price targets, this disappears as the analyst opinions diverge. In fact, when there’s a sufficiently high dispersion in the analyst price targets, there’s a negative correlation between the return implied by the consensus price target and subsequent returns. There’s a very high level of dispersion among the analysts for HOOD. At best, this suggests ignoring the consensus price target. At worst, the fairly high return implied by the consensus may, in this case, actually be a bearish indicator.
Market-Implied Outlook
I have calculated market-implied outlooks for HOOD for the 1.8-month period from now until Nov. 18, 2022, for the 3.9-month period from now until Jan. 20, 2023, and for the 4.8-month period from now until Feb. 17, 2023, using the prices of call and put options expiring on these dates. I would have preferred to calculate longer-term outlooks as well, but the options trading volume diminishes dramatically for 2023 expiration dates beyond Feb. 17.
The standard presentation of the market-implied outlook is a probability distribution of price return, with probability on the vertical axis and return on the horizontal.
Geoff Considine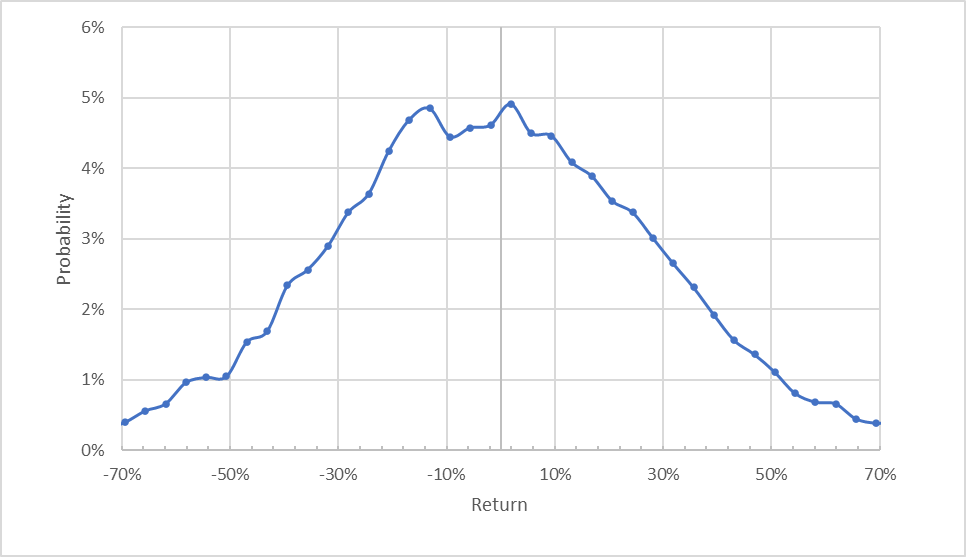
Market-implied price return probabilities for HOOD for the 1.8-month period from now until November 18, 2022
The market-implied outlook for the next 1.8 months is generally symmetric, although the distribution is shifted so that the maximum-probability outcomes are weighted toward negative returns. The expected volatility calculated from this distribution is 91% (annualized). In my November 2021 analysis, the expected volatility for HOOD was about 91% as well.
To make it easier to compare the relative probabilities of positive and negative returns, I rotate the negative return side of the distribution about the vertical axis (see chart below).
Geoff Considine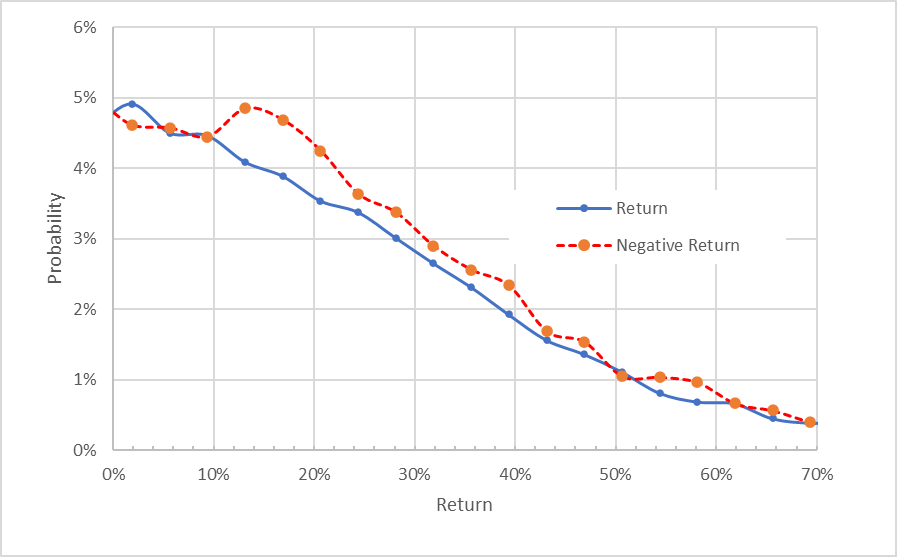
Market-implied price return probabilities for HOOD for the 1.8-month period from now until Nov. 18, 2022. The negative return side of the distribution has been rotated about the vertical axis
This view shows that the probabilities of negative returns are consistently higher than for positive returns of the same magnitude, across a wide range of the possible outcomes (the dashed red line is on or above the solid blue line over almost all of the chart above).
Theory indicates that the market-implied outlook is expected to have a negative bias because investors, in aggregate, are risk averse and thus tend to pay more than fair value for downside protection. There’s no way to measure the magnitude of this bias, or whether it is even present, however. The expectation of a negative bias leads me to interpret this outlook as slightly bearish.
The market-implied outlooks to January and February of 2023 are substantially more bearish than the outlook to November. The probabilities of negative returns are much higher than the probabilities of positive returns across a wide range of outcomes for both (see the two charts below). The maximum-probability outcomes for the next 3.9 months and the next 4.8 months are price returns of -25% and -30%, respectively. The expected volatilities calculated from these outlooks for the next 3.9 months and 4.8 months are 84% and 85%, respectively. Even considering the potential for a negative bias due to investor risk aversion, I interpret these outlooks as strongly bearish.
Geoff Considine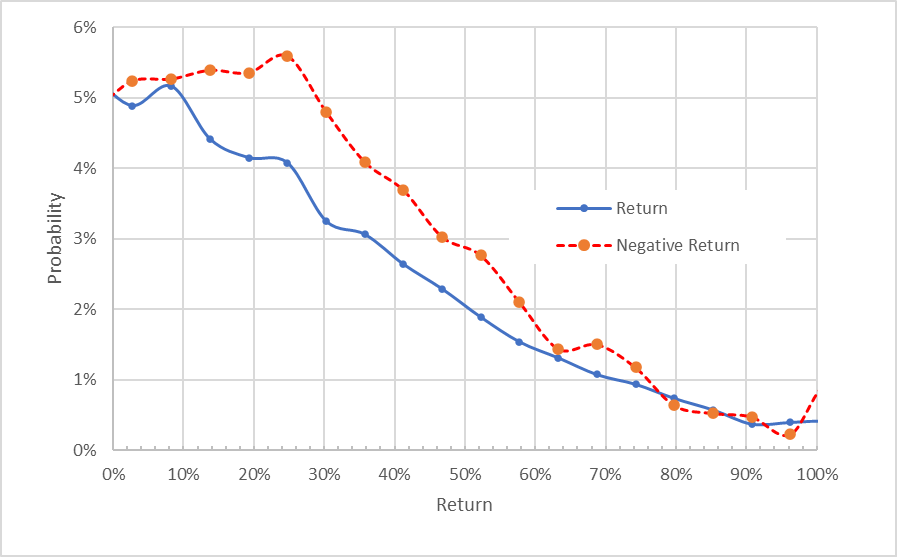
Market-implied price return probabilities for HOOD for the 3.9-month period from now until January 20, 2023. The negative return side of the distribution has been rotated about the vertical axis
Geoff Considine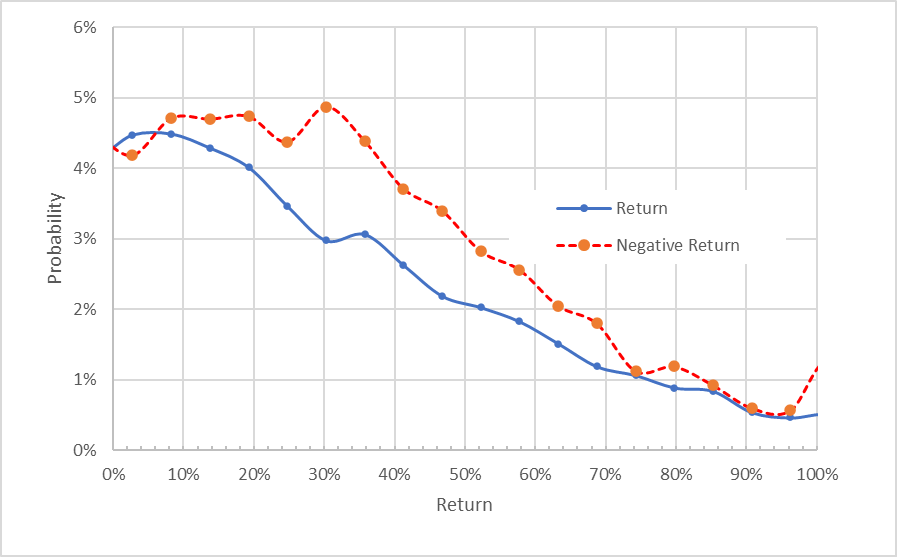
Market-implied price return probabilities for HOOD for the 4.8-month period from now until February 17, 2023. The negative return side of the distribution has been rotated about the vertical axis
The market-implied outlook for HOOD is slightly bearish from now until mid November and strongly bearish looking out to January and February of 2023. The expected volatility is very high, although the outlooks have the volatility falling slightly from late in 2022 into early 2023.
Summary
After an extended period of rapid growth, boosted by the huge popularity of crypto trading as well as the emergence of trading frenzies around meme stocks, Robinhood’s growth has stalled out. While the SEC’s recent decision on not trying to ban PFOF will help Robinhood, there are a host of other barriers to further growth. The substantial market declines in growth equities and crypto have reduced the appeal of gamified trading for many of those individual investors who helped Robinhood to grow. The Wall Street analysts who, collectively, thought the sky was the limit for HOOD have dramatically cut back their projections. The Wall Street consensus 12-month price target corresponds to an expected return of 20%-25% from the current share price of $9.49. When I last wrote about HOOD in November of 2021, the shares were trading at $27 and the consensus expected return was 57% over the next 12 months. Interestingly, the options market was sending a substantially bearish signal in November of 2021 and that continues to be the case today. Even if I was willing to take the Wall Street consensus price target at face value, 25% expected return is not enough to justify the 85% annualized volatility. Back in November, the bullish Wall Street consensus outlook convinced me to compromise on a hold rating for HOOD, even though the market-implied outlook was bearish. With the collapse of the analyst expectations and the ongoing bearish outlook from the options market, I’m changing my rating on HOOD from hold to sell.
Be the first to comment