

ChrisHepburn
Introduction
My primary focus as an investor, is to construct a portfolio around companies that provide a growing income over time. I maintain that approach for several reasons, such as the fact that being committed to paying a growing dividend disciplines management teams and limits the possibilities for squandering the accumulated earnings. My preferred time to invest, is when trustworthy companies with a proven track record in doing so, trades with a forward dividend yield above the recent average.
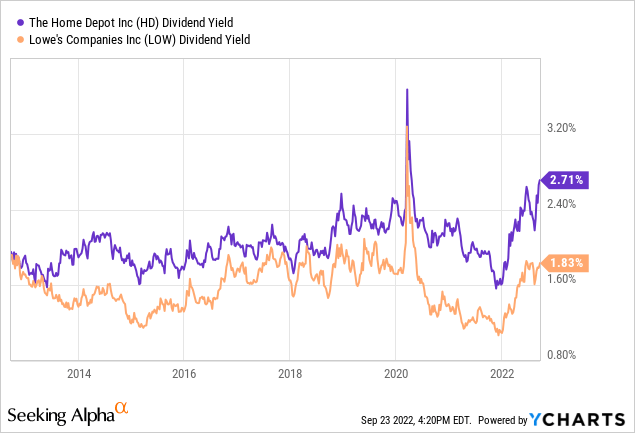
Given where both Home Depot (NYSE:HD) and Lowe’s (NYSE:LOW) current yields are situated, today appears as a timely opportunity to consider investing in these two companies with twelve- and fifty-nine consecutive years of raising their dividend, respectively. With a starting yield of 2.8% for Home Depot and 2.2% for Lowe’s, their starting yields are amongst the best they’ve been in the past decade. The illustration above can be confusing, but the substantially higher forward yield for Lowe’s is due to management having hiked the dividend by 31% earlier this year
These companies are considered as consumer discretionary, suggesting they offer items that would be out of favour with consumers in a situation where there is uncertainty concerning the economic outlook. People will still buy groceries and pay their phone bill but might postpone renovating their outhouse or redecorate their master bedroom. These companies, however, are also the two big fish in their subsector, home improvement retail, and as such, their industry position is somewhat similar to that of Mastercard (MA) and Visa (V) or Coca-Cola (KO) and PepsiCo (PEP). My own portfolio comes with substantial differentiation, and while it’s perfectly fine to own both in either of these cases, I personally always strive to stick with one as to avoid ending up with a portfolio reminiscent of an ETF with too many holdings.
Therefore, I always try and identify the best choice fitting the needs of a dividend growth investor, tailored to my own risk appetite. Here I’ll go through both companies to try and identify if there is an obvious choice, or whether it comes down to nuances.
First A Bit Of Background
The prime focus here is naturally on how the companies perform financially, as that inevitably is the prime predictor of how the future will turn out, but despite being similar companies, they do have individual focus areas, and that’s also worth to keep in mind.
Lowe’s History And Market
Lowe’s was founded 101 years ago in North Carolina, operating 1971 stores as of January this year, with 1737 distributed across all US states and the remaining 234 in Canada. As can be expected by a modern and industry leading home improvement retailer, Lowe’s cater to both homeowners, renters and professional customers. Enable a total home solution for every need in a home, Lowe’s offer on-site pickup in stores as well as online shipping, while also offering subcontracted services across must product categories.
In order to operate a nationwide footprint, Lowe’s own and operate a significant distribution centre setup of 15 regional DCs supported by 15 flatbed DCs that handle odd sized, bundles or difficult to hand items. A necessary setup in order to facilitate global sourcing of items as well as delivery to stores or directly to customers, not to mention the fact the flatbed DCs can be an advantage when catering to professional customers who require larger quantities.
FY2021 resulted in $96.2 billion in sales, with an operating margin of 12.5% and a net income of $8.4 billion. Lowe’s employ roughly 300.000 employees and Marvin R. Ellison, 57, has been the CEO since 2018, having previously worked for Target (TGT), Home Depot and JCPenney. Of its total sales, Lowe’s sell somewhere between 20-25% to professionals, while the rest goes towards the DIY segment. The professional segment often comes with more attractive margins, and this segment penetration is what puts the two companies apart.
Lowe’s debt profile shows a scattered distribution, with $4.5 billion due through 2026 out of a total long-term debt, at FY2021, of $24.7, while maintaining investment grade ratings from rating agencies.
Home Depot’s History And Market
Home Depot was founded 44 years ago in Georgia, operating 2317 stores as of January this year, with 2006 of those stores located in the US. In addition, Home Depot has 182 stores in Canada and 129 stores in Mexico, creating a larger footprint than Lowe’s. These stores in Canada and Mexico means that all provinces in these two countries come with a at least one Home Depot store.
Similarly, as for Lowe’s, Home Depot also cater to both homeowners, renters and professional customers. Strategy wise, Home Depot strives to go the extra mile in an effort to cater to especially the professional segment, having a customized online experience, dedicated sales force, enhanced inventory management- and loyalty programs. About 45% of Home Depot’s total sales come from pro customers versus about 20% to 25% at Lowe’s, according to the companies. Home Depot, with a larger physical footprint, is equally dependent on an efficient supply chain, allowing on-time distribution within its network and efficient returns processes through a store and distribution network collaboration. Catering to professionals, Home Depot also operate flatbed DCs.
FY2021 resulted in $151.2 billion in sales, with an operating margin of 15.2% and a net income of $16.4 billion. $12.2 billion of the $151.2 billion in sales originate from outside the US. Home Depot employ roughly 500.000 employees. Ted Decker, 59, has been CEO since March 2022 but has been with Home Depot for the past 23 years harvesting experience throughout most of the company, eventually becoming COO in October 2020 before being promoted to CEO.
Home Depot’s debt profile also exhibits scattering with $7.6 billion due through 2026 out of a total long-term debt, at FY21, of $36.4 billion, while maintaining investment grade ratings from rating agencies.
What Makes A Good Dividend Growth Stock?
There are many factors to consider when fishing in the ocean of dividend paying stocks. The point of departure could be anchored around one’s investment horizon, as there is a distinction between aiming at achieving a growing dividend vs. focusing more on the immediate income. From my perspective, the two companies in question belong to the category of dividend growers, which therefore also impacts the parameters I’m most interested in, which includes factors such as.
- Historical ability to grow revenue, earnings and cash flows in combination with the outlook
- The return on invested capital, an indicator of whether a company is able to create value long-term.
- Payout ratio and dividend CAGR seen over an extended period
- The initial yield, as it matters greatly when counting the investment horizon across decades.
- The management team
While I primarily pay attention to the factors above during my due diligence process, there are additional factors worth considering. Especially when studying stocks belonging to the high-income segment, such as companies belonging in tobacco or oil and midstream. These factors are often more about protecting the existing income, than focusing on it expanding significantly year over year and could include some of the following perspectives.
- Dividend growth track record
- Overall debt levels in respect to both earning- and debt levels.
- Interest coverage
- Volatility
Having said that, let’s jump into it!
Revenue, Earnings And Cash Flows
For those unfamiliar with these companies, I can already reveal that they have healthy payout ratios, which raises the question why we should pay attention to top line growth levels as they could easily continue raising dividends for years without expanding their business. Revenue is of interest as it’s the long-term fuel required to keep the annual hike sustainable, assuming earnings rise alongside revenues. In addition, working with that assumption, a growing top- and bottom line therefore also positively impacts the total return, as dividend growth can’t and shouldn’t stand alone if one plans to hold onto a stock for decades.
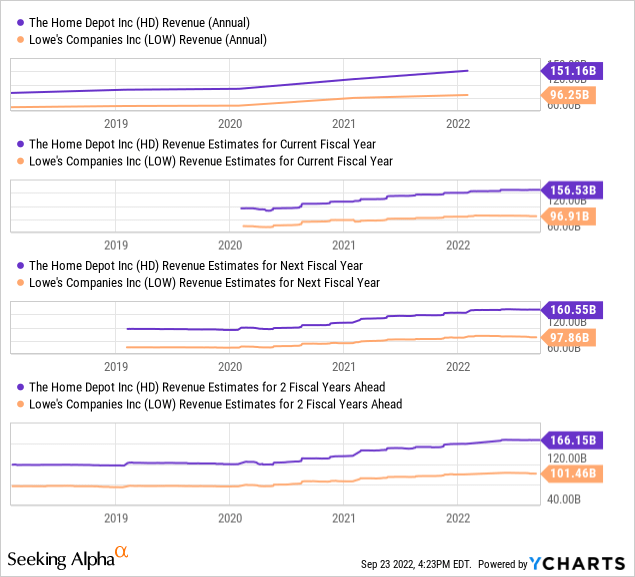
Seen from afar, these two behemoths have managed to grow their revenues to almost an identical extent over the past decade with 102% for Home Depot and 90.5% for Lowe’s. On a five-year horizon, the growth is 49.8% and 40.2% respectively.
Observing the outlook, and Home Depot takes the price from a percentage based standpoint with an expected revenue growth of 3.56% this year, 2.56% next year and 3.49% the year after, while Lowe’s is expected to grow revenue by 0.7% this year, 0.97% next year and 3.68% the year after. As such, both companies grow more or less in line with GDP, while Home Depot’s percentage based growth also comes off a larger numerical starting point, meaning they expect to grow revenue by roughly a handful of billions per year.
As uncovered in the introduction, these companies are very similar, but Home Depot do have a larger foothold with the professional segment, and while everybody was conducting DIY projects during the Covid-19 shutdown, homeowners are once again outsourcing such activities to the pro’s while preferring to spend their time elsewhere, at least from a simplified standpoint.
It’s easy to believe that Home Depot has grown to the extent it can, but management has earlier in 2022 upped their view on the total addressable market available and has their eyes set on reaching a $200 billion revenue mark. Specifically, Home Depot would like to increase their attractiveness towards professionals even further, so that they can be considered a one-stop shop where everything of need is available. Frankly, Lowe’s is conducting the same journey, but just from a point of a small disadvantage in comparison to Home Depot. However, being second in no shame in an industry with a lot of local operators and fragmentation, where both these companies can utilize their scale for superior earnings power and growth. If one dives into their 10K’s, it’s quickly evident that both management teams are tweaking store concepts for an ever ongoing pursuit of efficiency and optimization of sales per square meter, impressive for such mature operations.
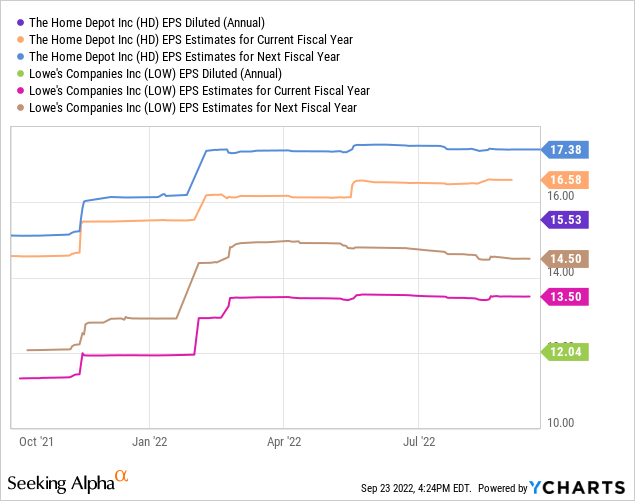
However, if we turn our attention to the bottom line, Lowe’s stand to perform better, with an expected EPS growth of 12.1% this year, 7.4% next year and 13.2% the following year. In comparison, Home Depot is expected to grow its EPS 6.7% this year, 4.8% next year and 6.7% the following year. These numbers come substantial uncertainty, as forecasting just a few years ahead is difficult, and even more so in the current inflationary environment where we have little idea as to where we end. It takes just a small slip up somewhere in the company value chain, before billions are shed from the bottom line. However, as Lowe’s is playing catch up, it’s the general consensus that Lowe’s will grow its bottom line more than Home Depot over the coming years, also after the macro outlook returns to a more stable situation.
Both companies have received a substantial amount of downwards EPS revisions in recent months, as have most stocks in conjunction with the reality of where the economy is heading.
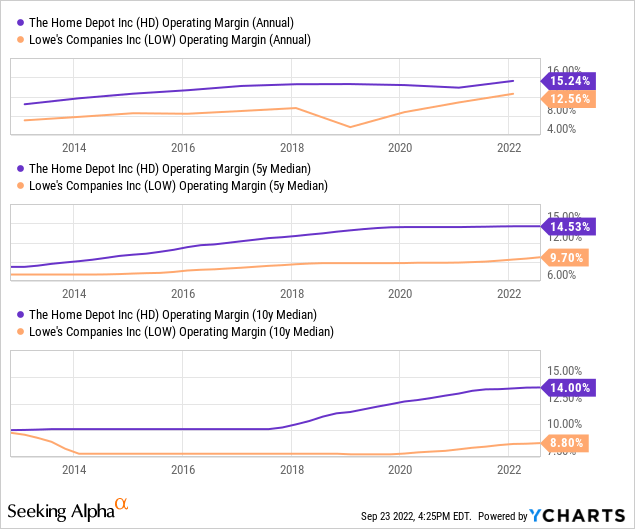
When observing the operating margin, the difference between the earnings power of the two companies become quite evident. Lowe’s has been catching up, but it’s difficult to assess whether they will be able to close the gap fully. Home Depot is in possession of the largest market share, driving efficiencies, having the most diverse geographical and market footprint, which also shows itself in sales per square meter, where Home Depot is outperforming. Just a couple of percentage points in operating margin may not seem like a lot, but when you consider the $151.2 billion topline, it quickly adds up.
This all ties together as Home Depot has the advantage of a stronger foothold with the professional segment, a lucrative standing as it gives repeat buys due to their need for a reliable supplier of equipment and materials, supported by the larger store footprint by Home Depot. Professionals conduct higher value transactions and more of them, which in the end results in efficiency and a higher amount of sales per store square meter.
Lowe’s have however been smart about it and recruited a CEO who has more than a decade in the higher echelons of Home Depot before transferring to Lowe’s, meaning he is spearheading the transformation that, in the perfect world, should have been conducted years ago. It’s easily possible to get the sensation that Home Depot is miles ahead of Lowe’s, which I believe is an unfair conclusion, but I would conclude that Home Depot does have an advantage with their current marketplace position and competitive maturity.
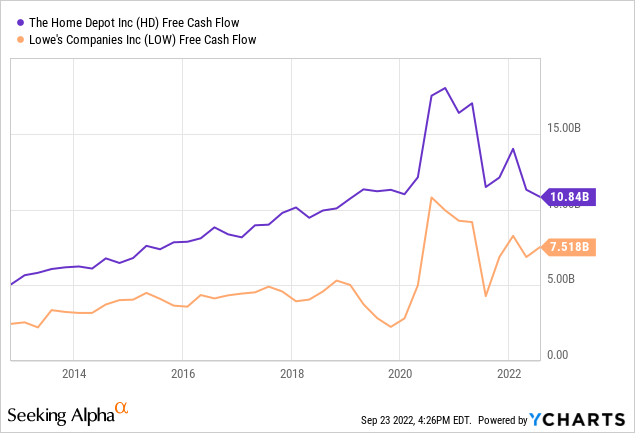
This catch-up journey also means that Lowe’s theoretically would have to allocate a higher amount of investments into its stores and setup in general to support its turn towards a more profitable future, evidently, Home Depot consistently churns out a larger free cash flow, but that is of course not surprising in itself given the gap between the two companies when it comes to overall revenue. On a per share basis, it’s a much more equal picture, but numerically, Home Depot is leading the race on this parameter.
Summarizing this section, and Home Depot is most impressive.
Return On Invested Capital
One of my absolute favourite financial metrics and one which I personally believe is a clear indicator of outperformance in the long stretch when comparing similar companies. It speaks volume about a management team while high ROICs typically also mean the given company is less reliant on debt, or dilution, due to a superior free cash flow generation ability. Considering that from a strategic perspective, and it means the company is more likely to be free of constraints due to for instance a bleak rating agency rating, putting pressure on the balance sheet. From a financial standpoint, it’s an indicator of a management teams’ ability to allocate finances efficiently.
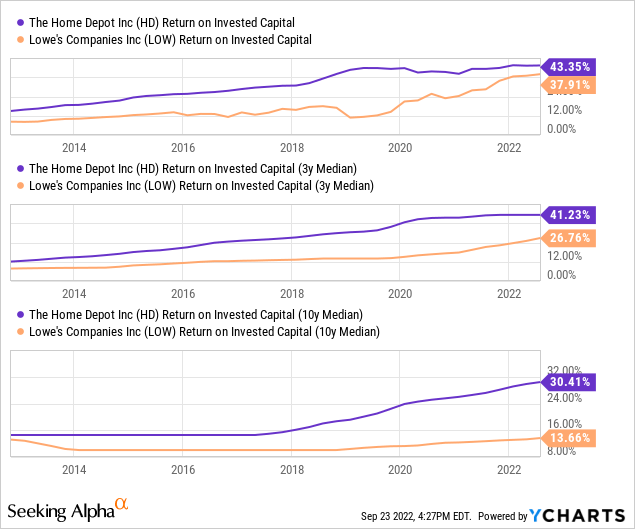
What took place ten years ago, is a little importance today, but it’s interesting to observe the journey that Lowe’s has been on in terms of improving its return on invested capital, to the point where it has almost closed the gap.
Again however, a feather in the hat to Home Depot.
The Dividend – Growth, Track Record And Payout Ratio
Seeking Alpha’s dividend scorecard, measures companies on safety, growth, yield and consistency when it comes to their dividends, and here Lowe’s is beating Home Depot on two out of four, while drawing for growth and losing out on current yield. With 59 notches in the belt, Lowe’s belong to the hall of dividend kings, a small select group of companies who has managed to grow their dividend for at least 50 consecutive years. In comparison, Home Depot has only managed to grow its dividend for 12 years. The company has however been paying a dividend since 1987, which is a sign of a firm commitment for them to continue doing so, even if being far behind Lowe’s when it comes to having proved time and time again throughout recessions, that they are capable of doing so, even under extreme macro conditions.
The 5-year CAGR of their dividends come in at 16.9% and 18.7% respectively, for Home Depot and Lowe’s. Impressive that Lowe’s continue to grow its dividend so significantly considering it’s an unbroken journey of 59 years. At this point, most dividend king peers are resorting to penny increases, but not in the case of Lowe’s, remarkable.
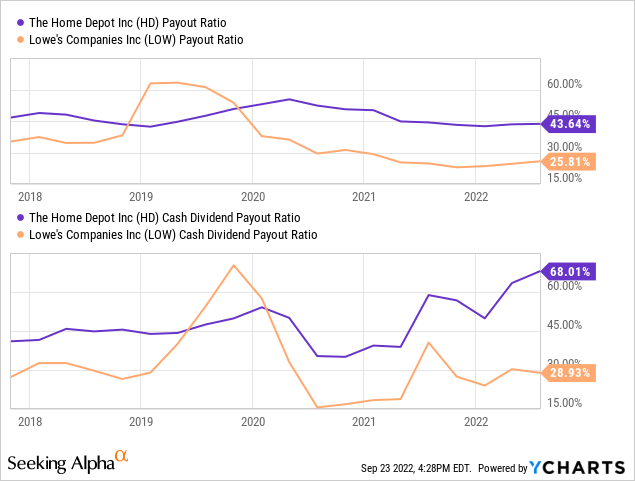
When observing the traditional payout ratio, we initially get the perception that the companies are more or less in line, and both with very healthy payout ratios. However, if we observe the cash dividend payout ratio, which takes into account the effect from capital expenditure, we can see that Home Depot’s payout isn’t nearly as healthy as Lowe’s. With capital expenditure programs most likely being assigned for several years at a time, this more precise payout ratio can fluctuate some. With a downturn in free cash flow for Home Depot this year, the consequence shows itself in this metric, but I’d have to see more than one year’s observation to conclude that an unfavorable trend has begun. As such, I’d consider it a blip on the radar for now, not least given how Home Depot has managed to keep its payout ratio within a consistent band for such a long time. That doesn’t take away the fact, that Lowe’s is currently in a more comfortable situation.
Furthermore, Lowe’s is also allocating more capital to buyback of its shares, having reduced its float by 23.2% in the most recent five years, in comparison to a 12.7% reduction for Home Depot. Zooming in, and Lowe’s has reduced its float by 17% in the most recent years, while Home Depot has only managed to reduce it by 6.3%.
Today, you can pick up shares in Home Depot with a starting forward yield of 2.8% and 2.3% for Lowe’s. Last time, Home Depot hiked its dividend with 15.2% and Lowe’s hiked theirs with a staggering 31%. Both companies came from a massive FY2021, with Lowe’s sending a clear message to their shareholders in terms of their commitment to the continued growth of its dividend. Having said that, such hiking patterns is not what I would expect on a consistent basis, but is what I could observe to be the result of a financially stellar year.
Authors Own Creation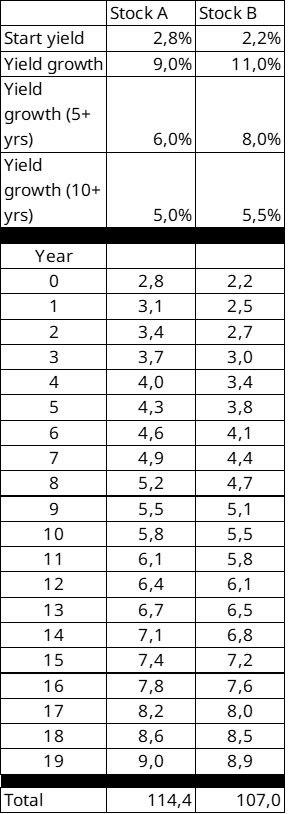
I’ve made a small thought experiment in the table above, where Home Depot is labelled as stock A and Lowe’s as stock B.
With their initial forward yields today, and assuming that Lowe’s consistently can outgrow Home Depot’s dividend, Lowe’s still come up short from a total perspective under these given assumptions. Point being, the starting yield matters a lot, and even if I’ve assumed they can’t hike their dividend by a lot more than Home Depot, I’ve stilled assumed they will do so consistently for 20 years. In fact, during that twenty-year period, Lowe’s doesn’t manage to catch up to Home Depot’s annual dividend at any given year.
Authors Own Creation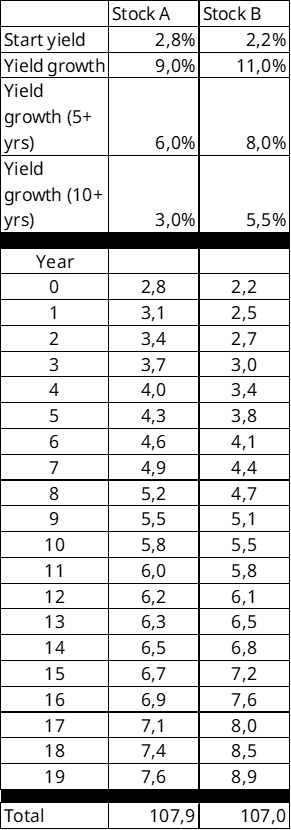
Even if I assume that Lowe’s can continue hiking by almost twice as much from year ten and onwards, the total dividend received during the period turns out in favor of Home Depot after twenty years. If the holding period is longer than that, it’s evident from year thirteen and onwards, that it quickly spirals in favor of Lowe’s.
Point being, starting yield matters, under the assumption that one doesn’t severely outgrow the other in the early years during the observation period.
When it comes to the dividend, I’m conflicted as to who I would label as the preference, given that Home Depot currently offers a stronger forward yield, while Lowe’s has a better track record, higher CAGR in recent times and a less strained payout ratio if observed today. If I were to hold either stock for roughly a decade, I’d favour Home Depot, but if the time horizon expands, Lowe’s might be the preferred option if one believes they can outgrow Home Depot’s dividend substantially, allowing to overtake at some point.
Valuation
Two similar companies, let’s see how they rank when it comes to current valuation. As mentioned in the beginning, as investors we want stocks that trade well below their historical averages, giving indication of a strong potential for mean reversion, increasing the total returns potential.
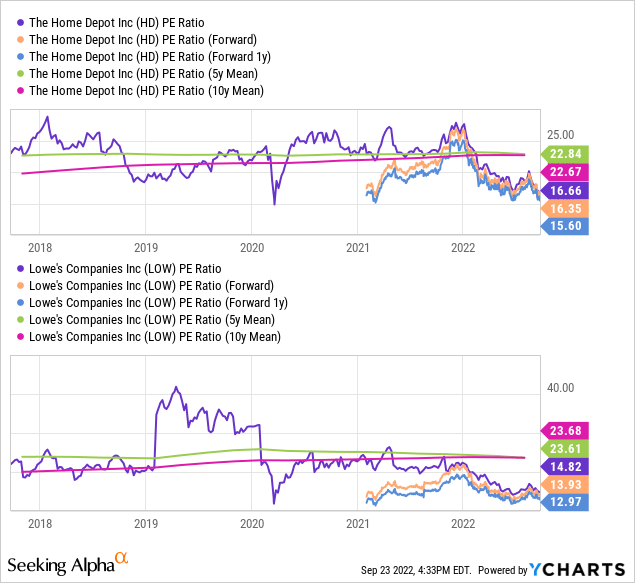
Lowe’s has on a five- and ten-year mean basis traded at a higher price to earnings ratio than Home Depot and is currently trading at a lower forward P/E ratio, also on a forward 1Y basis, suggesting that Lowe’s would possess a higher mean reversion potential.
The P/E ratio belongs to the simpler of valuation metrics, and a similar, but more free cash flow focused valuation metric, is the FCF yield. Companies such as these two, own a lot of property, equipment and inventory which are all subject to depreciation, meaning we are left with accounting numbers for conducting our valuation when not focusing on free cash flow. This can cause for difficulties in comparison, as numbers can move around dependent on how write-offs are handled. On the other hand, I’d like to narrow the potential gap for misunderstanding and uncertainty, and FCF yield is a more precise indicator of company performance in comparison to the P/E ratio.
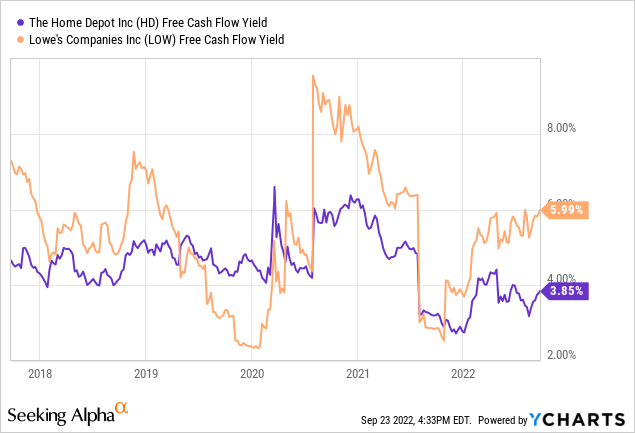
I typically start becoming interested if the free cash flow yield is close to 4% or better, and here, Lowe’s is again indicated as a more attractive deal. However, note the fluctuations in the FCF yield, as free cash flows have been lumpy in recent years. It should also be mentioned, that with reduced free cash flows in the coming years, these metrics will come down unless the market cap gives way.
Wrapping Up
When I started opening the books of these two great companies, I hoped I would end up with a clear answer, but as is often the case in investing when dealing with strong duopoly like conditions, it comes down to nuances and preferences in terms of one’s investment strategy.
I find that Home Depot is currently situated better in the market, reaping the benefit in form of strong financial performance, while Lowe’s is playing a bit of catch up. From a dividend standpoint, Lowe’s check more boxes, and here it’s more a matter of investment horizon as Home Depot would give a better starting yield, while Lowe’s has been more consistent over time, has compounded its dividend at a greater rate, all at the same time while having a better payout ratio to showcase.
From a valuation standpoint, Lowe’s appears more attractive, even though both companies appear as solid buys at this point in the market. I would provide some caution however, as we’ve seen leading financial indicators show a worsening housing market in conjunction with fewer new builds, not to forget the spiking interest rate making life more expensive for homeowners. All of which will pressure the marketplace that Home Depot and Lowe’s serve. I would make use of dollar cost averaging should I initiate a position in either of these companies, as while they appear attractive today, they will feel the blunt force of a crumbling housing market, which would translate into stock price pressure.
Be the first to comment