

RobertCrum/iStock via Getty Images
The yield curve inverted on April 1, 2022. Inversion is probably one of the most accurate leading indicators to recessions. In fact, a market crash and recession has promptly followed each inversion in the last 40 years. More importantly, there has not been a recession which was not preceded by a yield curve inversion.
Yield Curve (FRED)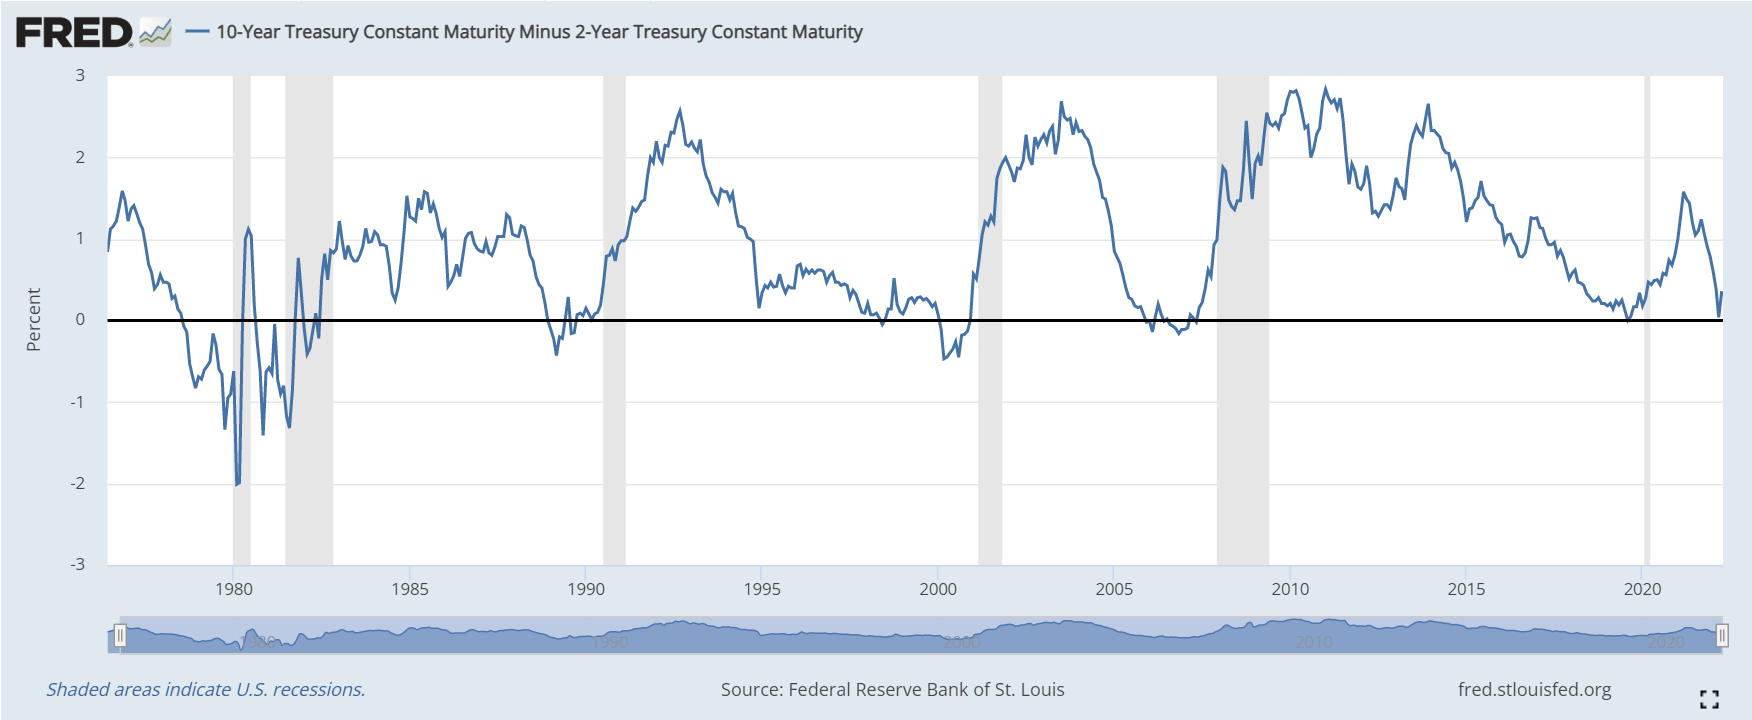
(Source: FRED economic data from St. Louis Fed)
By this alone, investors should begin considering protection against a serious market drawdown within the next 15 months. This yield curve inversion comes with an interesting set of macroeconomic conditions and geopolitical backdrop which suggest an increased probability of market volatility ahead.
For one, the current US inflation is very concerning. It is the highest in 40 years. The inflation’s root cause is the monetary policy used to evade a prolonged COVID-19 induced recession in 2020. The US monetary base has almost doubled in the last two years while the real GDP has not nearly doubled. This means the value of each unit of money must decrease, which means prices must increase. This concept is basic supply and demand—the supply of money has increased while the amount of goods and services have not increased to create a matching increase in money demand (people demand money when they are trying to buy goods and services in an economy). Thus, the value of money decreases.
Monetary Base (FRED)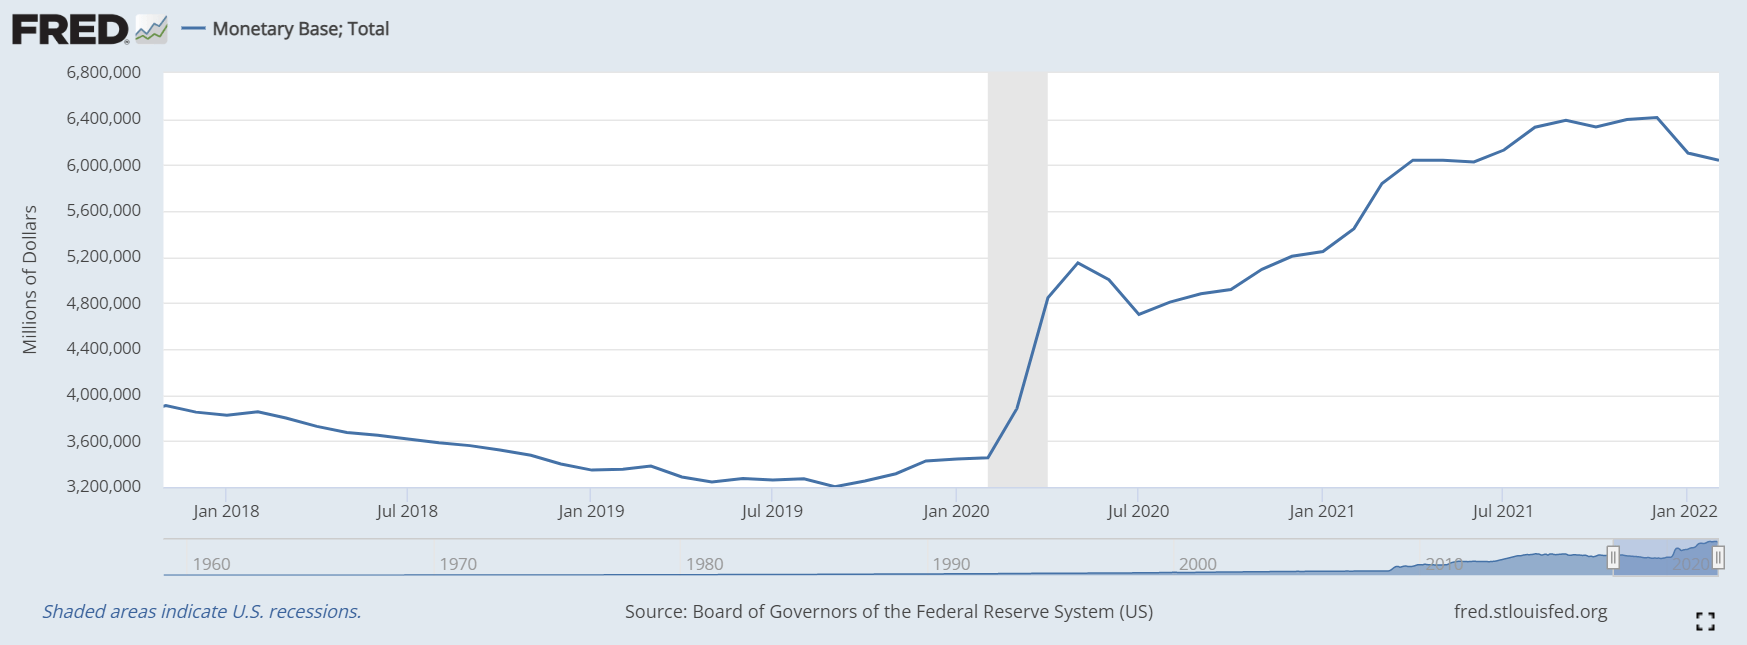
(Source: FRED economic data from St. Louis Fed)
Unexpected high inflation is problematic because people become poorer. Owners of financial assets lose because the cash flow they receive are worth less than what they originally signed up for. Also, there is an expectation that central banks will raise interest rates to curb it, thus decreasing the value of financial assets.
The inflation today is a troublesome situation which the US has not experienced since the late 1970s. Back then, the public debt was only a 30% of GDP. Today, it is 123% of GDP. This is what makes Paul Volcker’s 1981 interest rate hike infeasible today. The interest payments that the federal government would take on in a substantially higher interest rate environment would dramatically increase the US deficit. This may lead to cuts in government spending, which would decrease aggregate demand and therefore corporate profits. This is bearish. The alternative is to print more money to service the increased interest rate burden. This is not necessarily bearish since the US has done this consistently in the past few decades all while seeing a prominent rise in US equities. But today, printing more money would exacerbate the inflation issue, and that would be bearish.
Without being able to curb it by simply raising rates as Volcker did in 1981, the Fed is in unchartered territory. If the US government turns to price controls to solve the inflation problem, the unprecedented intervention in free markets will probably cause many investors to sell US equities. Also, interventions like this do not work because they introduce other issues. Basic economics tells us that if a firm cannot sell something at the marginal cost of producing it or higher, then it will cease operations. What this looks like in real life is increased unemployment and civil unrest. This is all bearish.
The geopolitical issues surrounding Western sanctions on Russia also contribute to inflation. Much of the world’s commodities are sourced from the regions involved in the conflict. For example, Ukraine and Russia together exports over a quarter of the world’s wheat. This will cause the price of food substitutes like rice and soybeans to rise as well. The impact on crude oil and natural gas is well known at this point to most people.
The larger issue comes from the West being adamant in not buying from Russia and countries which are friendly with Russia. This will force a reroute of well-established supply chains, all while existing supply chain issues still exist. This could lead to Q2 and Q3 profits being much lower than expected as many companies report supply chain issues and are unable to give guidance for when this issue will be resolved.
On top of that, this trend of de-globalization hinders growth. Over the last twenty years, the Western service economies have become very dependent on specific parts of the world for specific points of value creation. For example, raw materials for electronics are sourced from mines in Africa or Russian and then put together in places like China and Southeast Asia. There will undoubtedly be growing pains moving forward with the West’s decision to fragment this process along ideological lines. Redoing so much of the value chain so suddenly will impede growth. Add that to an inflationary environment and you have stagflation, which is never good for the economy and rarely good for equities.
Thus, the current outlook is less than favorable. The yield curve inversion reinforces the thesis that a crash is on the horizon. However, market crashes usually require a catalyst—something that makes many people decide that it is time to take profits, which initiates the heavy selling and downward spiral. In 2008, this was the collapse of Lehman Brothers. In 2020, this was the realization that COVID-19 would be worldwide in short time. Over the next 15 months, the catalyst (if there even is one) is anyone’s guess. The point is that the current macroeconomic environment offers sufficient tinder for a firestorm of selling if a catalyst materializes. This all exists separate to the fact that multiples of the SPDR S&P 500 Trust ETF (NYSEARCA:SPY) and Invesco QQQ ETF (QQQ) have been at historic highs for a while. Both are likely due for a serious drawdown.
The Crash Approaches, What Will You Do?
It rarely makes sense to sell passive index holdings. Despite the headwinds presented, America still enjoys its position as the controller of the global reserve currency. American securities enjoy the most credibility and central bank backing. The US economy is still very strong. Trying to time market swings generally ends in the investor paying large opportunity costs by waiting forever for a crash.
A better solution is to start hedging when indicators are flashing signs of trouble. Because that is the case today, hedging makes sense now. First, I will list some names which do well with market volatility. Investors can build positions in these stocks and funds as a hedge. Then, I will describe some ways to hedge using index or index ETF options. With options, I aim to establish the hedge at a near zero cost such that the credit from option sales mostly offset the debit from option purchases.
Virtu Financial, Inc. (VIRT)
VIRT is a market maker for all kinds of markets. Market makers consistently do very well during bouts of market volatility because their revenue is decided by the bid-ask spread and the volume of trades. When markets sell off, both the bid-ask spread and transaction volume grows, exponentially increasing revenue. This is enormously profitable for shareholders because VIRT’s costs are mostly fixed. A quick glance at VIRT and SPX against each other shows how good of an equity hedge VIRT is. Notice VIRT’s price action during the SPX correction in early 2018, the (almost) bear market at the end of 2018, the COVID-19 crash in March 2020, and the most recent volatility due to Russia and inflation. Furthermore, VIRT has a history of growing its dividends and has a very high level of insider ownership, meaning its management is well aligned with shareholders.
VIRT Price and SPX TR (Seeking Alpha)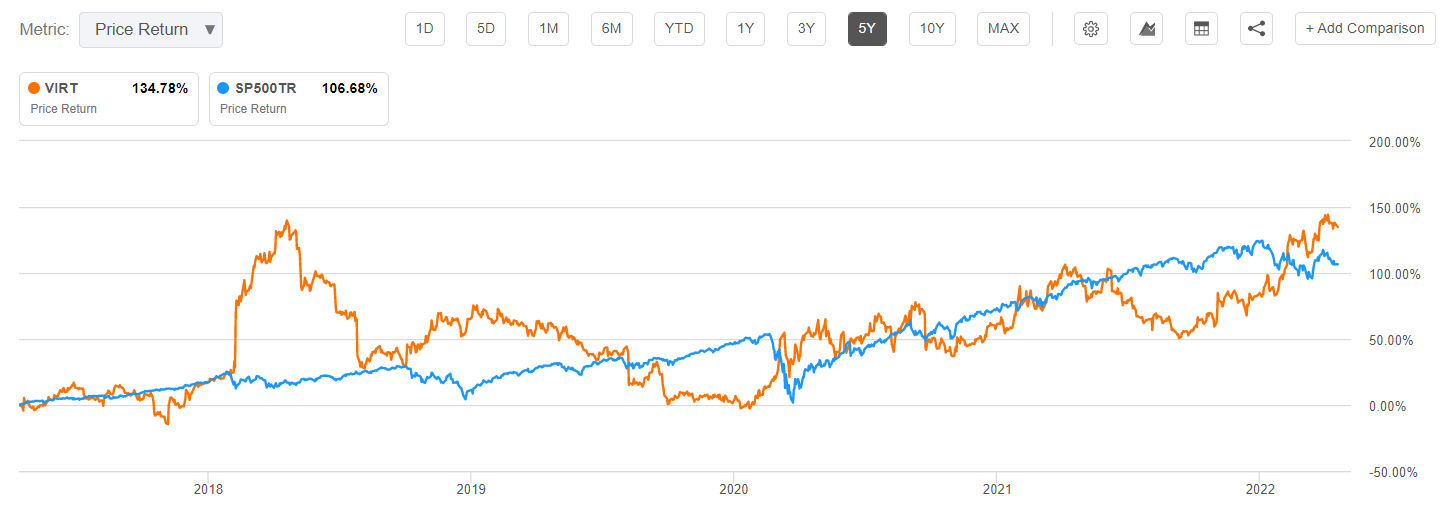
(Source: Seeking Alpha)
CME Group Inc. (CME)
CME operates markets for futures and options on futures. Like VIRT, CME earns more from increased trading activity. When equity markets are in turmoil, futures and options will naturally experience more activity as people are using them to hedge various exposures. Because the nature of this next crash is likely based around the inflation of commodities, commodity futures could see larger volume as well. Also, CME is naturally a steady growing stock with a growing dividend. Over the last ten years, the dividend per share has increased six-fold.
Simplify US Equity PLUS Downside Convexity ETF (SPD)
SPD holds an S&P 500 ETF with some 50% OTM SPX and SPY puts all in an ETF wrapper. Therefore, it is less of a hedge and more of a replacement for SPY during “risk-on” periods. One could also just keep SPY holdings and buy 50% OTM puts in the same maturity and allocation as SPD, but getting the ETF is less hassle. The main downside is that SPD hedges respond best when the market crashes over 30%. Otherwise, the puts are too far OTM to provide good protection, and you end up experiencing the market drawdown while paying for puts which did not pay off. I do a deeper review of SPD in this article.
Options For A Fast Crash (Within A Month)
A crash which happens in the span of a month (-25% in less than a month) can be hedged using a put spread which exploits the extra gamma short-dated options have over long dated options. The long puts will expire in about 30 days and their purchase should be financed by puts expiring in about 60 days. There should be more long puts than short puts, and the strikes of the long puts should be above the strikes of the short puts. Aim to have both sets of options reasonably OTM. Generally, one can get five longs and three shorts. Below is an example set up including the P/L with four different volatility assumptions.
Fast Crash Hedge (TD Ameritrade TOS)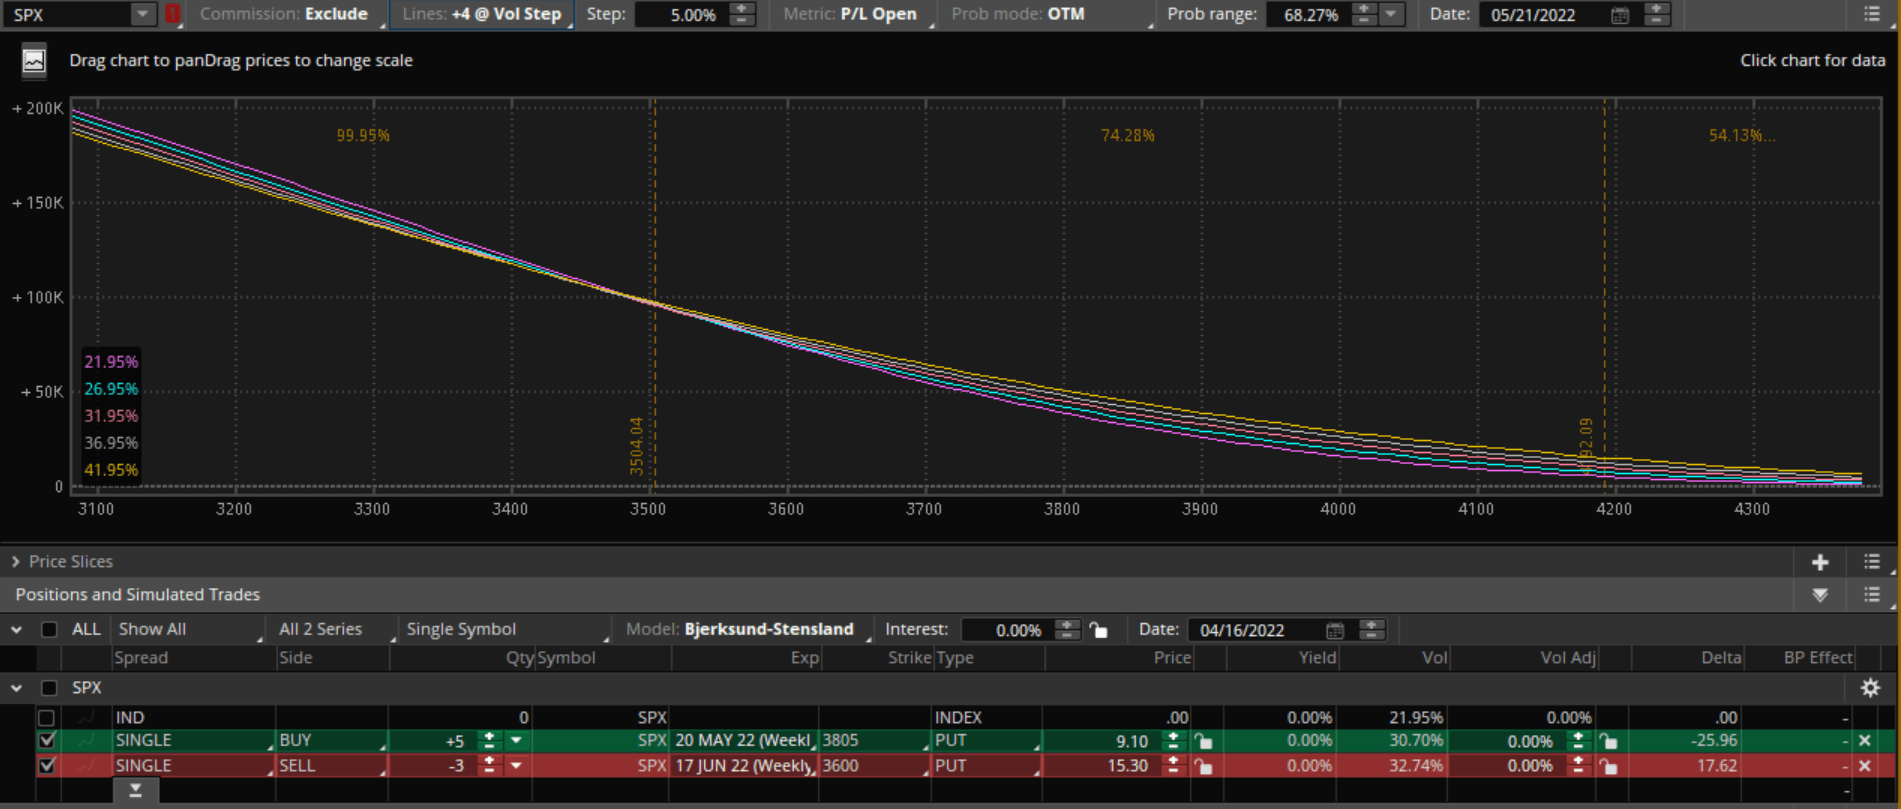
(Source: TD Ameritrade ThinkOrSwim)
The SPX is 4391 at the time of writing, there are five 32 DTE long puts with a 3805 strike, the three short puts are 60 DTE with a 3600 strike. The net credit for establishing this position is -5 x 910 + 3 x 1530 = 40. If the SPX falls 25% to a price of 3293 within the month, the total position P/L is between $140,000 and $150,000. The actual value depends on the implied volatility at the time. A total of 5 x 910 = 4550 was spent on the longs, which means this is effectively a 30-bagger: 140000 / 4550 = 30.77. Therefore, only a 0.85% allocation to the long puts are needed to fully protect against a 25% drawdown occurring within the month. Smaller accounts can use SPY options instead of SPX.
The risk of this trade is that the timing could be off such that the long puts are near expiry when the crash begins. This means the long puts will not offer much protection (options close to expiry have lower vega, so they are not as sensitive to volatility increases) while the short puts are still over a month from expiry at the start of a market crash. This risk can be mitigated by applying a tranche of this trade every two weeks. This way when the first tranche’s long puts are 15 DTE, another set of 30 DTE long puts are bought. When the first tranche’s long puts are 1 DTE, buy back the short puts and get another tranche. Over time, this would be expensive because you continue to buy back the short puts at 30 DTE while the long puts expire worthless, so even though the net entry credit was 0, there is a net debit to exit each tranche. Therefore, it is not advisable to do this trade unless the environment is such that a very fast crash is significantly more likely than normal.
Options For A Medium Length Crash (Within A Year)
A crash which happens in the span of a year (-35% within a year) can be hedged using longer term, far OTM puts. One can finance the OTM puts by selling put credit spreads with an ATM short strike. Below is an example set up with the P/L modeled with four different volatility assumptions. A 35% drop from the current 4391 is an index value of 2854.
Medium Length Crash Hedge (TD Ameritrade TOS)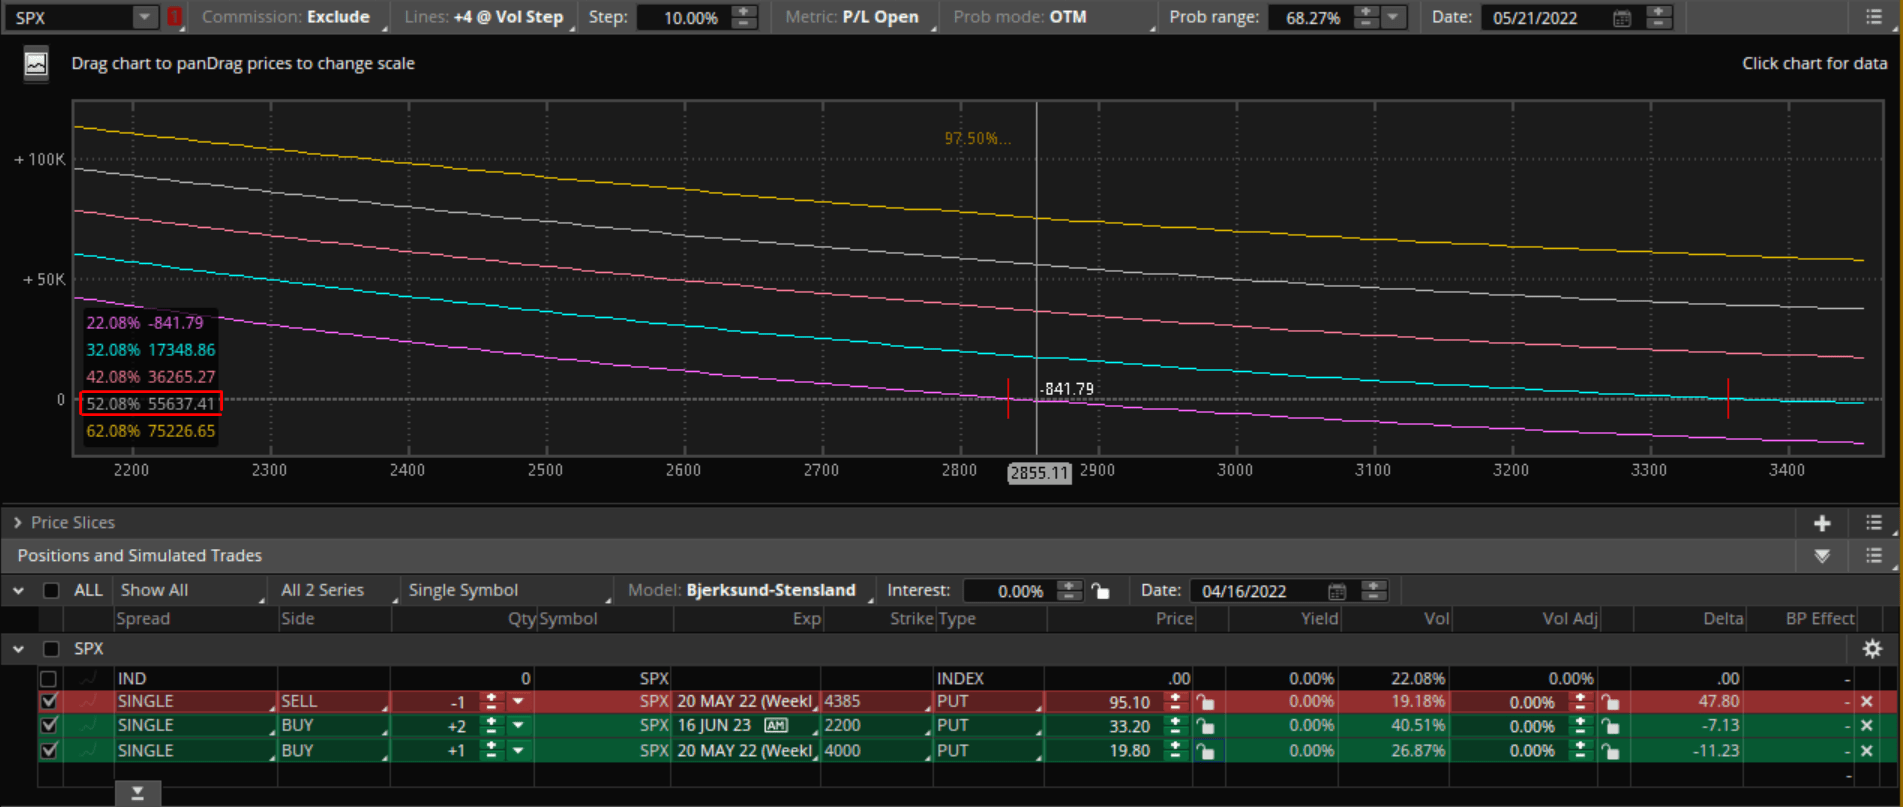
(Source: TD Ameritrade ThinkOrSwim)
The put credit spread involves selling a 32 DTE 4385 strike put and buying a 32 DTE 4000 strike put. This is then used to finance the purchase of two 50% OTM puts with 423 DTE. With this series, the net credit is 9510 – 1980 – 2 x 3320 = 890. Based on the chart above, assuming IV will be 52% after a 35% drop, this entire position will have a P/L of $55,637. The value of the far OTM puts was 6640, so they are net 8-baggers: 55637 / 6640 = 8.38.
The concept of tranches is again important here. Each month, a new put credit spread can finance the purchase of two more 50% OTM puts with +400 DTE. In three months, you would have an inventory of 6 puts each expiring in well over 300 days. If the market crashes at that point, expect the P/L figure from above to be much larger.
Clearly, this strategy requires more buildup than the last one because you are purchasing tranches of far OTM puts monthly. It is also less effective if there isn’t an existing inventory of long puts. The major risk of this strategy is that the market corrects 10% and then bounces back repeatedly. This would cause you to repeatedly realize the max loss on the put credit spread without ever allowing the hedging puts to be useful. A possible solution to this would be to roll the put credit spread at the exact same strikes so that when the market returns, you earn back more of the premium lost during the previous month. Note that with SPY puts, there is a very small chance of early exercise for ITM puts. Index options will not have this issue.
Variations of these strategies include adjusting the number, delta, and DTE of the far OTM puts. For example, it could be possible to buy more than two puts if the puts had less DTE. You can also adjust the distance between the strikes in the put credit spread to receive a greater credit to finance more puts. The point is that these strategies are a general idea which each investor can implement to fit his own preferences.
Options For High Volatility
Assuming the market is already drawn down 10%, you could still apply hedges with options. Insurance is more expensive at this point because of the elevated IV. However, increased IV is generally accompanied by a steeper IV skew. This means OTM puts are relatively more expensive than ATM puts, and this premium of OTM over ATM puts (in terms of IV) is higher than what it normally is. This makes put debit spreads very useful for hedging against short term downturns after an initial drop has occurred.
Options For A Long Crash (Lost Decade)
This is much harder to deal with because America has not had a lost decade since the aftermath of the Great Depression. Back then, America did not control the reserve currency and its economy was very different than the one it is today. I view the possibility of a lost decade as very unlikely as long as the reserve currency is still the USD. While global debt is denominated in dollars, the US can always get itself out of economic binds. Foreign investors will still invest in American securities because they have the highest credibility. If you are seriously worried about a lost decade in the US, consider international equities.
Exiting
Bulls make money, bears make money, pigs get slaughtered
– An old investing adage
When the market is down 30% and your total portfolio is flat, it is time to consider exiting hedges and buying equities. If your hedging turned a large market crash into a relatively small dip, it was successful. Waiting too long on options hedges in anticipation of the puts going even higher is problematic because volatility is naturally mean reverting. When the VIX is over 60, the conditional probability that it starts falling soon is very high. Often, volatility peaks right before the market bottoms. As volatility collapses, so will the value of the puts. At market bottoms, it is volatility which has the largest impact on the value of options, not the option’s closeness to being ITM. Therefore, you can definitely use the VIX as an indication to exit options hedges.
When the VIX futures curve is severely backwardated as shown below, it is usually a sign that markets have overreacted and that the bottom is near. Notice that the front month VIX future price is over 60.
VIX futures curve in Backwardation (vixcentral.com)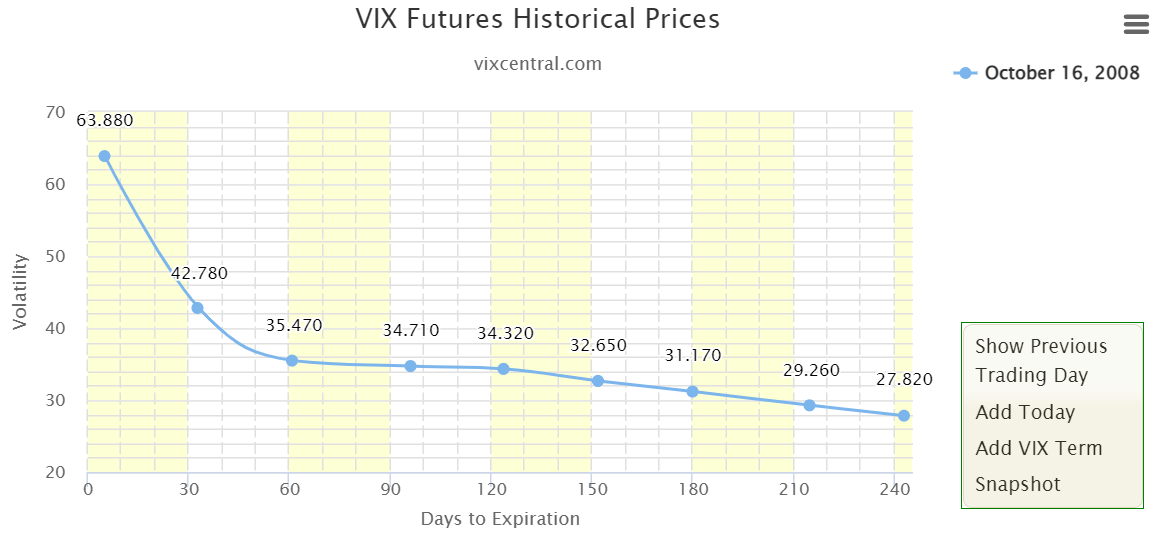
When exiting options hedges in this situation, it is safe to rotate some of the new liquidity into high beta stocks or even leveraged ETFs. At this point, the risk for them to continue selling off is much smaller. To play it safe, one could allocate 1/3 of the new liquidity into a 3x leveraged fund. This way, if you caught the bottom, the subsequent rally will be experienced as if you had bought in entirely. And if you did not catch the bottom, you still have 2/3 of the liquidity to buy in at a lower point. Either way, having the hedge means you are in a tremendously good spot.
If the hedges are stock holdings like VIRT, then one can simply rebalance the portfolio to pre-crash allocations between passive equity holdings and the holdings meant to be a hedge.
A Word About Selling Calls
Selling calls is a great source of income. But unless calls are sold ITM, they are not a hedge. Selling calls can also cut off the upside when markets bounce back from a drawdown. Furthermore, if any of the risk factors mentioned above suddenly received more clarity (for example, if we knew for a fact that the West would ease on Russian sanctions and allow existing supply lines to remain), the market will likely rally and short calls will be losing positions. Even with a yield curve inversion, the market still tends to rally quite a bit before the selloff begins. Don’t ditch passive index holdings over signs of higher risk. Similarly, don’t be so quick to sell calls against them indiscriminately. Have a plan to cut loss on a short call.
Conclusion
Risk is on. There are numerous factors in place which could trigger a market crash if a catalyst materializes soon. Inflation, de-globalization, elevated equity multiples, monetary policy, kinetic conflicts are all pointing towards a major downturn in US equities. The answer is almost never to sell. Instead, aim to hedge and hold on. My previous thoughts about hedging can be found here.
Be the first to comment