

Bet_Noire
Overview
Investors and speculators, both large and small, obviously crave that an easy-money policy regime will soon resume and turn a bear into a new bull.
All of this, however, does not jive the historical path. Wannabe bulls trot out memes and themes such as that post-midterm elections are followed by much higher prices within a year or two. A Santa Claus rally in December is practically a given fact, even though a contrary recent example shows the market plunged in Q4 2018 until Christmas Eve.
Rising interest rates do not always lead to down markets, and falling interest rates do not always turn markets up. Rising rates often accompany improving business activity and rising earnings and stock prices. Lower rates will also sometimes lead to lower stock prices, as has happened in the 2008-09 crash episode.
The following charts are from my Financial Market Bubbles & Crashes: Features, Causes & Effects, (Palgrave Macmillan, 3rd ed., 2021)
Bubbles & Crashes b ook Bubbles and crashes book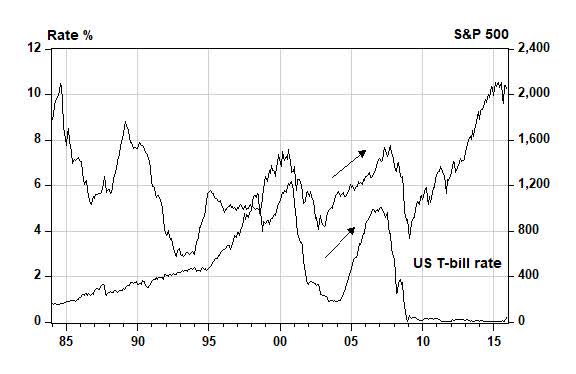
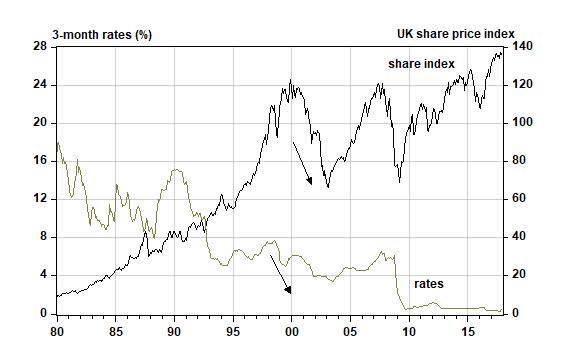
Rates and markets both go down, both go up. See arrows.
Indeed, as can be seen in the chart below, the Fed almost always follows and never leads. This time is not different.
Bubbles & crashes book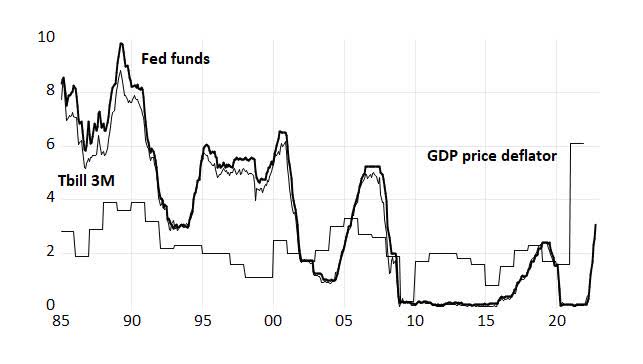
The Fed always follows
That Fed easy-money policies since 2010 have had a decreasing positive impact on GDP growth can be readily documented as since the 1980s, each marginal dollar of stimulus has resulted in a lesser boost to GDP growth. Most surprising is that the velocity of money as measured by the M2 series has, even with inflation included, declined so much and has barely risen off its 2020 bottom. All of this suggests that even should the Fed “pivot,” the impact on growth will likely be minimal.
Bubbles and crashes book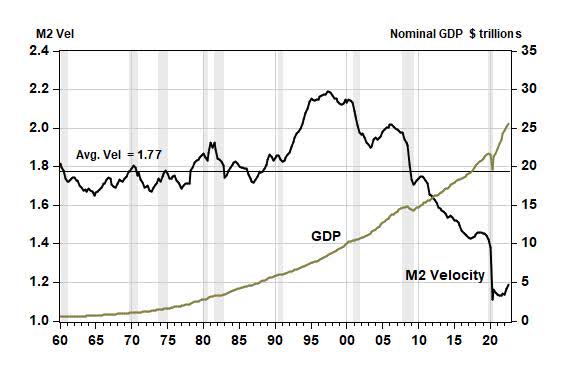
M2 velocity declines
Moreover, the Fed’s intended size-reduction of its balance sheet has hardly begun. If you look closely to the right side, there’s a tiny blip down to $8.7 trillion! If the Fed is serious about fighting inflation by shrinking its balance sheet, liquidity pressures on financial assets will persist and even grow.
Fed Reserve data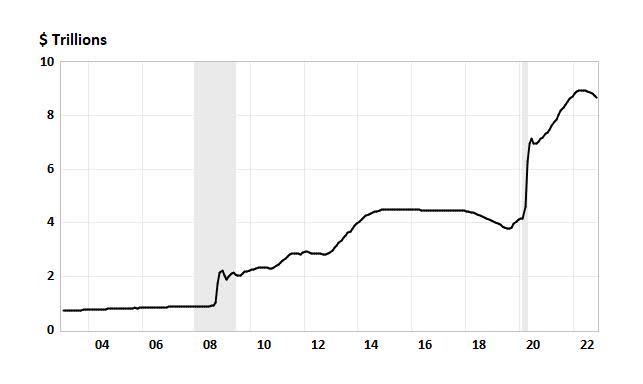
Fed balance sheet
Technical Considerations
Many forecasts for 2023 S&P 500 earnings appear to have come down to the $215 level. But the forecasting is still early and major corporations, especially in the tech sector, have all been recently announcing large-scale layoffs. Where are these thousands of until-now relatively well-paid people going to find lucrative new jobs over the next year? And will they continue to spend on goods and services at the same pace?
A reasonable guess is that they won’t. From a back-of-envelope guess, it seems that 2023 S&P earnings will probably fall far below $200. And given the continuing liquidity pressures from monetary and fiscal conditions and intentions, the market’s multiple will likely come down as well. Is an 18 multiple the right number? Who knows? But with earnings at $200, it suggests that the S&P index ought to be closer to 3,600 than 4,000. It also suggests that the ultimate price, say at a 15 multiple and/or an assumed higher multiple but lower earnings, can readily be computed for an S&P index to be closer to 3,000 next year.
Another market technical is indicated by the VIX fear gauge, which has thus far tended to range from the low 20s to low 30s. In a true end-of-bear market crash, the index ought to be well above 35 and more likely above 45. There is no sign yet that widespread fear and panic and “capitulation” has already occurred.
Plenty concerns remain. For instance, monetary contagion from the FTX crypto debacle has seemingly not yet spread widely. But it is hard to believe that so few larger banks, brokerages, and funds have not been significantly affected.
Also, optimism that a recession will be shallow and brief abounds. But the steepening yield curve inversion of the last month suggests that such optimism is probably misplaced, and that a recession may turn out to be deeper and longer than most prognosticators expect. The inversion seems now to be around 50 basis points and has been persistent.
The strong dollar-exchange rate affects the markets too, but with differing implications for the short-term and the long-term. Dollar strength reduces exports and growth but primarily over the long term through trade. American export companies will experience an earnings growth headwind from this. But foreign speculators betting on a steady to rising market for American equities will earn a return from a dollar rising even if stock prices trend sideways. And this leads to short-term support for the S&P index. But whenever the Fed finally “pivots” and thereby weakens the dollar-exchange rate, the short-term buying is likely to become short-term selling even though corporate earnings will benefit from lower interest rates and greater exports in a year or two.
In the broader economy, consumers are being pinched by higher gas and food prices and are as a result, bumping up their credit-card balances. Over the last year or so, credit-card borrowing has jumped from around $800 billion to $1 trillion while delinquencies are rising noticeably. This might delay an immediate economic decline over the short run, but it has negative implications over the long run, that is, into 2023-24.
Conclusion
The market still appears to be driven by buy-the-dip fear-of-missing out (FOMO) on a bull move. As I’ve written in my Bubbles and Crashes book, at the true bottom, there’s FOSI – fear of staying in! No evidence of FOSI yet. The FOMO to FOSI ratio remains high for both the general public and institutions.
The next few months are thus, in my opinion, unlikely to resolve into a positive case for equity investments.
Stay bearish.
Be the first to comment