

sommart
There is an inherent tradeoff between quality and value, and different investors lean one way or the other. However, I think there is a better way to solve the debate than mere preference.
The answer lies in the marginal cost of quality, which can be deciphered through kurtosis. I will explain precisely what I mean by this in a bit, but to get a quick illustration, consider 2 home-buying scenarios.
- You can get a basic house for $300,000 or a slightly bigger basic house for $400,000.
- You can get a basic house for $300,000 or a luxury mansion for $400,000.
The difference between these is the marginal cost of quality. In the first scenario, the marginal cost of quality is high; you only get a slight upgrade per unit of extra cost. In the second scenario, the marginal cost of quality is low; you get a massive increase to quality relative to the extra cost.
Clearly, one should be more willing to upgrade in the second scenario.
The exact same logic can be applied to investing. So, rather than consistently preferring value or consistently preferring quality, I propose taking continuous measurements of the marginal cost of quality within the market. When quality upgrades come cheaply, one should trade into quality stocks, and when quality upgrades are expensive, consider moving back toward value.
So how can one measure the marginal cost of quality in investment?
Kurtosis – the 4th moment of distribution.
- Mean
- Variance
- Skewness
- Kurtosis
It refers to the tail-edness of a distribution, or essentially the shape of the bell curve. Mesokurtic refers to a normal bell curve while a leptokurtic distribution has a high center and skinny tails. Platykurtic is the opposite. Visually, they look like the following.
Medical dictionary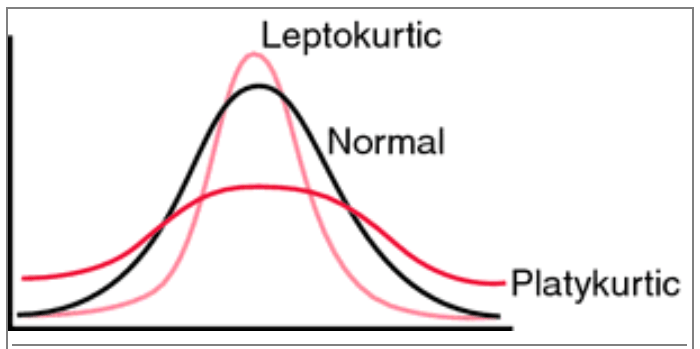
For our purposes, we will be looking at the distribution of valuation among stocks or more specifically real estate investment trusts (“REITs”) since that is our area of focus.
The basic framework of the analysis
While the market is far from efficient, higher-quality stocks will generally trade at higher multiples. The question is how much higher of a multiple one has to pay to get the higher quality stock. If one follows a consistent universe of stocks, the quality difference between them will be largely static. Sure, individual companies could improve in quality relative to other companies, but at any given time there is going to be a range from low quality to high quality, and these stocks will roughly trade at a range of low valuation to high valuation.
So, by taking note of how many stocks trade at each level of valuation (earnings multiple), one can measure how much extra they have to pay to upgrade in quality. Below, we have graphed the number of REITs trading at each funds from operations (“FFO”) multiple (a common earnings metric for REITs).
Portfolio Income Solutions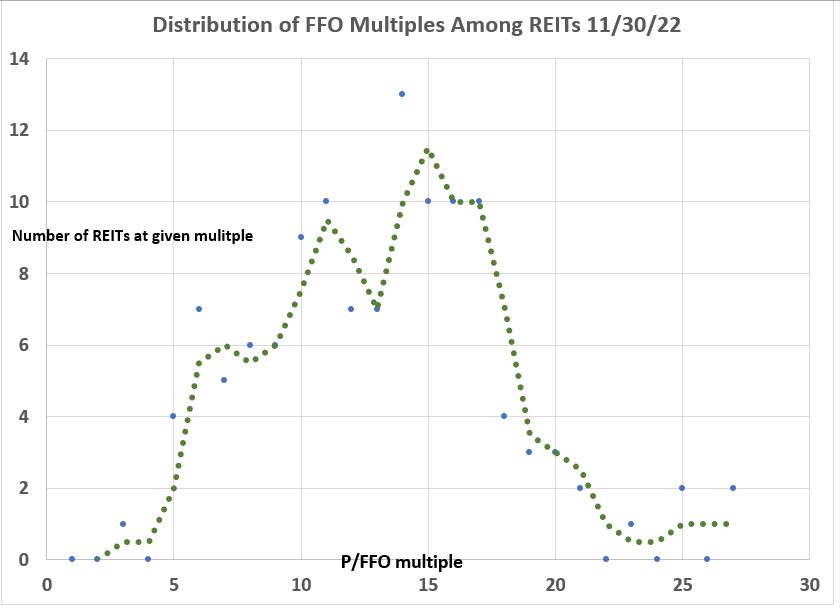
There are 129 equity REITs that have a consensus 2023 FFO estimate from which we can derive their FFO multiple using today’s price.
The most common multiple right now is 14X FFO, and 13 different REITs trade at that level. The overall distribution of FFO multiples among REITs forms a sort of bell curve. It is the kurtosis of this bell curve that determines how expensive it is to upgrade in quality.
Compared to REIT history, the above bell curve is slightly on the leptokurtic side, indicating that it is relatively cheaper than normal to upgrade in quality.
If we rank REITs by quality and assume the market is efficient enough that higher-quality stocks are more expensive, we can see how expensive each percentile rank of quality is.
As of the time of this writing:
- 25th percentile quality has a 9X earnings multiple.
- 50th percentile has a 13X multiple.
- 75th percentile has a 16X multiple.
So, to upgrade from a 25th percentile stock to a 75th percentile quality stock, one has to pay an extra 7 turns. Whether or not that is a good deal is hard to tell from a snapshot, so we measure continuously over a long period of time to get context.
Measuring over time
What we are really looking for here is whether 7 turns is a cheap price to pay to upgrade from 25th percentile to 75th percentile, and that can be answered by comparing it to a similar upgrade in previous time periods.
I have been running this kurtosis analysis since February 2016 and have archived each kurtosis chart in the REIT University section of Portfolio Income Solutions. There are a couple of charts that I want to look at today.
Compare this to when we ran the same analysis 1 year ago.
2MCAC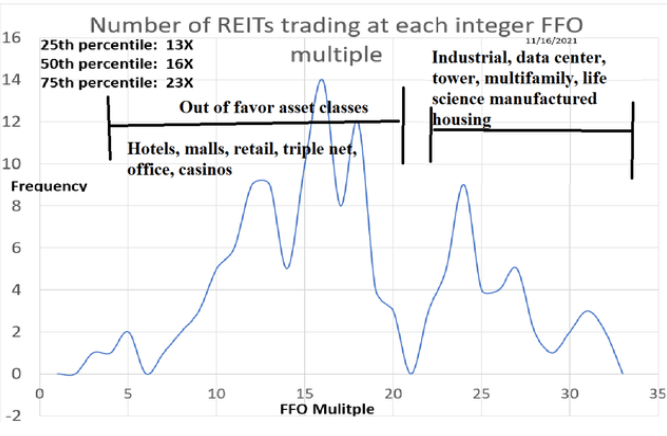
Near the end of 2021, the 25th percentile cost a 13X multiple and the 75th percentile cost 23X.
So, not only have REITs broadly gotten cheaper with multiples coming down substantially, but the marginal cost of quality has decreased.
A year ago, one had to pay 10 extra turns (23 multiple instead of 13) to upgrade from 25th percentile quality to 75th percentile.
Today, one only has to pay 7 extra turns.
The most expensive I have ever seen the marginal cost of quality was in May 2017, when the bell curve went completely platykurtic, losing its peak entirely and having the meat of its curve extend from 8X FFO all the way out to 21X.
Portfolio Income Solutions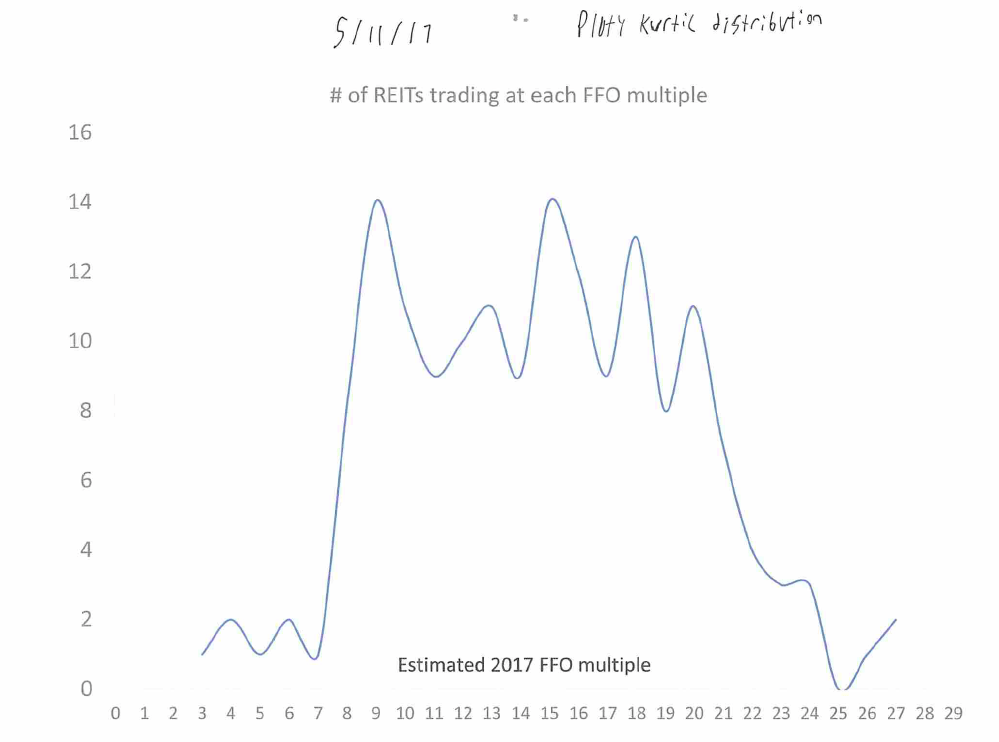
That was an ideal time to trade hard into value.
Today, the curve is far more leptokurtic, making the marginal cost of quality low. It is not quite the scenario of upgrading a basic home to a luxury mansion for just $100,000, but it is getting closer to that. This is probably a great time to upgrade in quality.
How to upgrade
If one believes the market is reasonably efficient, they could upgrade in quality simply by buying higher multiple stocks. As you know, I think the market is extremely inefficient, so I would not suggest buying expensive for the sake of expensive.
Instead, I think the quality upgrade can be done in a much more tactical fashion such that you can get significant increases to quality at only slight increases to cost.
Intra-sector versus inter-sector
Presently, there is quite a bit of variance to price within sectors. If you open up the industrial sector, for example, Plymouth Industrial (PLYM) trades at 11.2X 2023 FFO while Americold (COLD) trades at 31.3X 2023 FFO.
S&P Global Market Intelligence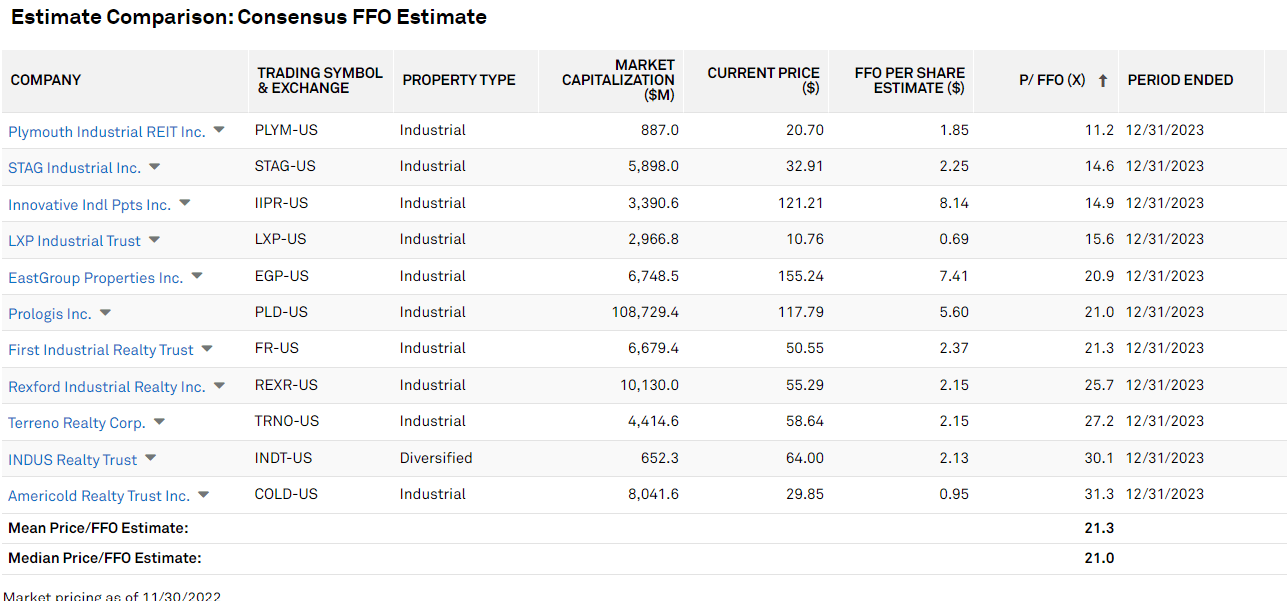
That is a massive intra-sector valuation spread.
Similarly, wide intra-sector valuation spreads are quite prevalent right now, with the median intra-sector spread being 10.9 turns on FFO/share multiple.
2MC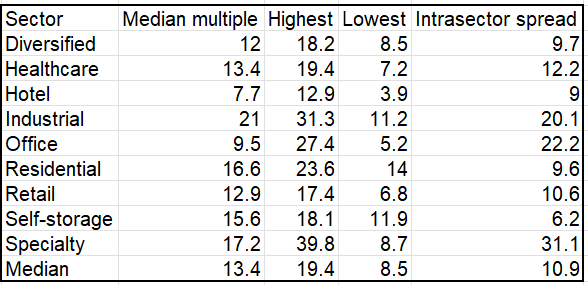
In contrast, the multiple spread between sectors has tightened considerably. Last year, the premium sectors traded as much as 20 turns higher than the disliked sectors.
Today, the favored sectors are only slightly more expensive than the out of favor.
Thus, I posit that the ideal way to position in this environment is to trade up in quality at a sector level and then capture better value within sectors.
- Upgrading sector quality has a low marginal cost.
- Upgrading quality within a sector has a high marginal cost.
As such, I have positioned 2CHYP, the Portfolio Income Solutions portfolio, to be more heavily weighted to stronger, growthier sectors while maintaining a high cashflow yield by capturing value within sectors.
Plymouth and STAG Industrial (STAG) are only slightly lower in quality than the likes of Terreno (TRNO) and Americold, (slightly lower growth rate), but you are getting them at less than half the price per unit of earnings.
I think healthcare is going to be a strong sector going forward, as Covid cost headwinds subside and it, too, has a large intra-sector valuation spread.
Welltower (WELL) trades at 19.4X 2023 FFO, while Medical Properties Trust (MPW) trades at 7.2X.
S&P Global Market Intelligence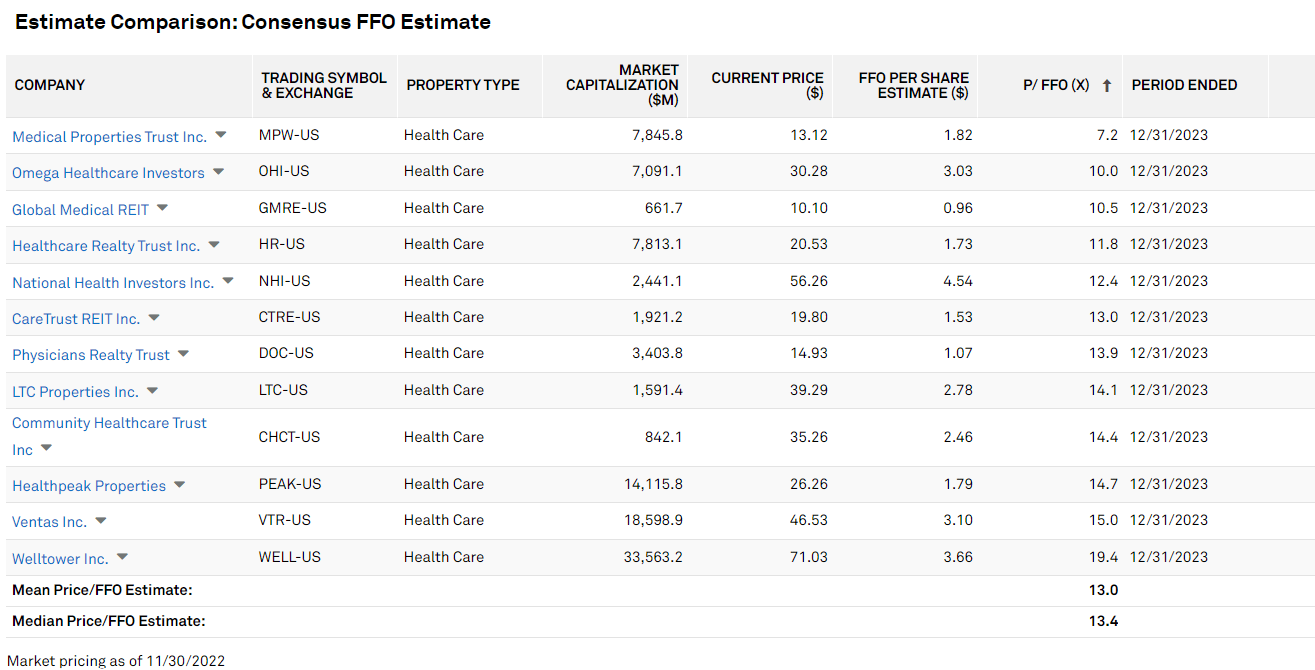
The magnitude of the gap implies that there is a massive difference in quality, and I just don’t think that is the case. They are both well-run companies with strong assets. MPW is a bit higher leverage, so that is a hit against it, but its growth has been far superior.
I think in the long run their multiples will converge, so I am happy to grab substantially more value at only a very small sacrifice in quality.
Putting it together
In the investment world, quality and value are presented as preferences. Money managers identify themselves as growth investors (which would be akin to quality) or value investors.
If one takes a deeper look at the marginal cost, however, I think there is significant evidence that it behooves an investor to strategically switch between quality and value depending on the environment.
Presently, the marginal cost of quality is fairly low, so it is a good time to upgrade quality. Inefficiencies in the market pricing of individual stocks provide great opportunities to obtain a superior mix of quality and value.
Be the first to comment