

RomoloTavani/iStock via Getty Images
The job report was much better than expected. Wage growth y/y was hotter than expected, and last month’s wage growth was revised higher. This is helping to push yields and the dollar higher and, based on current trends, should pressure equity prices lower in time.
Fed Fund Futures are again moving higher as well, with the terminal rate now seen in April 2023 at almost 3.6%, which is up nearly ten bps today.
Bloomberg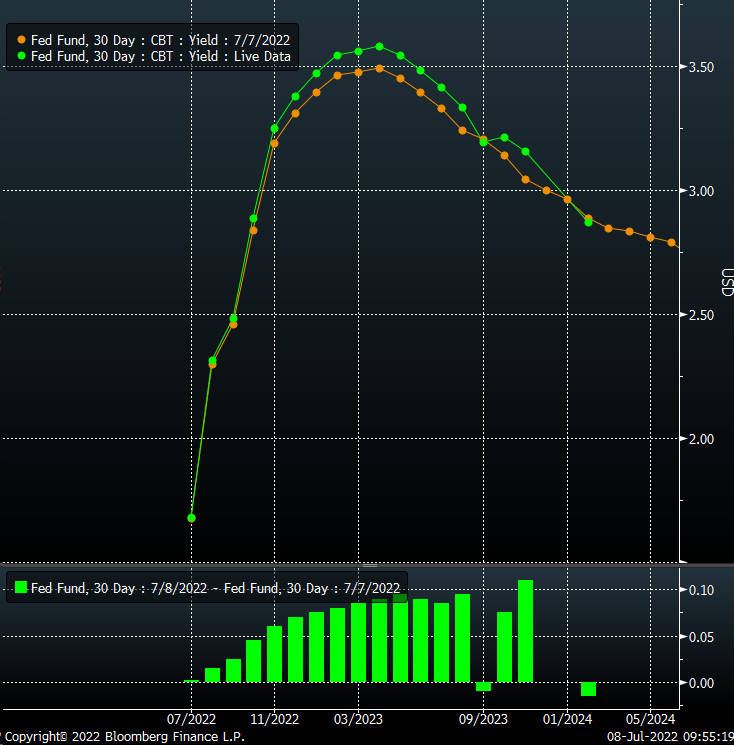
Wage growth is a hot topic, suggesting that wage pressures are still elevated and show little signs of abating. Wage growth has been consistently around or above 5% since September 2021. Since March 2007, the average y/y wage growth has been around the 3% mark, and at this point, the average hourly wage growth on a y/y basis is running more than two standard deviations above that average.
Bloomberg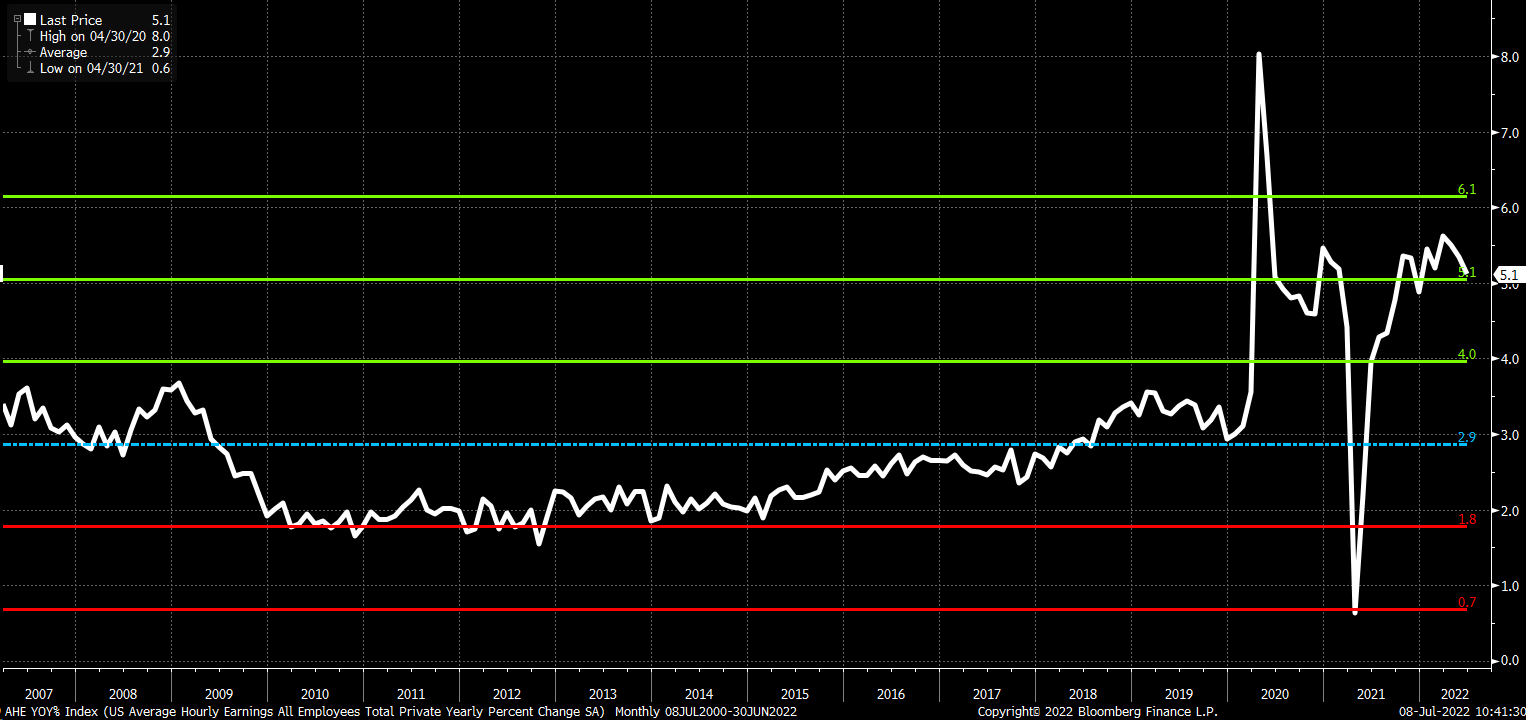
Markets Respond
The strong wage growth has sent the Treasury curve sharply higher as well. Interestingly, the most significant changes in the curve are happening at the front of the curve. The one and two-month rates are climbing the most, as the market is repricing due to the increased odds of a 75 bps rate hike in July and the potential for another 50 bps to even 75 bps rate hike in September.
Bloomberg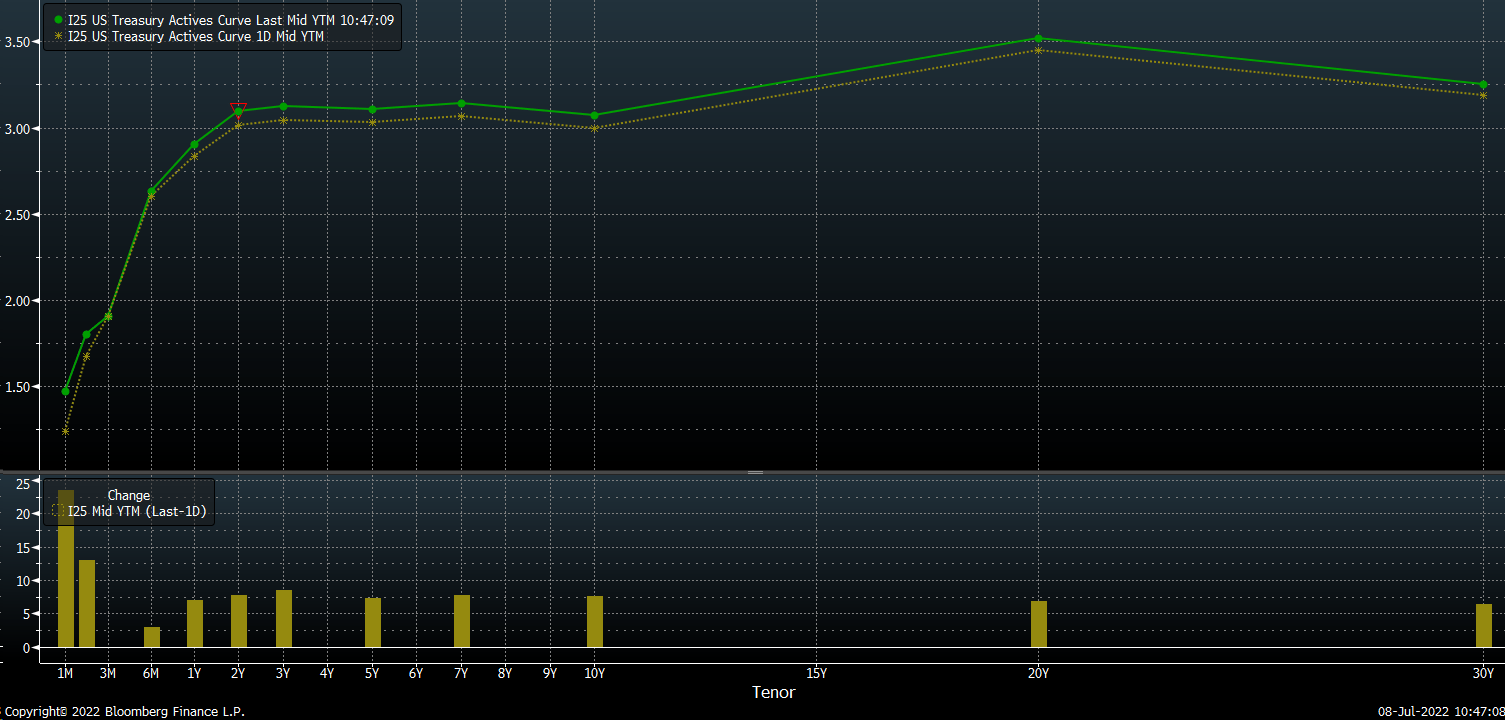
The CME FOMC watch tool now puts the odds of rates rising in September by 50 bps to 71% and 75 bps to 28%. The 75 bps rate hike for the September meeting rose dramatically following the employment report, from just 15.5% the day prior.
CME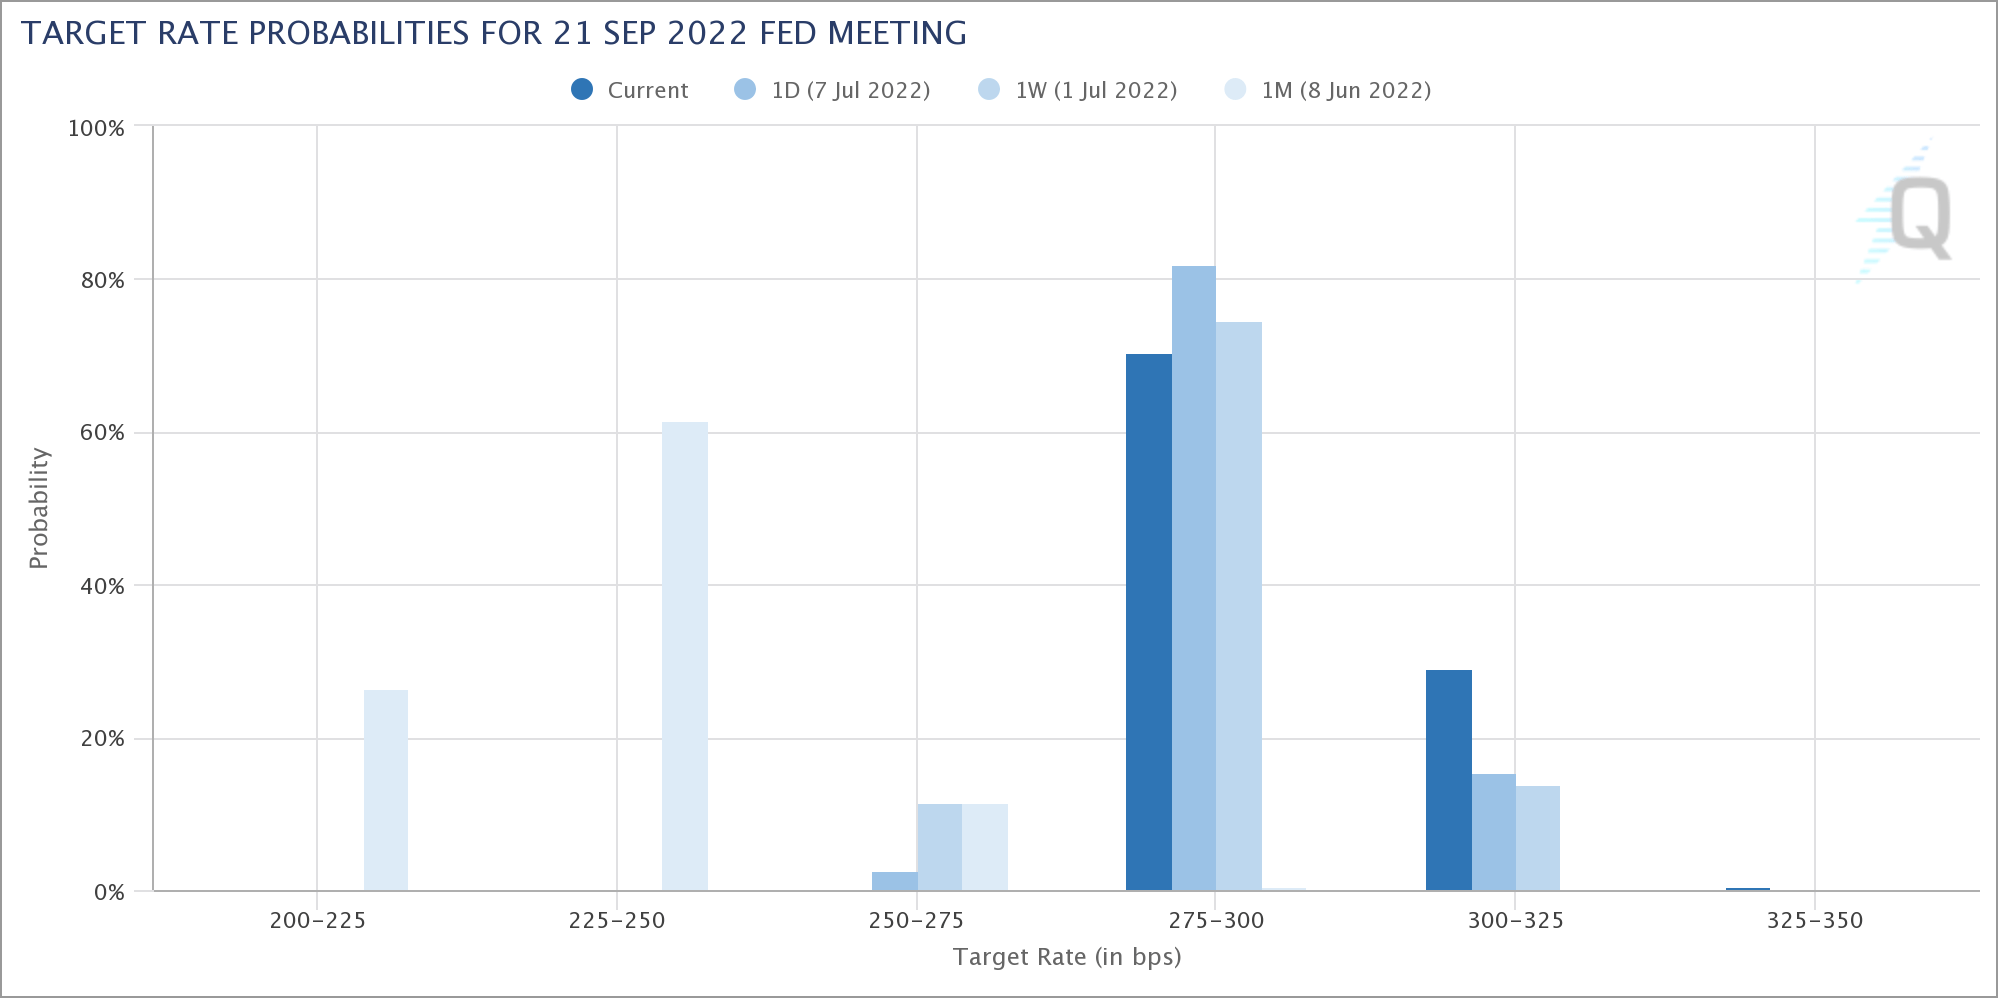
Meanwhile, the odds of a 75 bps rate hike in July seem inevitable based on the market pricing, at more than 95%. The odds for a possible 100 bps rate hike are rising at the July meeting, at around 4%. It will put a lot of extra attention on the CPI report next Wednesday. Estimates are for CPI y/y to climb by 8.8%. A hotter number could increase the odds of a 100 bps rate hike in July or another 75 bps rate hike in September. UBS had a note this week calling for CPI to rise by 9% in July.
CME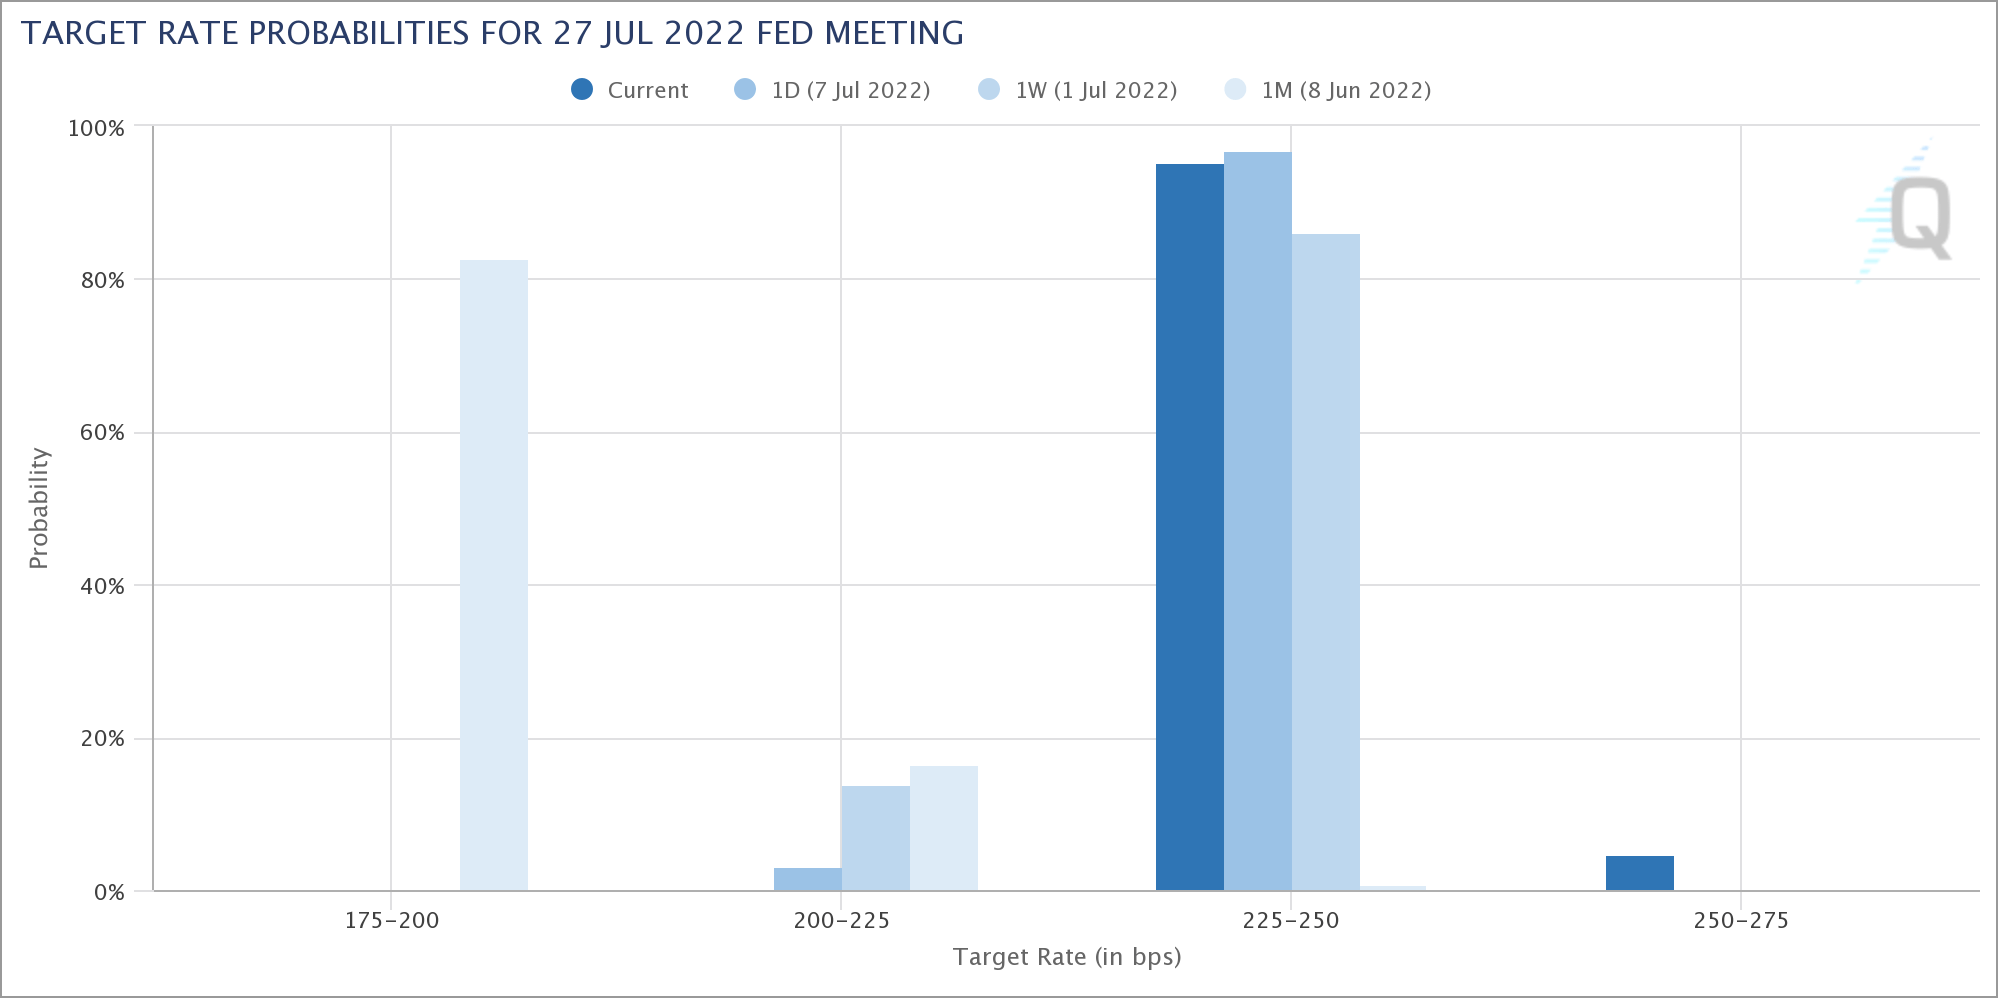
Equities Continue To Live In A Fantasy
Equity prices may be flat today, but the reasoning remains mechanical and has decoupled from rate changes. Real rates are very close to their cycle highs again, as noted by the iShares TIPS Bond ETF (TIP), which is very close to its recent lows. The NASDAQ 100 ETF (QQQ) and the TIP ETF have had a very tight relationship since the winter of 2018, and the recent decoupling is inconsistent with that trend. The two can decouple for some time, but a retest of the lows of the TIP ETF suggests there should be a retest of the QQQ ETF in the coming days.
TradingView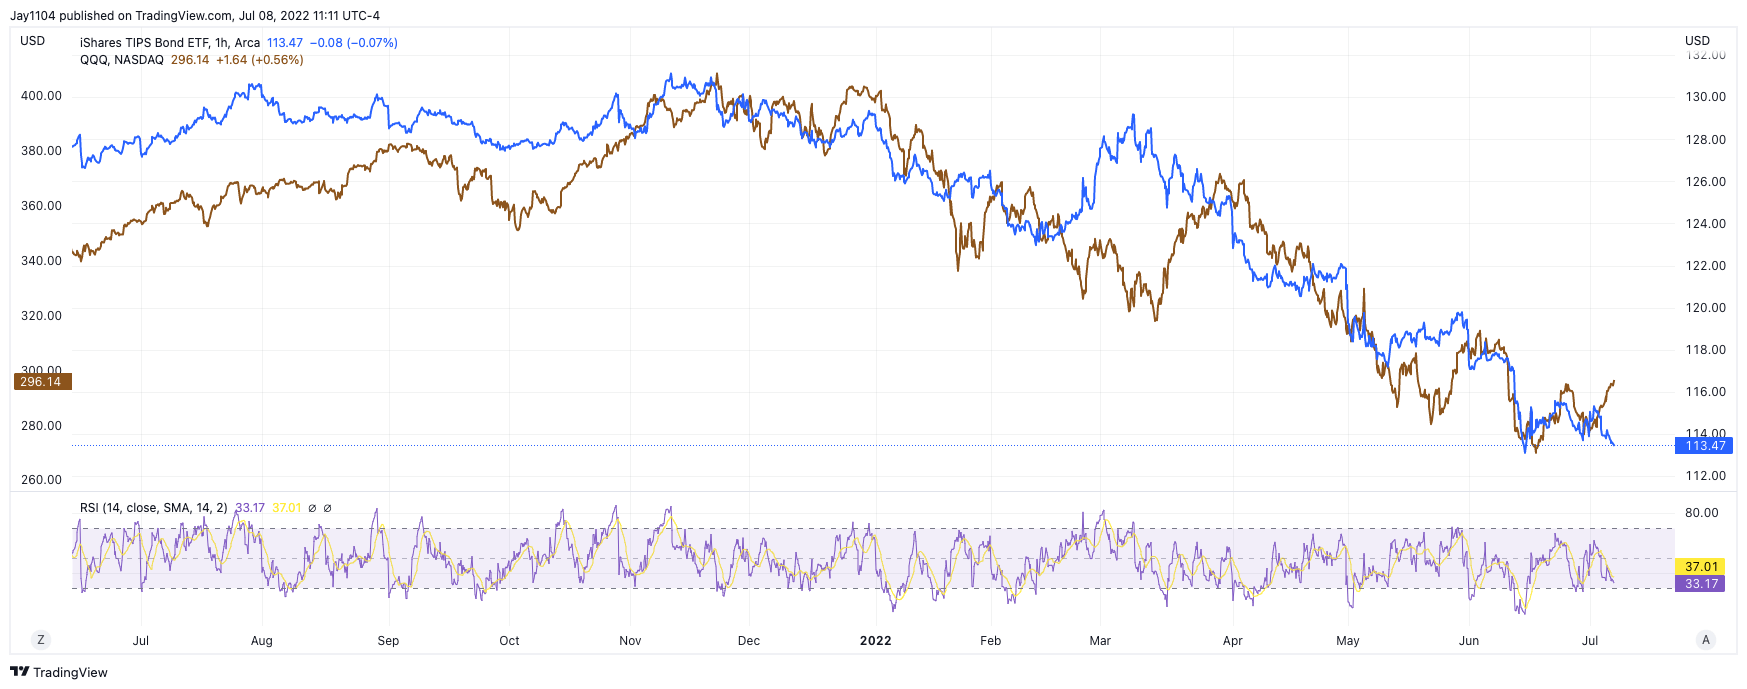
The rally in the market continues to be led by declining levels of implied volatility, which is more of a mechanical reason for the support in the equity market and not a fundamental reason. At this point, the fundamentals are bearish for equity prices and driven by higher rates, a stronger dollar, and the potential for more rate hikes. Ultimately, the fundamental forces should prevail and could result in significant damage once the CPI report comes into focus and implied volatility begins to rise again.
The implied volatility levels for S&P 500 have moved down to around 16.5% for the S&P 500 as of July 8, versus a level of 22.4% on July 6, for the July 11 expiration date.
Bloomberg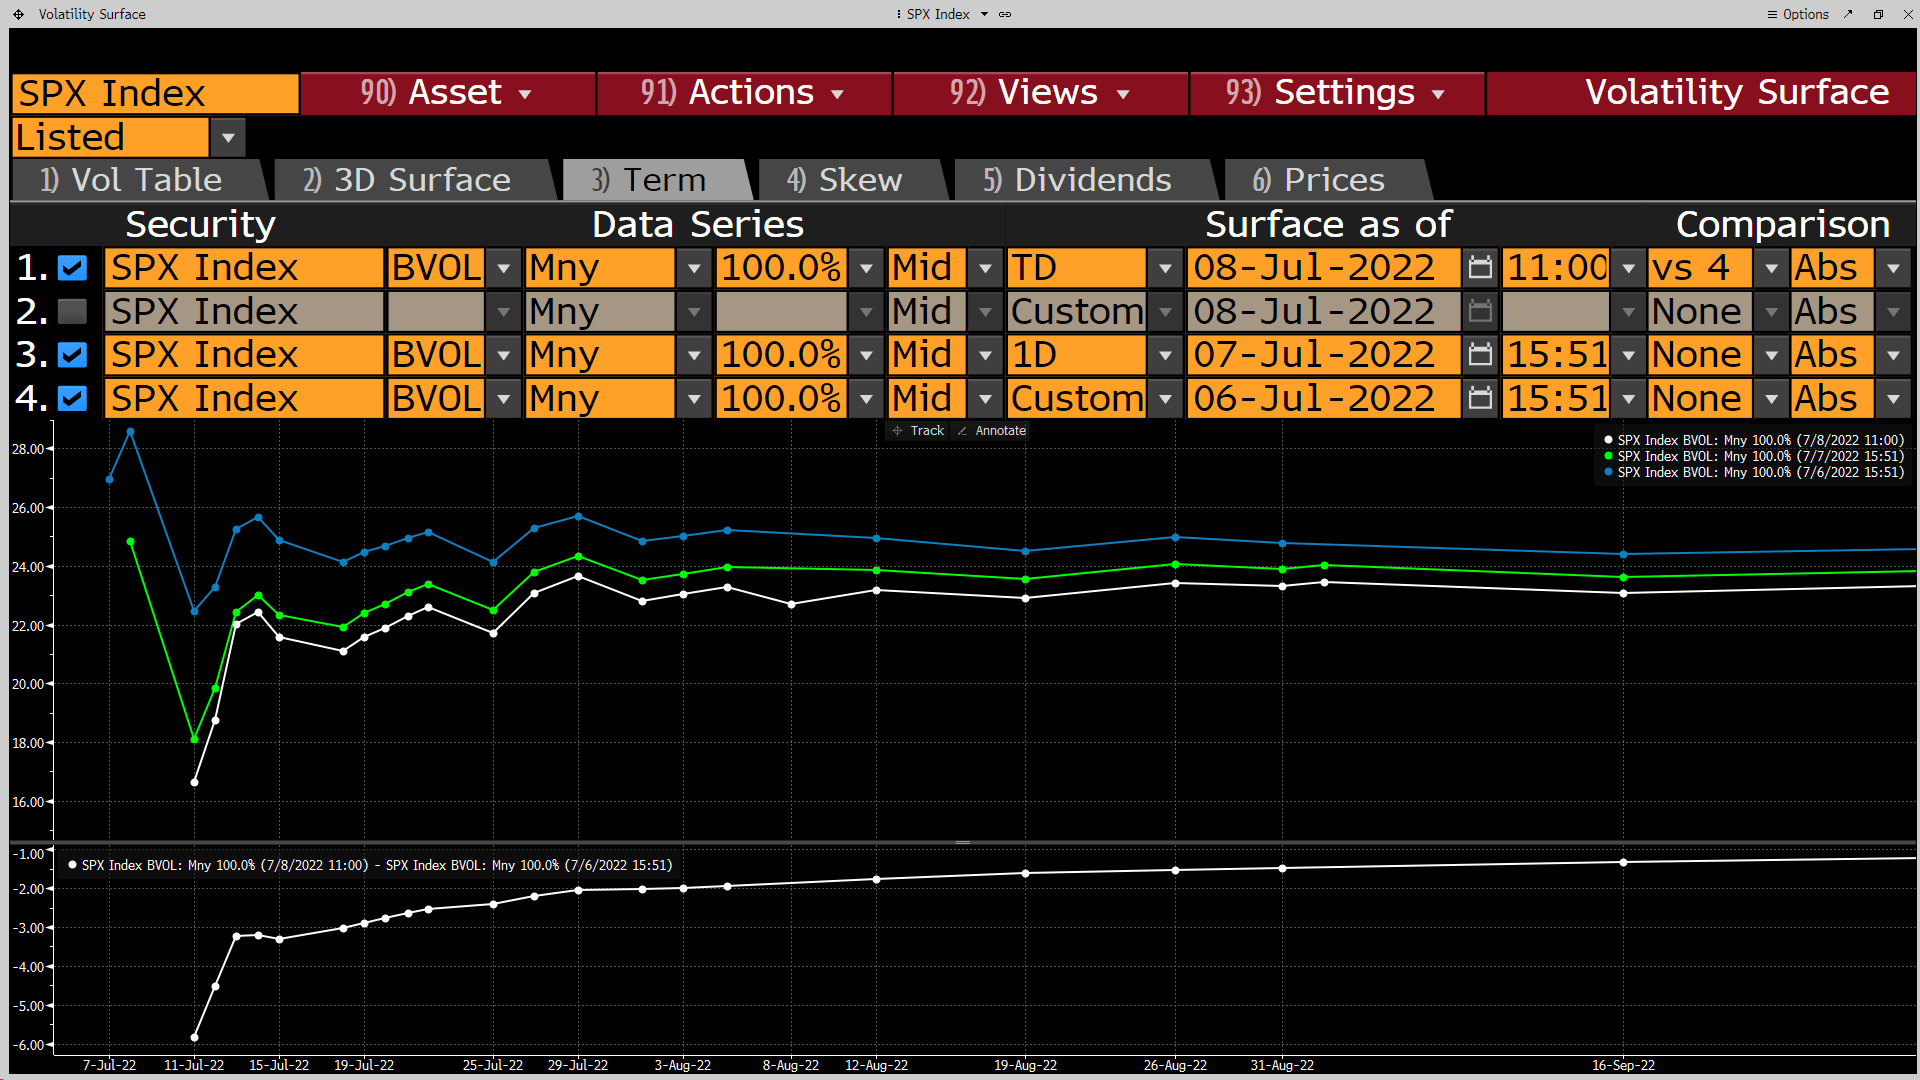
Ultimately, rising real yields will work against the equity market, and the more the market prices in rate hikes, the higher real yields will increase. This will help to drag the earnings yield of the NASDAQ and the S&P 500 higher, pushing the P/E ratio of the index lowers.
Bloomberg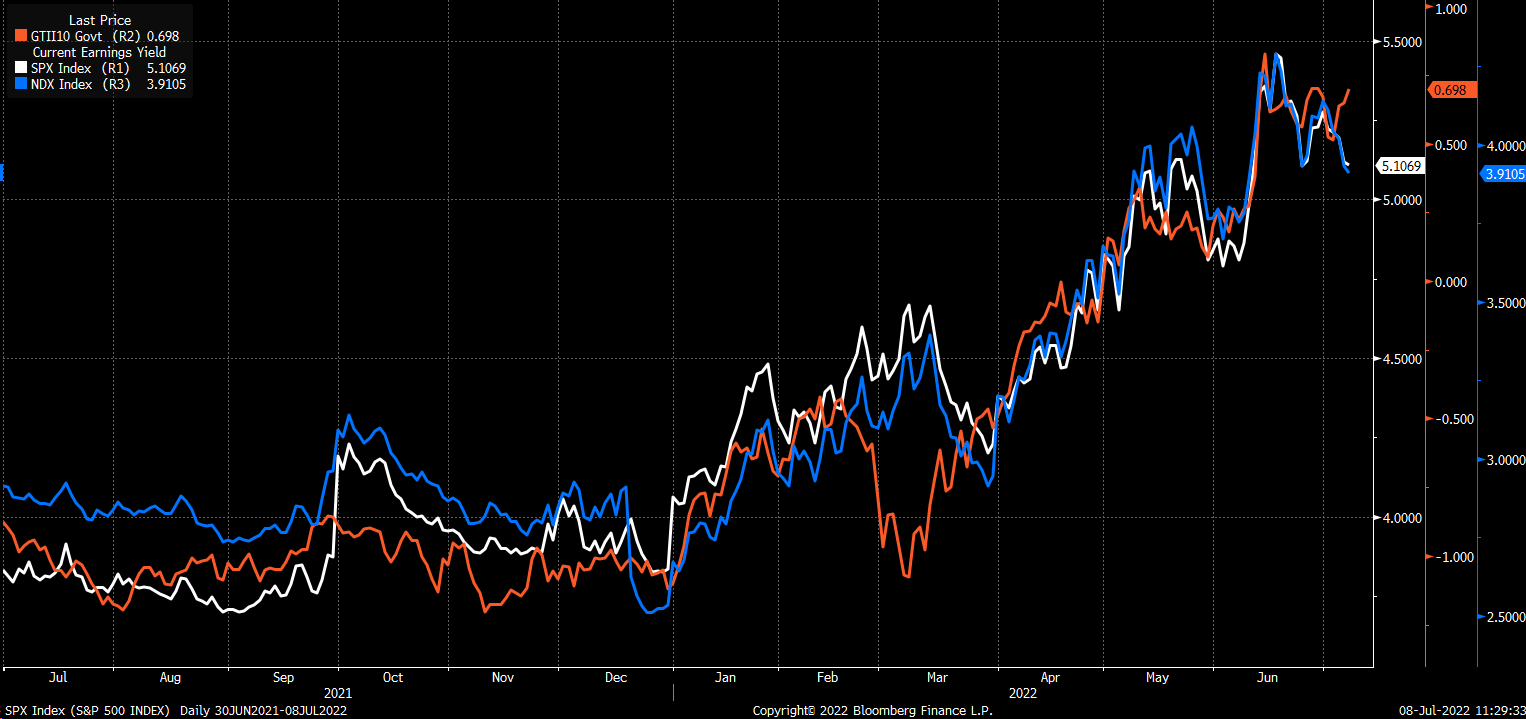
The wage data today is not going in the desired direction. It appears to almost be sticky at this point, with wage growth north of 5% for what is quickly approaching a year. The data shows it will take more work on the Fed’s part to slow the economy to the point that wages pressure begins to ease, and at this point, the jobs data does not show that happening.
Join Reading The Markets Risk-Free With A Two-Week Trial!
Investing today is more complex than ever. With stocks rising and falling on very little news while doing the opposite of what seems logical. Reading the Markets helps readers cut through all the noise delivering stock ideas and market updates, looking for opportunities.
We use a repeated and detailed process of watching the fundamental trends, technical charts, and options trading data. The process helps isolate and determine where a stock, sector, or market may be heading over various time frames.
To Find Out More Visit Our Home Page

Be the first to comment