undefined undefined/iStock via Getty Images
Will supply chain issues outlast the pandemic? The latest Economic Report to the President thinks so.
The report dedicates one of its seven chapters to supply chains, noting that the once-esoteric subject “entered dinner-table conversations” in 2021. In recent decades, Ms. Rouse and the report’s other authors write, U.S. manufacturers have increasingly relied on parts produced in low-cost countries, especially China, a practice known as offshoring. At the same time, companies have adopted just-in-time production strategies that minimize the parts and materials they keep in inventory.
The result, the authors argue, are supply chains that are efficient but brittle — vulnerable to breaking down in the face of a pandemic, a war or a natural disaster.
“Because of outsourcing, offshoring and insufficient investment in resilience, many supply chains have become complex and fragile,” they write, adding: “This evolution has also been driven by shortsighted assumptions about cost reduction that have ignored important costs that are hard to turn into financial measures, or that spilled over to affect others.”
At the start of the pandemic, governments shut down manufacturing to contain the outbreak. This restricted supply. At the same time, they increased fiscal policy to support consumers, who then went on a spending spree. But they changed the composition of purchases, buying more durable and non-durable goods at the expense of services. This further taxed manufacturing resources. Next, the pandemic reallocated shipping resources, further stretching supply lines. Finally, there are now strong geopolitical cross-currents impacting the thinking about the location of manufacturing.
So, yes, it will take some time to figure this out.
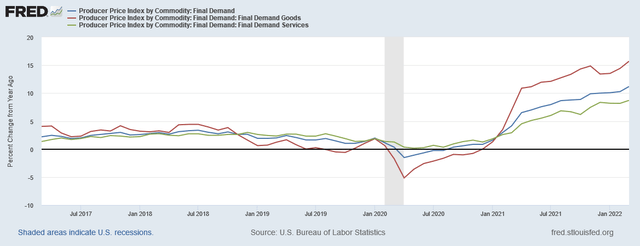
PPI is rising at a strong clip:
The Producer Price Index for final demand increased 1.4 percent in March, seasonally adjusted, the U.S. Bureau of Labor Statistics reported today. This rise followed advances of 0.9 percent in February and 1.2 percent in January. (See table A.) On an unadjusted basis, final demand prices moved up 11.2 percent for the 12 months ended in March, the largest increase since 12-month data were first calculated in November 2010.
Here’s the chart:
Three PPI indexes (total in blue; goods in red; services in green) are rising at some of the strongest rates in decades.
Wind power surpassed coal in total power generation recently:
Wind turbines in the U.S. produced more electricity than coal or nuclear plants on March 29 for the first time on record, the U.S. Energy Information Administration said Thursday. That made wind the second-biggest source of electricity that day, behind only natural gas and narrowly ahead of nuclear.
This will eventually create downward pressure on coal prices.
Today, let’s take a look at three primary index-tracking ETFs (the SPY, QQQ, and IWM) but look at their internals as represented by the EMA picture of their latest sectors.
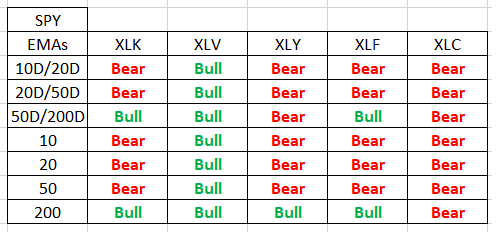
EMA composition of 5 largest SPY sectors from left to right (Data from StockCharts)
(Here are the sector percentages)
Of the 35 cells, 23 are bearish.
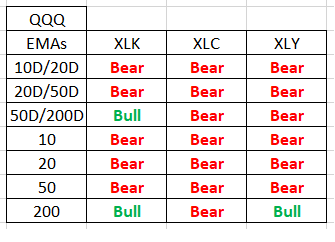
QQQ three largest sectors left to right (StockCharts )
(Here are the sector percentages. The three largest sectors are over 70% of the QQQ). 18 of 21 cells are bearish.
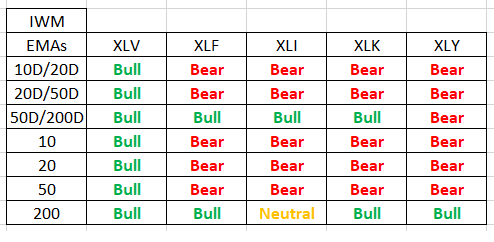
IWM 5 largest sectors left to right (StockCharts)
(Here’s a link to the IWM’s five largest sectors)
On the IWM 21 of 35 cells are bearish.
If we think of the above data as the scaffolding of each index, then the only conclusion is that, internally, the tone is bearish.


Be the first to comment