

Key Talking Points:
- FTSE 100 struggles to get back above key trendline
- BoE hawkishness could hinder FTSE performance in short-term
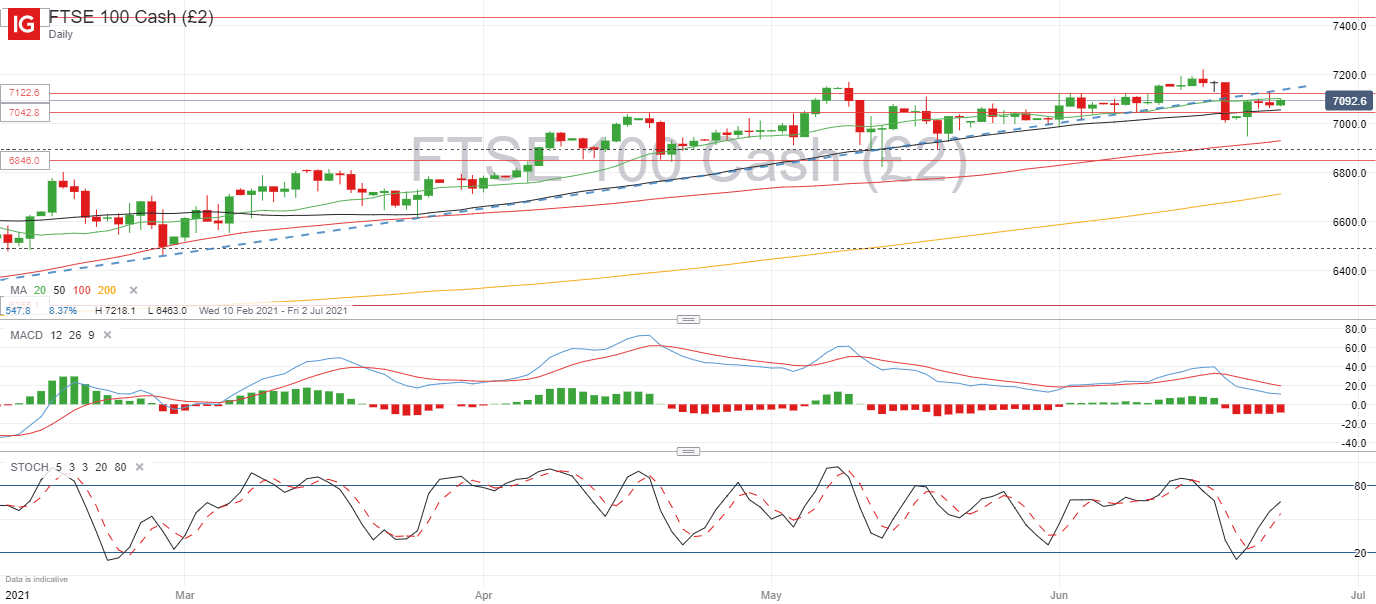
The FTSE 100 is struggling to regain its footing above 7,000 after last week’s pullback. A more hawkish Federal Reserve was the main reason for the equity selloff seen on Friday, which saw the UK index dip below 6,950 for the first time since May 19th. This pullback also meant the FTSE 100 broke some significant levels, which is making it harder for buyers to bring its rice higher again. The most important breach was the index dropping below the ascending trendline which had been in place since February 1st. Whilst it isn’t the first time the FTSE 100 has traded below this line, it is the first time it has dropped below for more than one session, meaning it is now acting as resistance for buyers.
FTSE 100 Daily Chart
The focus now will be on the Bank of England (BoE) meeting later today which could potentially offer some renewed weakness in the FTSE 100 if policy members come off as more hawkish than usual, which would allow the Pound to pick up bullish momentum, hindering domestic stocks.
Other than that, there is little left in terms of economic events for the UK this week, so it’s likely that the FTSE will move in tandem with US equities if the BoE provides little guidance for the coming weeks. With regards to Brexit, there continues to be a feeling of loss with regards to the latest EU-UK trade deal, especially for Irish fishermen. There is an overall lack of enthusiasm and the feeling that both parties have been left worst off than before Brexit.
FTSE 100 Weekly chart
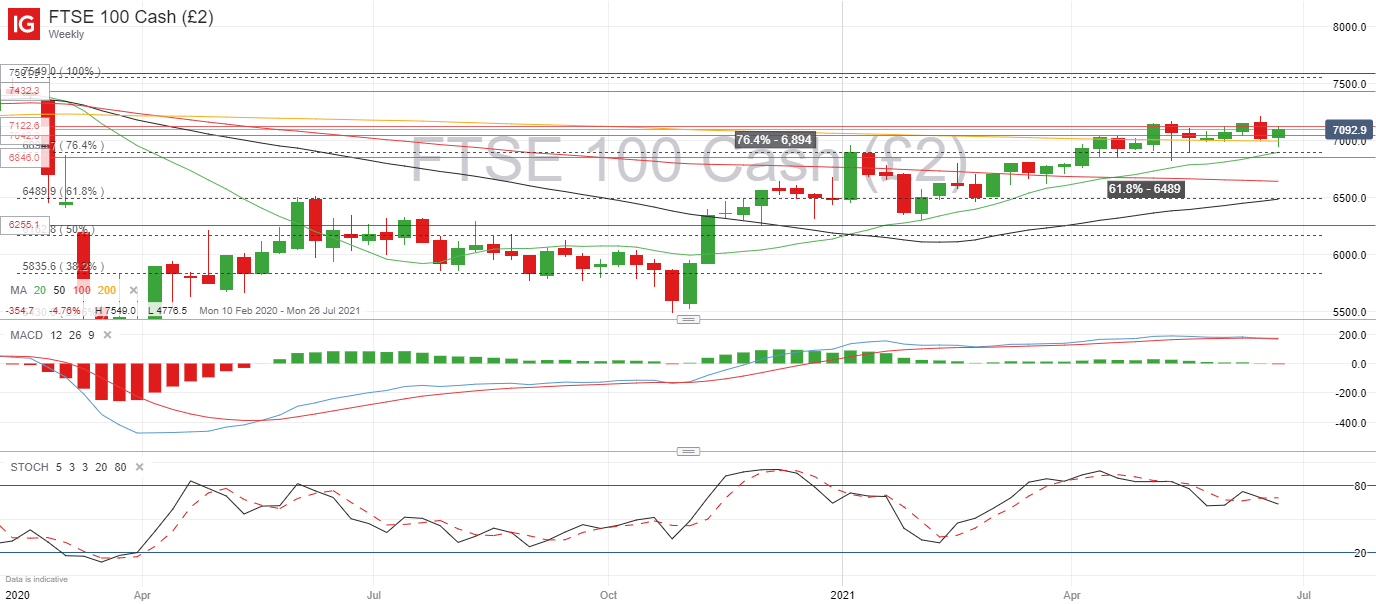
The weekly chart is still showing a tight range around the 7,000 mark with any meaningful advances or drops being corrected almost instantly. As bullish momentum is building this week, a break above 7,122 would likely consolidate further gains towards last week’s top at 7,218, which is the highest price since February 2020. To the downside, strong support can be found between 6,894 and 6,846 with a fall below this are likely to ignite further bearish momentum towards 7,500.
Learn more about the stock market basics here or download our free trading guides.
— Written by Daniela Sabin Hathorn, Market Analyst
Follow Daniela on Twitter @HathornSabin
Be the first to comment