

dinachi/iStock via Getty Images
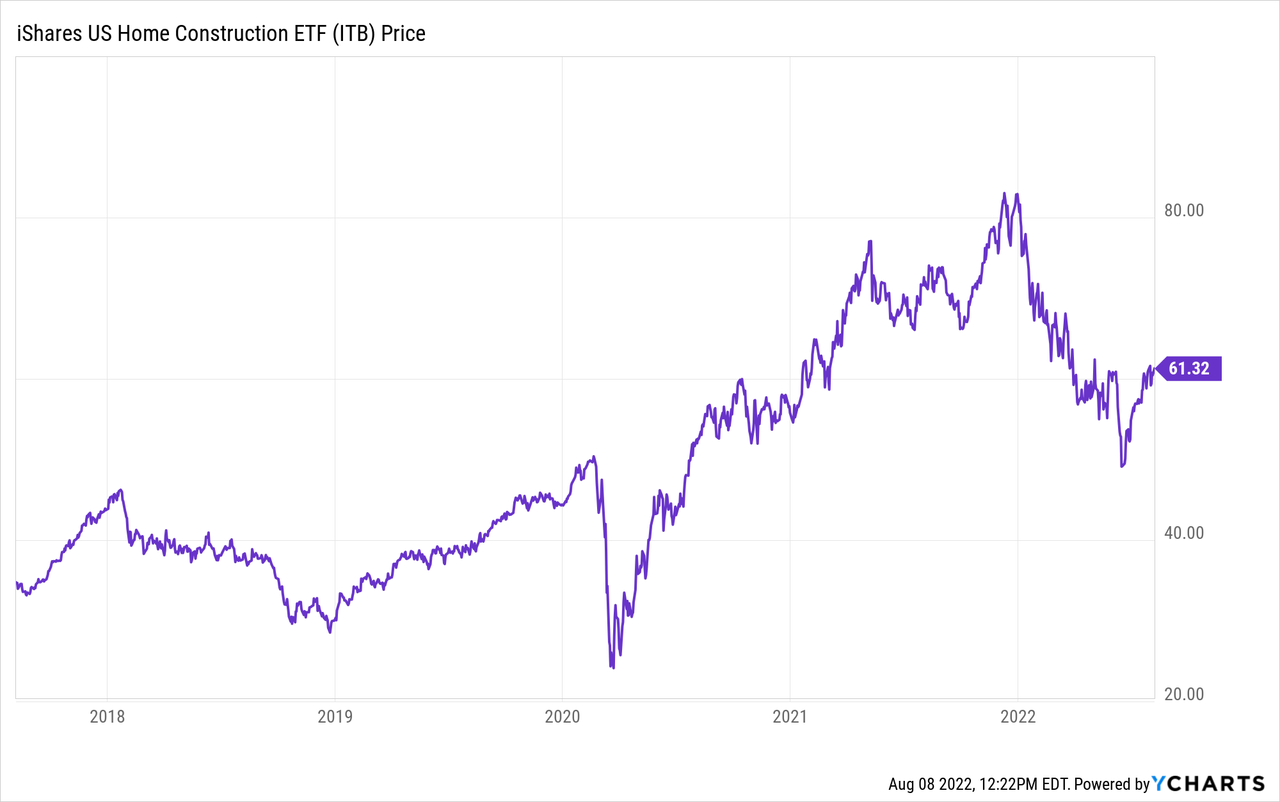
Renowned economist Irving Fisher pronounced in October 1929 that stocks had reached a “permanently high plateau.” Investors cheered, but the crash of 1929 came weeks later, relegating Fisher’s quote to the halls of infamy. Not to be outdone, National Association of Realtors Chief Economist David Lereah published a book called Why The Real Estate Boom Will Not Bust in 2005 and famously called housing bears “chicken littles.” Of course, everyone (including me) who makes enough macroeconomic predictions is prone to be wrong about something at some point. But a lot of the “facts” surrounding the housing market are not facts, and the demographic reality clearly doesn’t support the housing boom that has taken place over the past two years. The crazy boom in the housing market was never supported by long-term economic fundamentals. Since everyone needs a place to live, this has broad implications for anyone reading this. Investors in housing stocks like any of the holdings in the iShares U.S. Home Construction ETF (BATS:ITB) also should take note. Not everyone will agree, as of course, investing in housing (like investing in stocks) is generally a solid way to build long-term wealth. That is, unless you’re buying into a twice-in-a-lifetime bubble.
Is There A Housing Bubble?
It quacks like a duck.
Bubbles are a little tough to define, but the most commonly accepted definition of an asset bubble is when asset prices are much higher than economic fundamentals can reasonably justify. For the housing market, since everyone needs a place to live, the simplest way to think about economic fundamentals is the relationship between wages, rents, interest rates, and home prices. Other key inputs are housing starts and demographics (more on this later).
Another quirk of the housing market is if you own your home, you don’t really have to participate in it. I’ve been reading about the Rolex market going crazy since the crypto boom, but I don’t really care. I have a vintage Rolex, and I couldn’t care less about the price because I’m not buying or selling. If you bought a house after 2008 and before 2020, the housing market isn’t your problem, just like the used car market isn’t your problem if you have a car. But if you’re a millennial renter with a growing family, the housing market is likely a constant source of anxiety.
In a typical year, roughly 5 million existing homes change hands, and there are new housing starts of roughly 1-1.5 million. Estimates vary for the total number of households, but I have it around 128 million, with about two-thirds being homeowners and the rest renters. So by these numbers, only about 5%-7% of people are buying or selling in any given year, which is a lot less than it used to be. Note that if someone sells one house and buys another it’s not actually net supply, so the narrative that rising rates will drive up housing prices even more doesn’t make sense. It’s a small percentage of brave people winning and losing big on housing, often betting many times their annual pretax income doing so. And now, the cracks are showing, as consumer confidence in housing plunges and prices have started to fall in formerly hot areas.
Here’s a graph that illustrates housing being out of line with fundamentals. During the pandemic, the Fed feared a housing crash and pushed down mortgage rates to 3% to support the housing market. This allowed prices to quickly rise as people could buy the same house for a smaller payment, so they bid higher. But then, the Fed realized that their policies were creating unintended consequences (i.e., runaway inflation), so they let mortgage rates normalize to the 5.5% to 6% range they’re in now. So now prices are 25% (or more) higher than pre-pandemic and interest rates are double from where they were last year, creating the biggest spike in the average mortgage payment ever relative to wages. Along similar lines, the Dallas Fed was concerned enough about the housing market in March to publish a paper warning of a brewing bubble.
Real Mortgage Payment (Freddie Mac)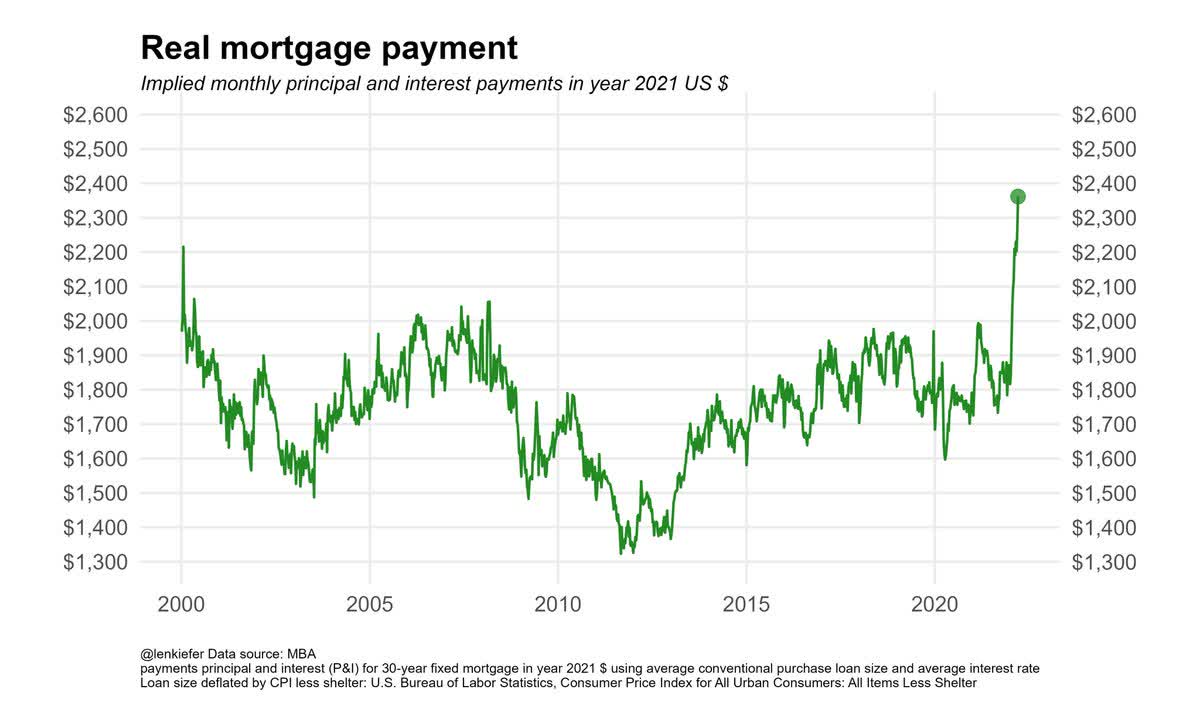
High real mortgage payments echo bubbles from the past, but the pandemic price spike has no real precedent. The craziest graph I could probably show you is from Yardeni Research, with the percentage of people who work in red vs. the percentage of people who own or rent a home in blue. The correlation is pretty tight in the post-war era, until 2020 when the government started handing out free money while all but banning evictions and foreclosures. Then it blew out. Something has to give with this, either more people are going to have to work or fewer people are going to be able to own or rent homes. It’s likely that rent increases, people moving in with family, and evictions are already working to start to close this gap. The gap should close in the next year or so, bringing down housing prices and rents.
The Craziest Graph In Housing (Yardeni Research)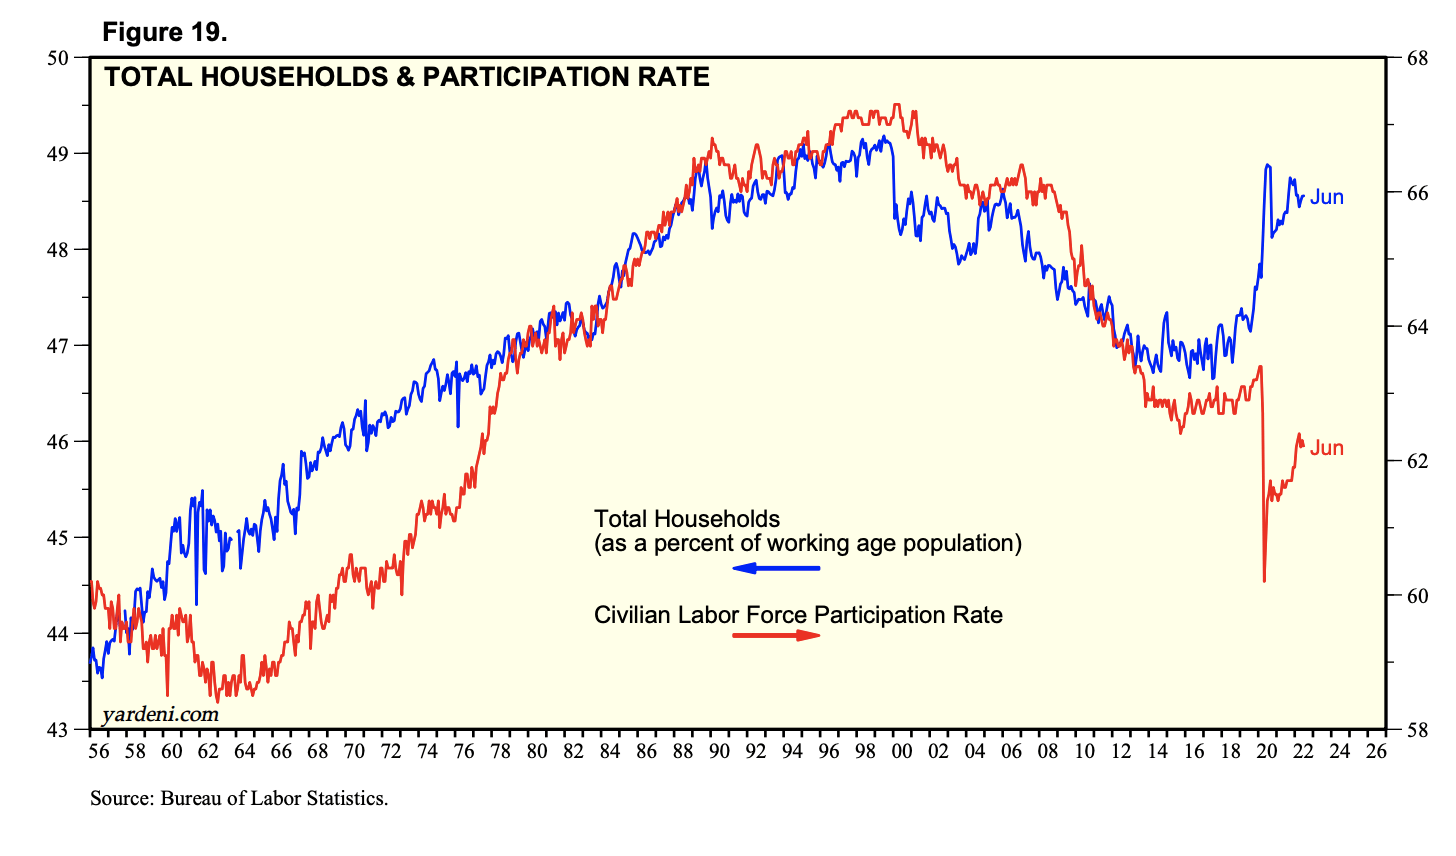
Another weird data point? At least in Texas, the number of housing units per capita is actually about the same as it was in 2008, challenging the idea that there’s a pervasive housing shortage. Most states are in a similar position, either having a high ratio of housing to population overall or a quickly growing number.
Housing Shortage? (Economica)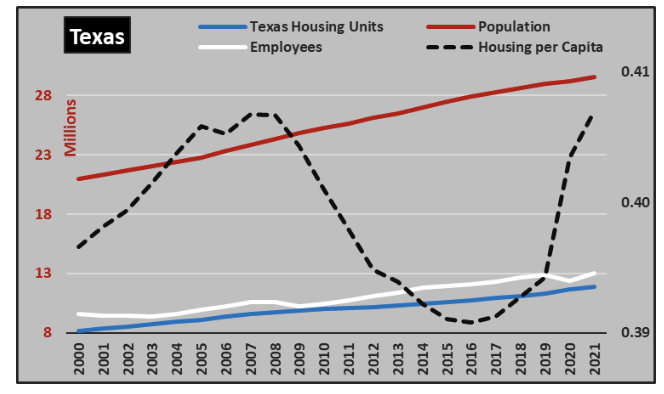
Fortune has a series running on the housing market, but one of my favorites compares the 2000s housing bubble with today. They use a model from Moody’s that compares housing prices with economic fundamentals. The data is interactive, and I would encourage readers to check out their local market for 2007 and 2022.
2007: 2000s Housing Bubble
2007 Housing Market (Fortune)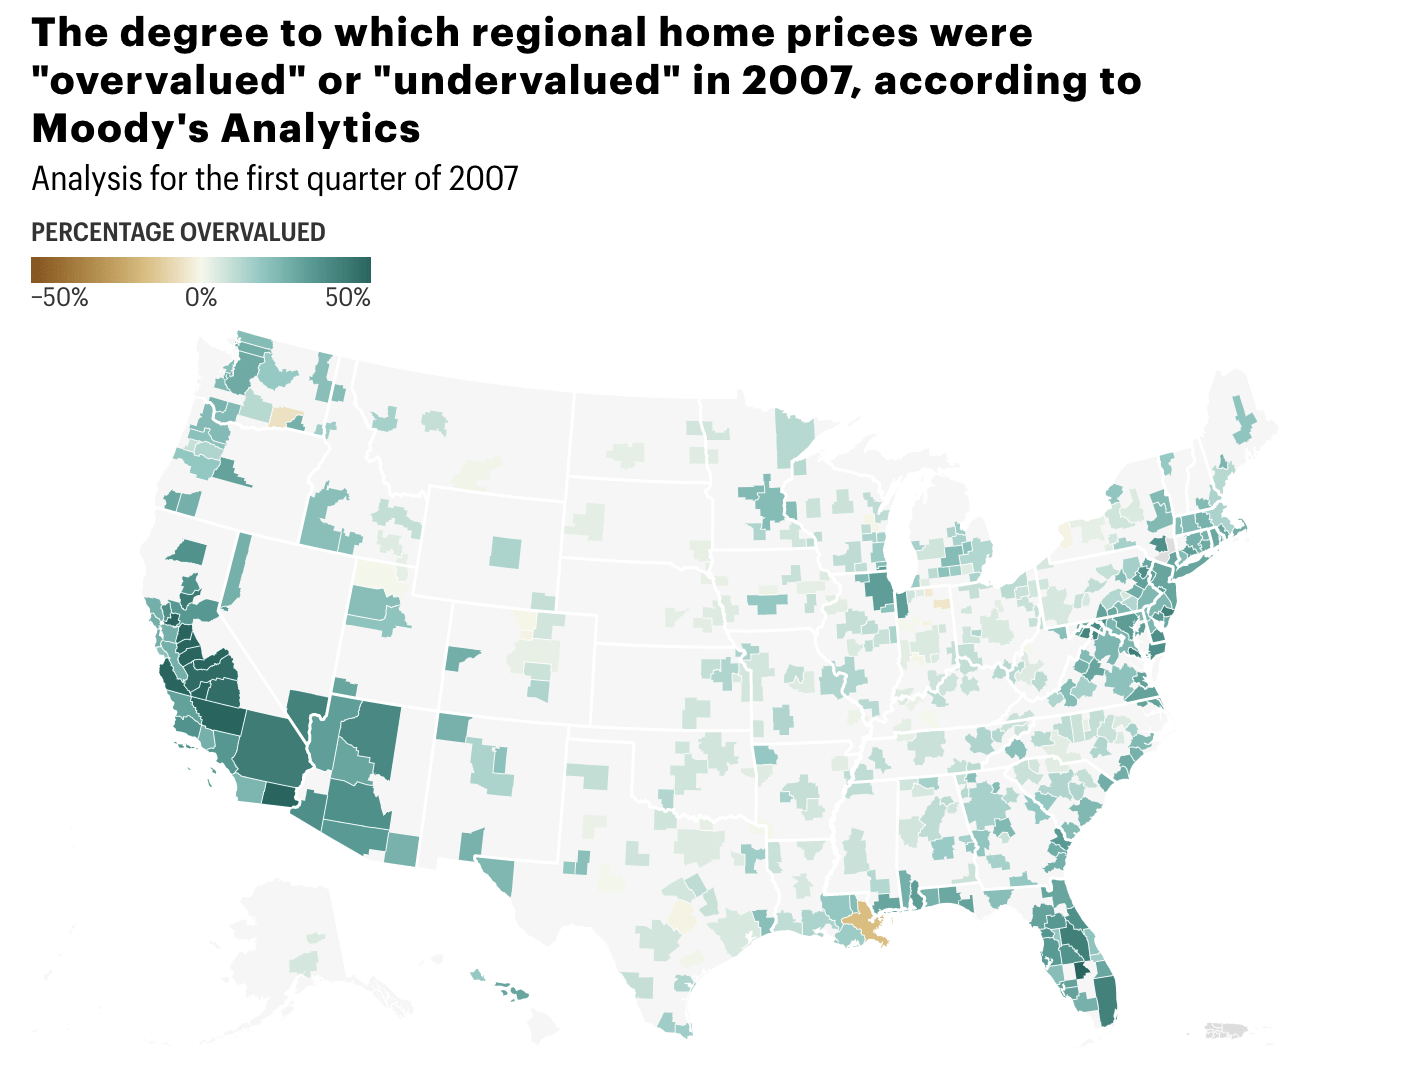
In 2007, the most overvalued markets were the Inland Empire of California, Las Vegas, and areas of Florida. I’ve previously written about how commuting costs, taxes, and utility bills make places like the Inland Empire uniquely unattractive from a housing standpoint. All of these markets got crushed. To this point, investment house Guggenheim’s CIO Scott Minerd has a funny interview on how he got burned buying swamp property in Florida in the 1980s. Interestingly, the model thought major metros in Texas weren’t overvalued at the time, and accordingly, Texas never saw much of a real estate bust in the 2000s.
The 2010s: Normal Housing Market
Pre-pandemic Housing Market (Fortune)
In the 2010s, the housing market was fairly balanced. Large swaths of the northeast were considered undervalued, as was Chicago. The most overvalued markets were some mountain areas and trendy cities like Charlotte, Denver, and Austin. I’ve always felt like much of the Bay Area real estate wasn’t great value for the money and thought it was particularly vulnerable to rising rates, but the model disagrees due to the high salaries in the area.
2022: 2020s Housing Bubble
2022 Housing Market (Fortune)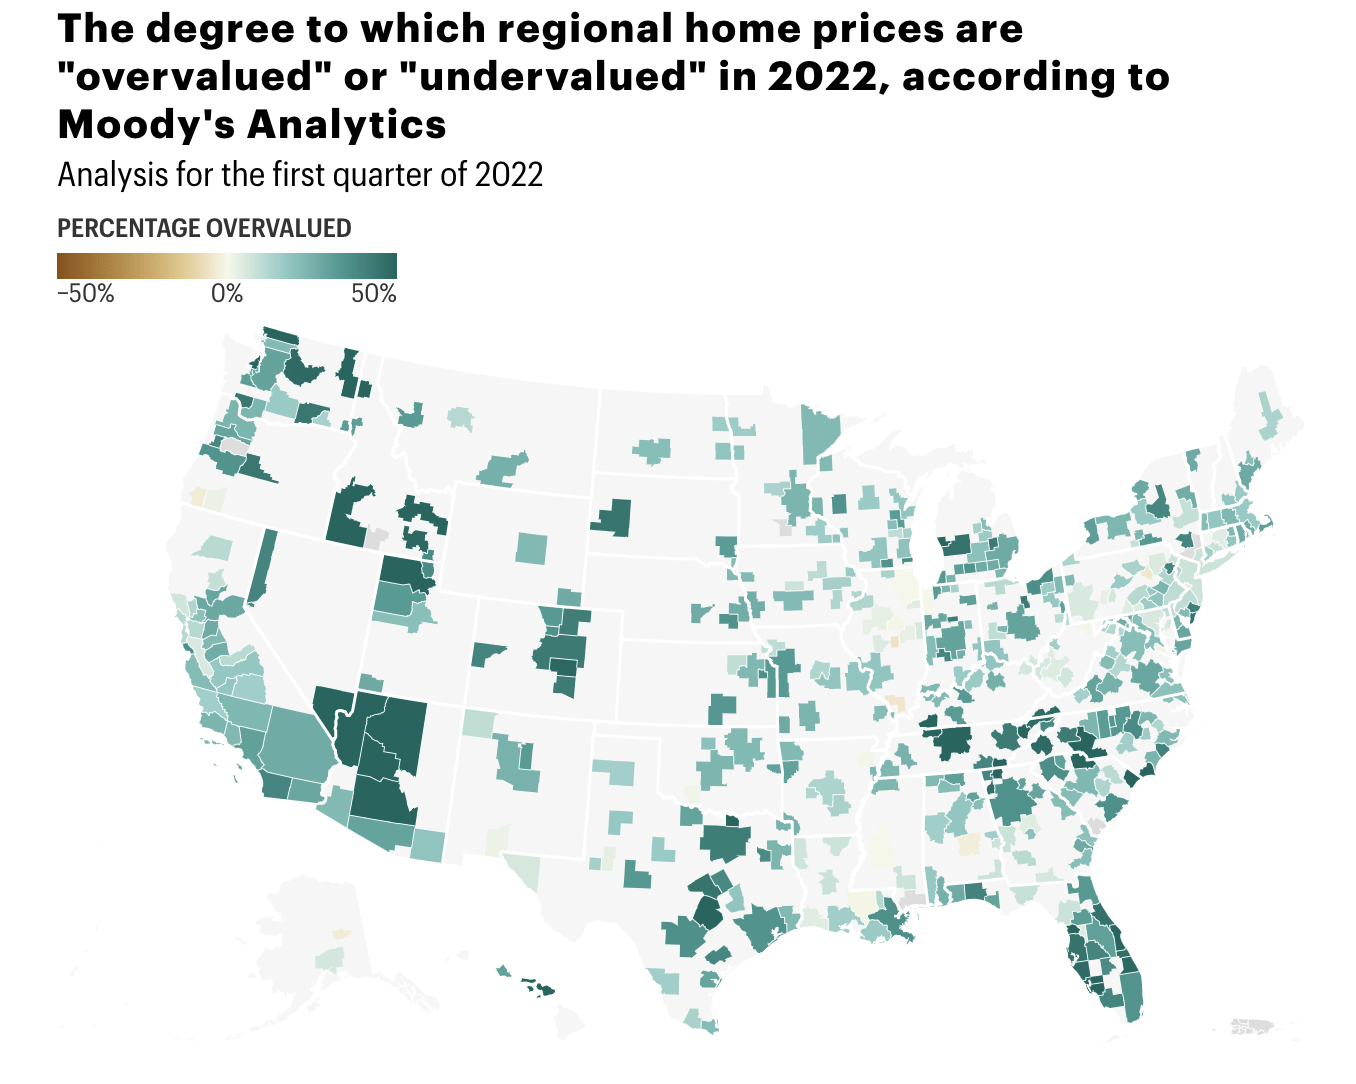
The prevailing narrative is that remote work has allowed millions of people to relocate to lower-cost-of-living areas, flooding Texas and Florida with residents and emptying out New York and California. However, the data doesn’t really back this up. Domestic migration has for a long time been out of New York and Los Angeles, while international immigration fills the void. Now (legal) immigration has slowed, and migration rates are decreasing. Yet, property increased by a lot in value in areas that should have seen declines under the narrative. I don’t mean to completely discount the idea of people moving out of cities and remote work because this was a big factor in hot markets like Aspen, Santa Barbara, and Palm Beach. I don’t have a ton of data from those smaller markets, but some of the hottest markets of COVID like Austin, Boise, and Phoenix are now the biggest losers.
What I think matters more is a suite of government policies that were meant to prevent homelessness and a housing crash ended up pouring fuel on the speculative fire. First, the eviction moratorium allowed millions of Americans to live rent free. This reduced supply of rentals. Most of them didn’t save the money and instead went out and spent it. Second, the foreclosure moratorium allowed millions of people to get mortgage forbearance and hold their homes off the market. This reduced supply of homes for sale. Third, the Federal Reserve embarked on a massive QE program whose point was to drive mortgage rates to 3% annually. This massively increased demand for housing. Temporarily constrain supply and temporarily increase demand, and you have the recipe for a huge housing boom and an equally huge bust when market forces make you abandon the policies that created the bubble. Housing downturns usually take 2-4 years to play out, so we’re still very early in this process.
The picture gets even more interesting when you look at housing stocks like homebuilders. Many homebuilders are trading at low to mid-single-digit PE ratios, indicating an extreme amount of market pessimism. Lennar (LEN) trades for less than 5x earnings, D.R. Horton (DHI) trades for less than 5x, and PulteGroup (PHM) trades for less than 4x. The stock market is pricing a housing crash for homebuilders, but optimistic homebuyers have been panic buying homes. Another crazy contradiction.
ITB, which is the most common ETF proxy for the housing market, seems like a value trap. So many of the companies in the index built their business models on the Fed continuing policies which ultimately turned out to be a mistake. Going forward, higher rates and slower demographic growth seem like they will be here to stay. I don’t think everyone in housing adjacent industries is screwed-Berkshire Hathaway (BRK.A) (BRK.B) is a major player in the real estate brokerage business. Brokerage is less cyclical than the housing market at large and relies heavily on independent contractors rather than a large payroll. I thought Compass (COMP) was a good buy at ~$7 along with a few other busted IPOs like Robinhood (HOOD) and Coinbase (COIN), but the stocks have been mostly crushed. I suppose no one can win them all, but anyone reading this should consider the data I’m presenting and how it affects their view of the world and portfolio.
Is There A Housing Shortage?
Not really.
The national housing market was fairly balanced before the pandemic outside of the West Coast. Now, the pandemic has killed over a million people in the US, drove birth rates and population growth to historic lows, and sparked a boom in construction. So the population is roughly flat, and housing starts were ~1.2 million for 2020, ~1.6 million for 2021, and are likely to be about ~1.5 million for 2022. Any way you slice it, that’s over 4 million homes built. At an average of 2.5 residents per household, those homes built could support 10 million new residents. Of course, 300,000 houses or so need to be knocked down each year, so the net might only be 3 million new houses rather than 4+ million, but that’s still a ton of new supply, enough to house many millions of people.
Who’s going to live in all of these homes? That’s an open question, and once the pandemic government policies are further in the rearview mirror, the data is likely to show that the housing market is oversupplied. Houses will continue to come on the market from new builds and from attrition (death, divorce, and despair), while there won’t be as many people in younger generations to fill them unless something dramatically changes in the next 5-10 years.
The housing market craziness has come from demand from investors large and small, mass psychology (buy now or you’ll miss out forever!!), and crazy government policies. What has clearly not driven the changes in the housing market is population growth, an increase in the labor force, and other long-term demographic changes.
Key Takeaways
- The growth in housing prices is way out of line with economic fundamentals like wages and demographics and was almost certainly caused in large part by misguided pandemic policies and FOMO.
- These government policies have all been reversed or struck down by courts, leaving the housing market on its own against fundamentals. This implies that housing prices will need to revert to near pre-pandemic levels.
- The long-run demographic picture for the housing market does not support paying sky-high prices for housing.
- Buying a home at this exact moment is a clear case of fighting the Fed, and if you do it, you’re likely to lose money over the next few years and pay 5.5% or higher in mortgage interest for the privilege.
- Should you sell your house and rent to take advantage of this? Probably not, unless you hate your house or your house is worth millions of dollars. However, I would give the strongest possible warning against buying anything now.
- Housing plays like ITB are likely a value trap until the housing bubble fully unwinds.
Be the first to comment