

Sewcream/iStock via Getty Images
Bad time to be a house
When analysing the business cycle, few sectors and areas of the economy are of more importance than the housing market. With housing contributing to around 15-20% of GDP through housing-related investment and consumption, understanding the outlook for the housing market will provide investors with a significant edge to determining where the business cycle is headed.
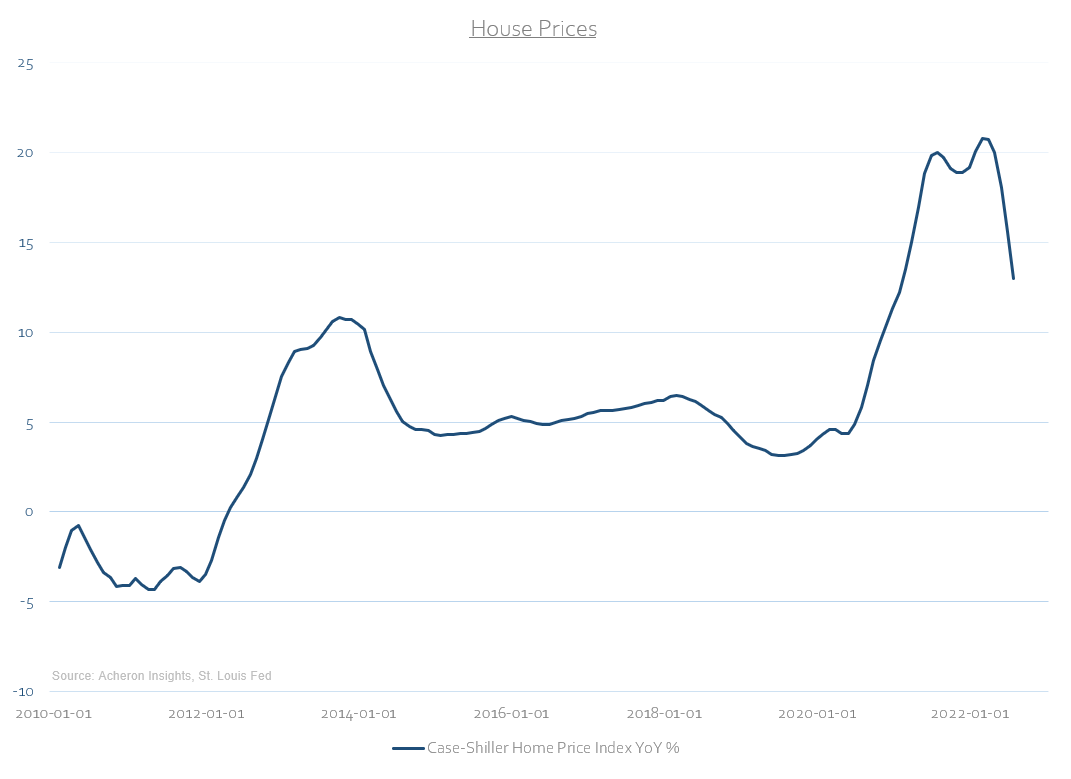
Back in April, I detailed in depth the outlook for the housing market and how it was the poorest since the Global Financial Crisis (which you can peruse here). Unfortunately, the outlook has not changed for the better since, with house prices across the country likely to continue to tumble, a dynamic that will continue to be a drag on economic growth given the importance of the housing-related wealth effect for consumers and housing-related investment and consumption.
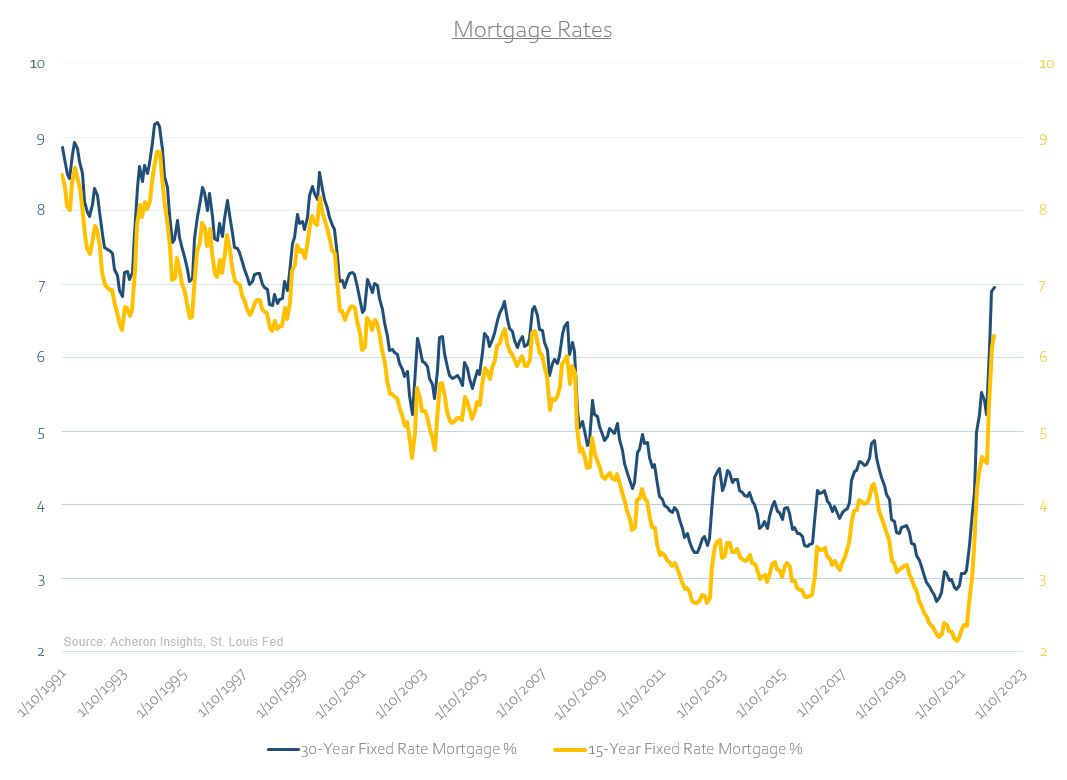
What has and will bear much of the responsibility for the cyclical downturn in the housing market are the movements in mortgage rates over the past 12 months. Both the 15- and 30-year mortgage rates are at their highest levels in nearly 15 years, and although most existing US mortgages are fixed by nature, mortgage rates at these levels only serve to crowd out potential buyers. What’s more, this rise in mortgage rates has occurred at the quickest pace since the mid-1990s, whilst greatly exceeding any periods during this time in magnitude. House prices are highly cyclical and sensitive to interest rates.
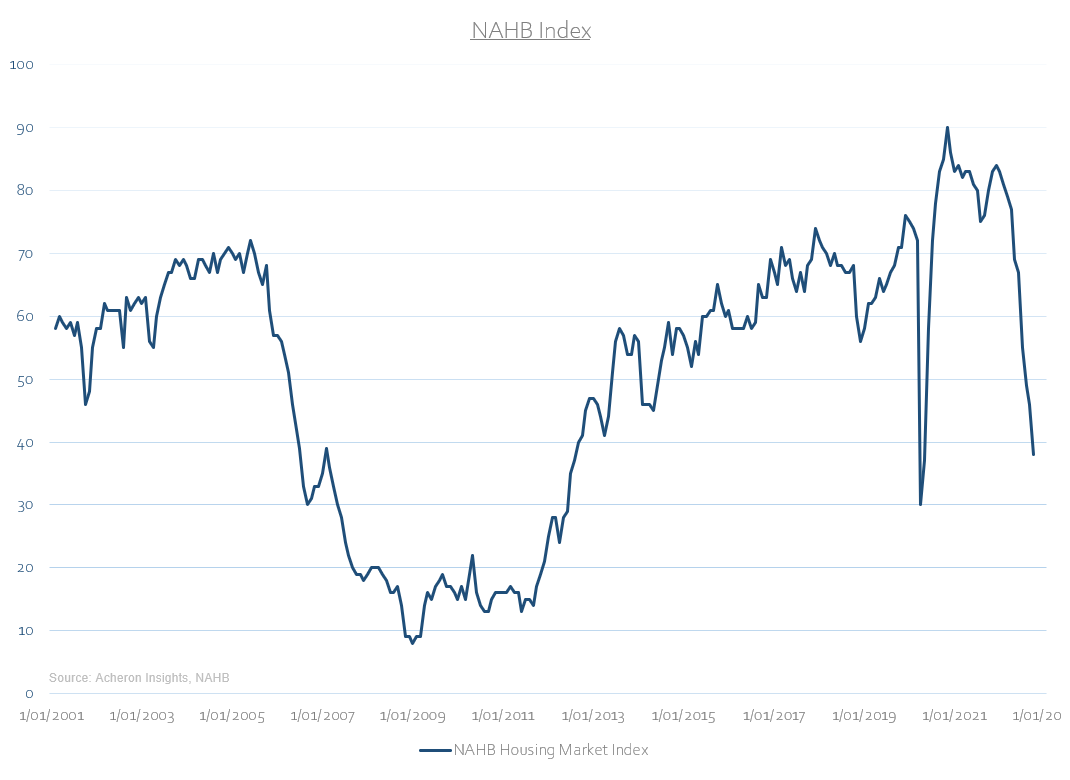
This is exactly why the NAHB Housing Market Index has nearly retraced to the lows seen briefly during the onslaught of the COVID-19 pandemic. The NAHB Index is an important data point as it is effectively a measure of homebuilder sentiment and is perhaps the most widely watched gauge of the housing market within the United States. Readings such as this are a bad sign for both the outlook for house prices and the economy. Simple as that.
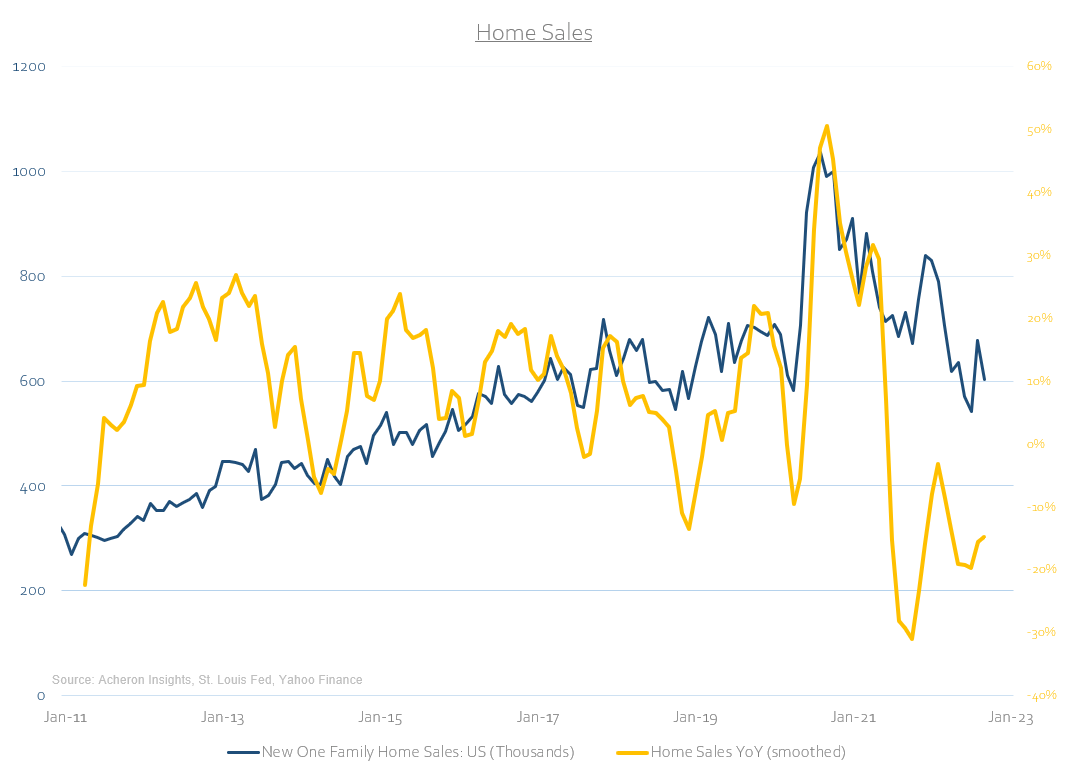
Unsurprisingly, home sales have rolled over significantly from their peak in late 2020/early 2021 as a result. On a rate-of-change basis, the measure which matters most from an investment perspective, home sale growth has been negative since Q1 2021. Demand is falling at a rapid pace.
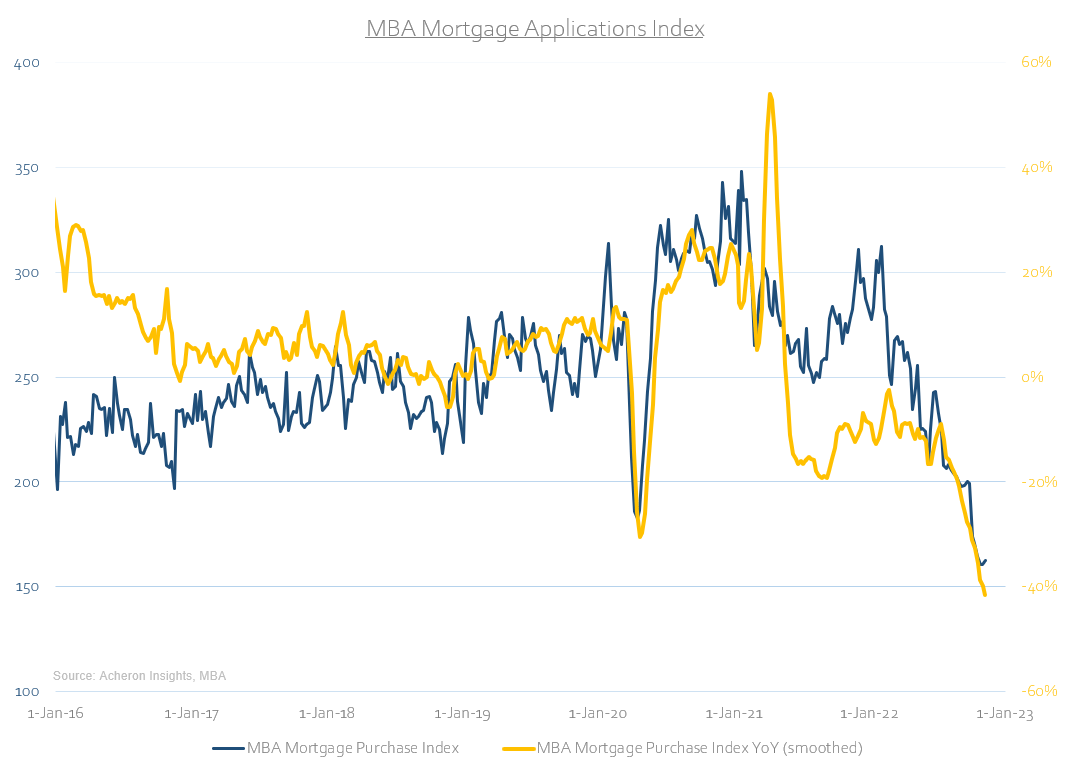
We can further assess demand for housing through the lens of mortgage applications for the purchase of new a home. The MBA Mortgage Applications Index tracks this data and is at its lowest levels in over seven years. With mortgage rates now over 6%, homebuyer demand is plummeting.
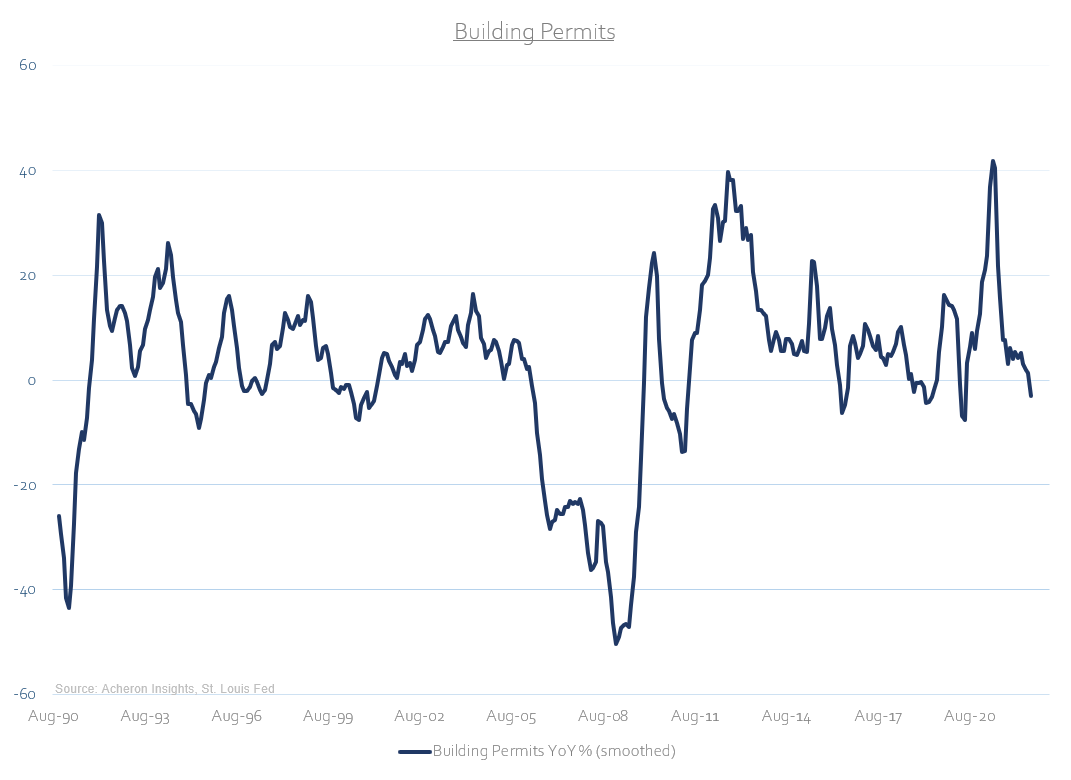
As too are building permits, another excellent indicator of housing demand and a reliable leading indicator for both the economy and the housing market. Growth in building permits has been trending lower since peaking at its highest level in over 30 years in early 2021 and is now in negative territory.
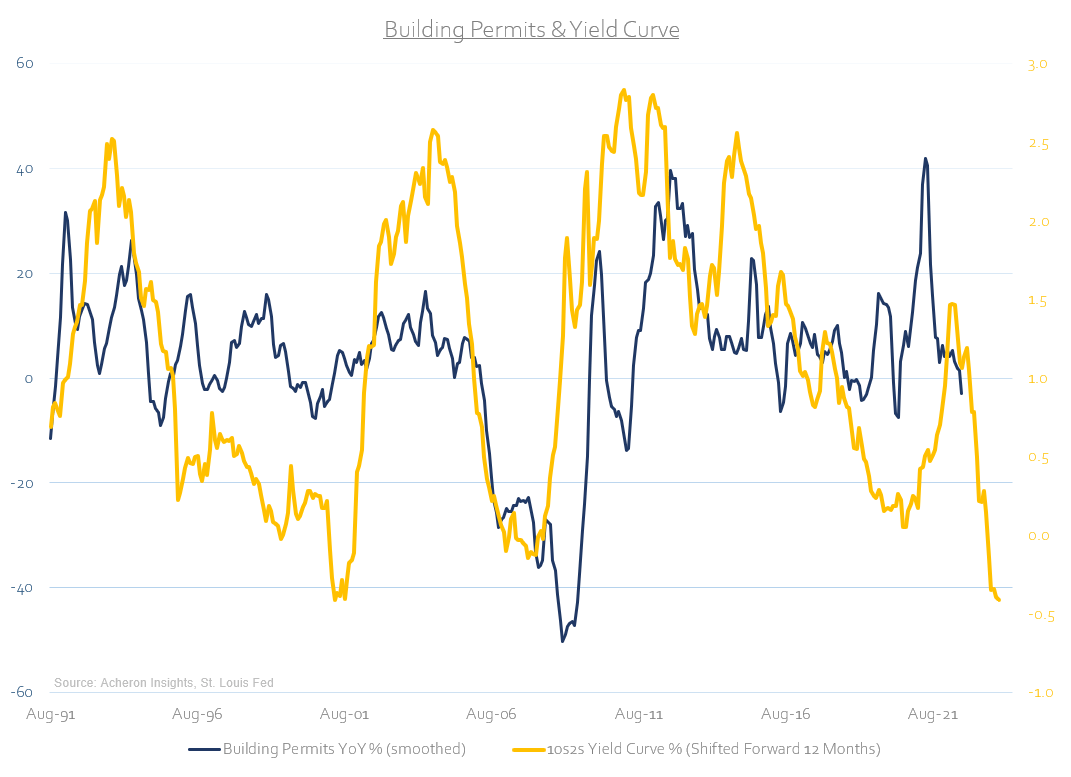
Unfortunately, if the yield curve is anything to go by, this is a trend likely to continue. Whilst the yield curve is by no means a completely accurate leading indicator for building permits, is does provide a rough guide as to where demand is headed over the next 12 months or so. If recession in 2023 is the signal from the yield curve, then do not expect a reprieve in buying demand anytime soon.
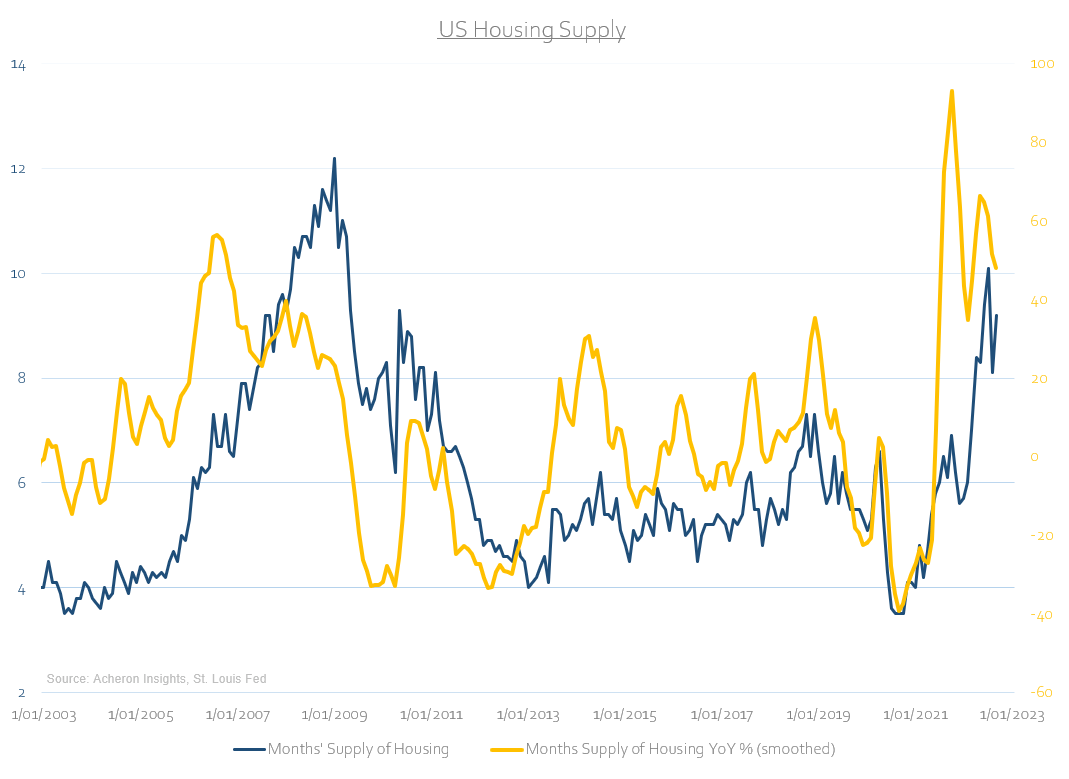
From a supply perspective, things are unfortunately just as bleak. Housing supply, as measured by the months’ supply of housing, is at its highest levels since the GFC. Months’ supply of housing is a measure of the number of months it would take to clear the current inventory of housing for sale based on the current pace of sales. Currently, it would take around nine months to sell the existing number of new houses for sale in the US, the highest since 2008 in both absolute and rate-of-change terms.
When observing this metric, it is important to remember a higher number of months’ supply equates to higher supply, and extreme levels of high supply are indicative of oversupply. Like any market, an oversupply leads to falling prices which leads to underinvestment. A bad outcome all round.
So where are house prices headed?
Now that we have assessed the current state of the housing market through the lens of mortgage rates, demand and supply, we can make an informed judgement as to where house prices are headed over the coming months.
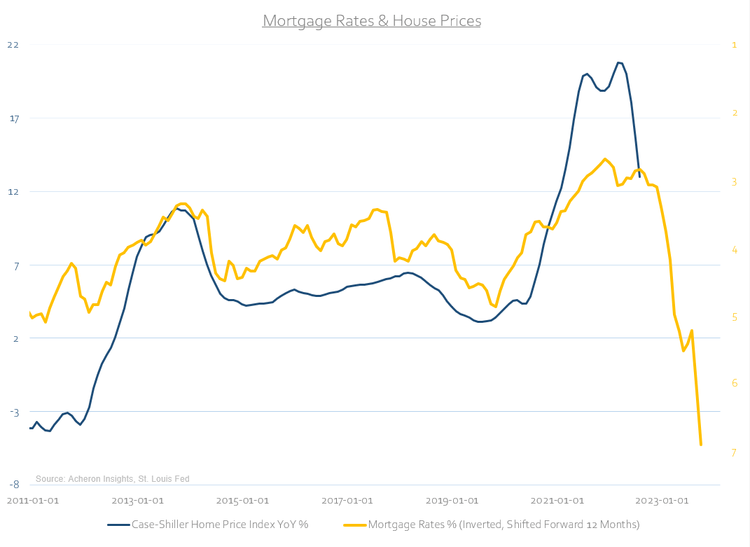
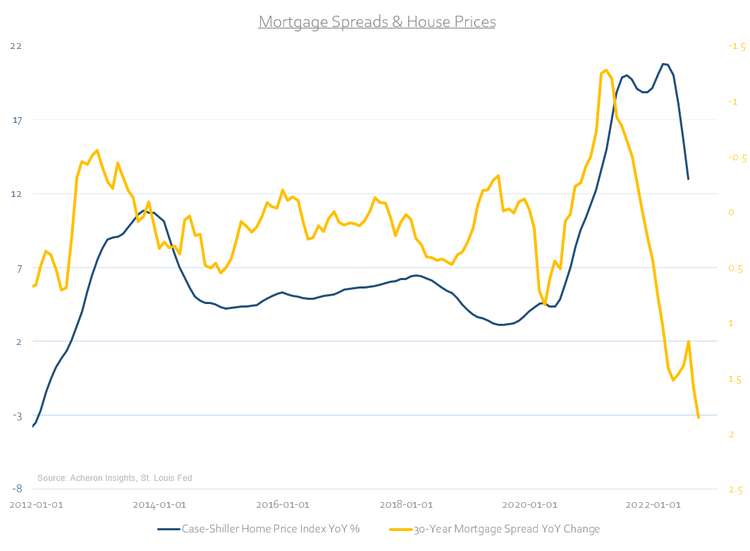
Firstly, given that mortgage rates lie at the heart of the housing market, they have historically been perhaps the best leading indicator for house prices. This is the case for mortgage rates on their own (using the 30-year rate as a proxy), and the spread between mortgage rates and the 30-year Treasury yield. Both measures suggest the deceleration in house prices is likely to continue through the first half of 2023.
It is important to also understand the relationship between mortgage rates and house prices is convex in nature, not linear. As we can see below, a change in mortgage rates from 3% to 7% or vice versa will have a far greater impact on house prices than a move in mortgage rates from 7% to 10%. Should this relationship hold true going forward, we could see the median house price fall by over 20%.
Macrobond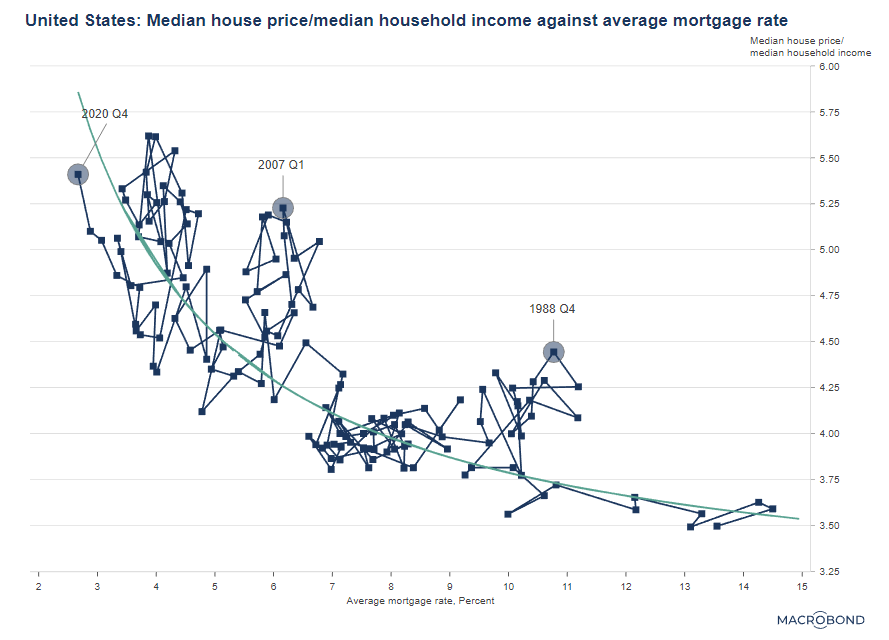
In terms of how supply is likely to impact house prices, an oversupplied housing market like we have at present suggests house prices have much catching up to do to the downside.
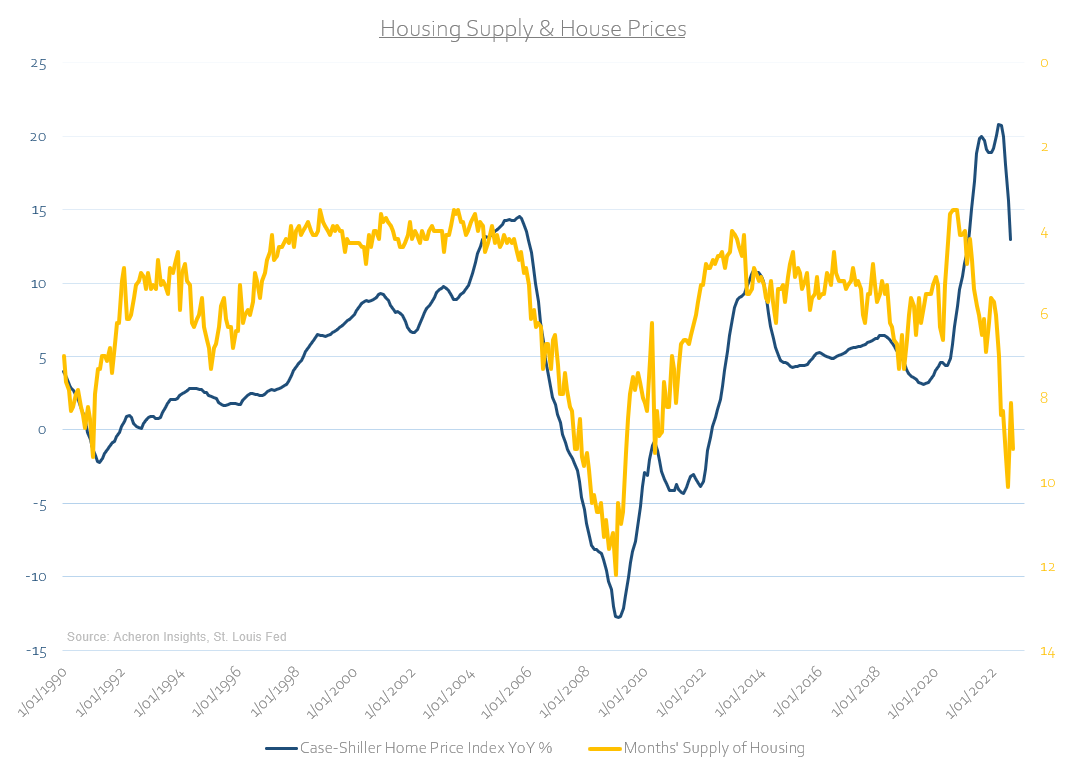
Again, we can observe below how house prices have historically reacted to movements in supply. In layman’s terms, a move higher in supply has historically seen a move lower in prices.
EPB Research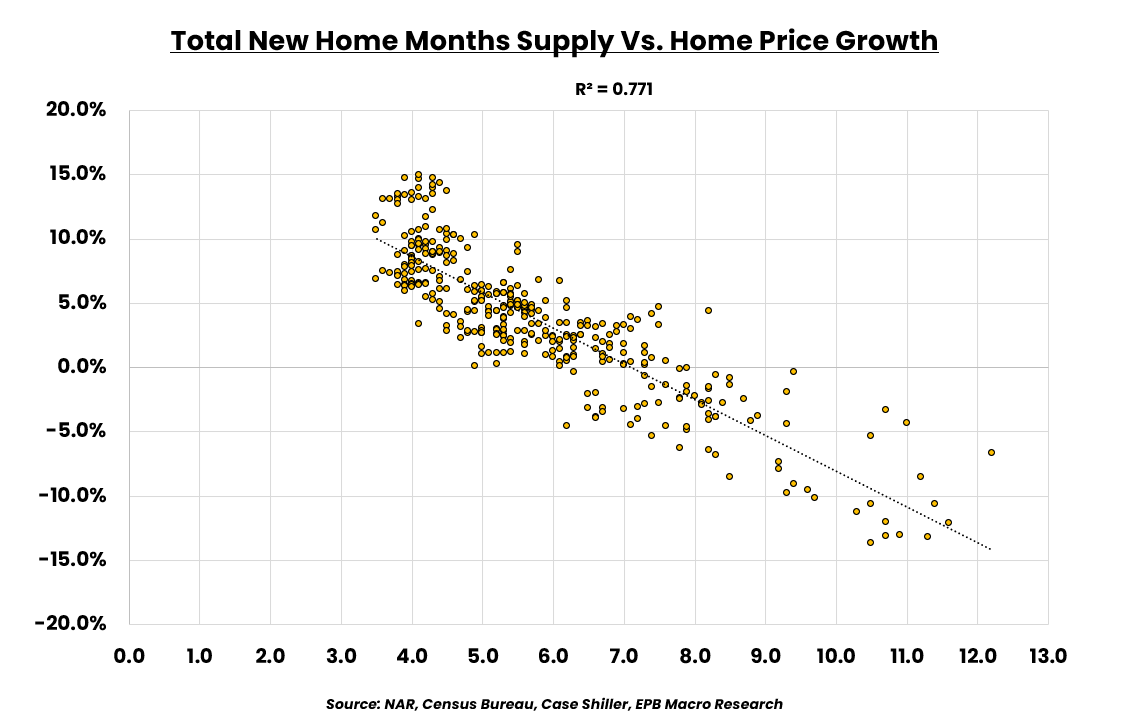
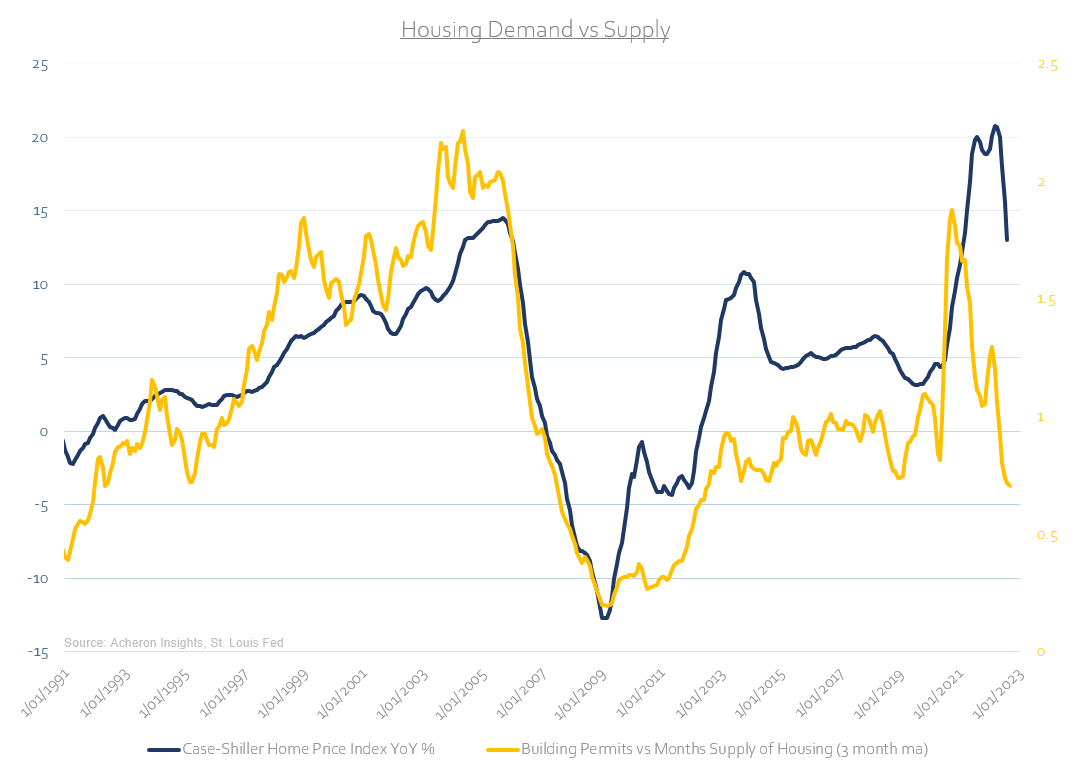
However, we must remember demand is only one side of the equation and it is through the movements in both demand and supply that determines prices. Unfortunately, as we have touched on, the demand for housing is poor. Indeed, If we create a simple demand and supply measure using building permits as the proxy for demand and months’ supply of housing for supply to capture both demand and supply trends and compare this to house prices, the outcome is again considerably bearish.
Another important determinant for housing and asset prices as a whole is liquidity. My preferred measure of liquidity is Excess Liquidity, which measure the growth of the money supply adjusted for inflation in excess of economic growth, with the general idea being that the excess money supply will feed through to asset price inflation, generally leading by around 12 months. Once again, the outlook for housing is meagre at best.
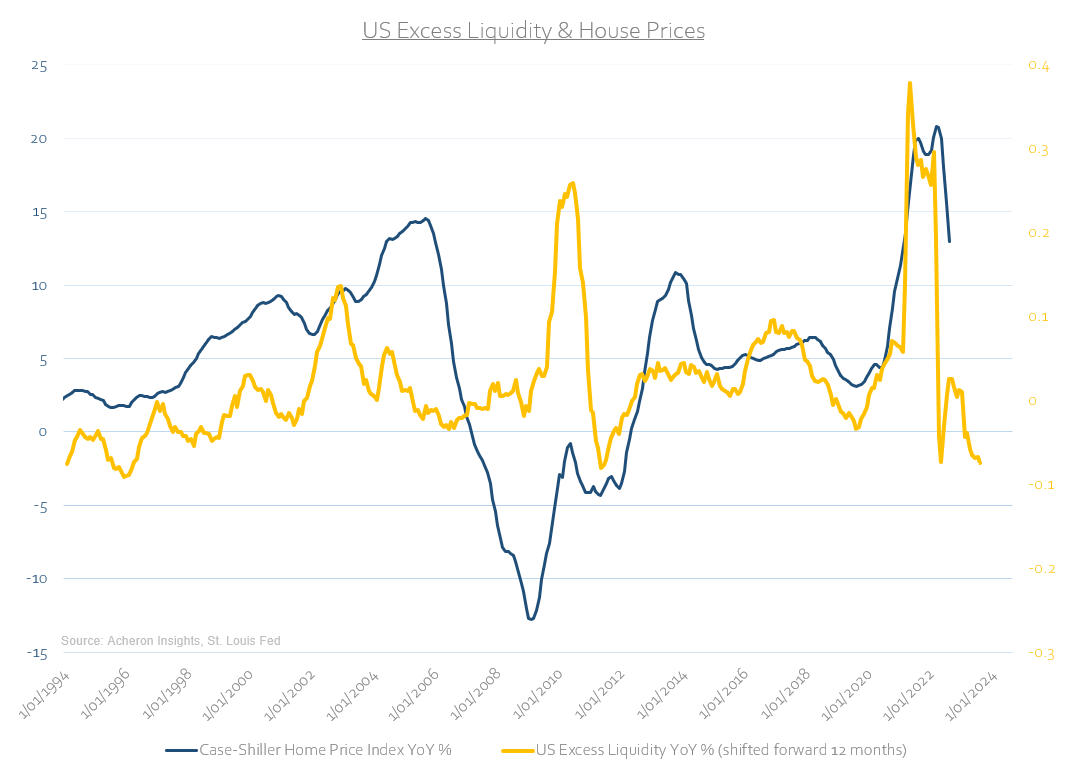
Indeed, with supply, demand, liquidity and mortgage rates all affirming the slowdown in housing, we should expect to see a continued decline in house prices in the coming quarters. For the business cycle and for homebuilder stocks, this will continue to have significant implications.
Economic & investment implications
From an economic and business cycle perspective, the housing market has forever been one of the most important drivers. Housing impacts economic growth through construction and residential investment, housing-related consumption (i.e. furniture and household goods) as well as through the wealth effect of our financialised economy.
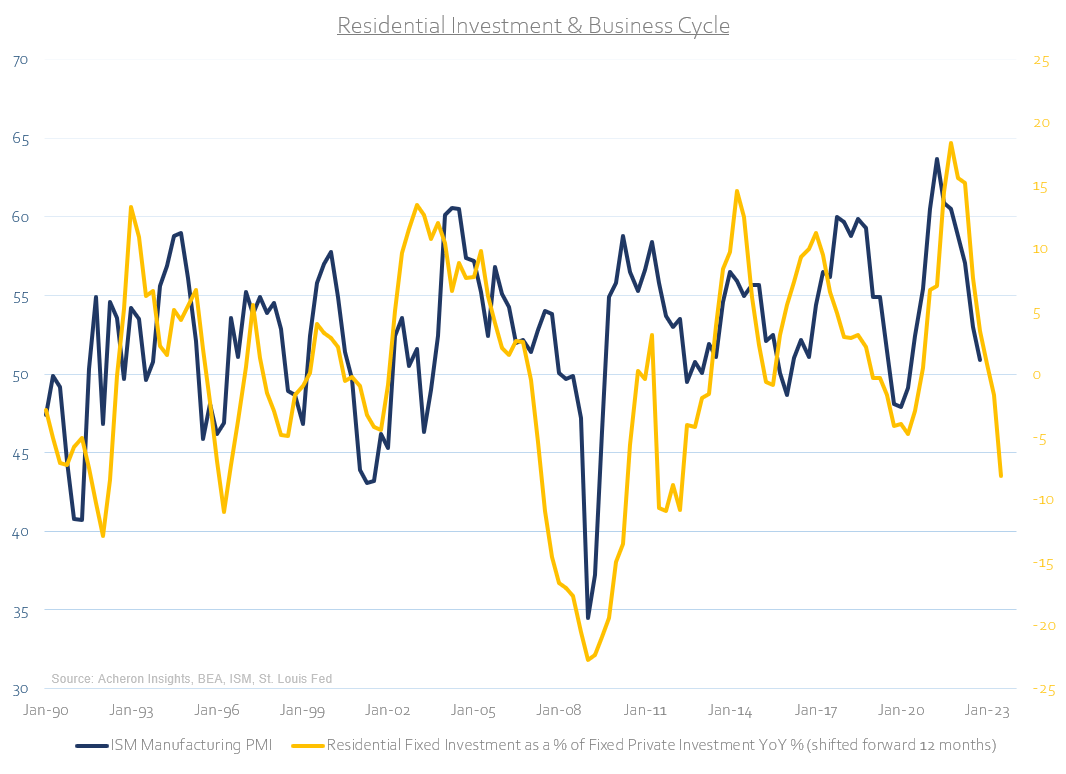
Indeed, one of the most reliable long-leading indicators of the business cycle is the year-over-year change in residential investment as a percentage of total fixed investment. Leading the business cycle (here proxied by the ISM Manufacturing PMI) by around 12 months, residential investment continues to point to a significant slowdown in growth during 2023.
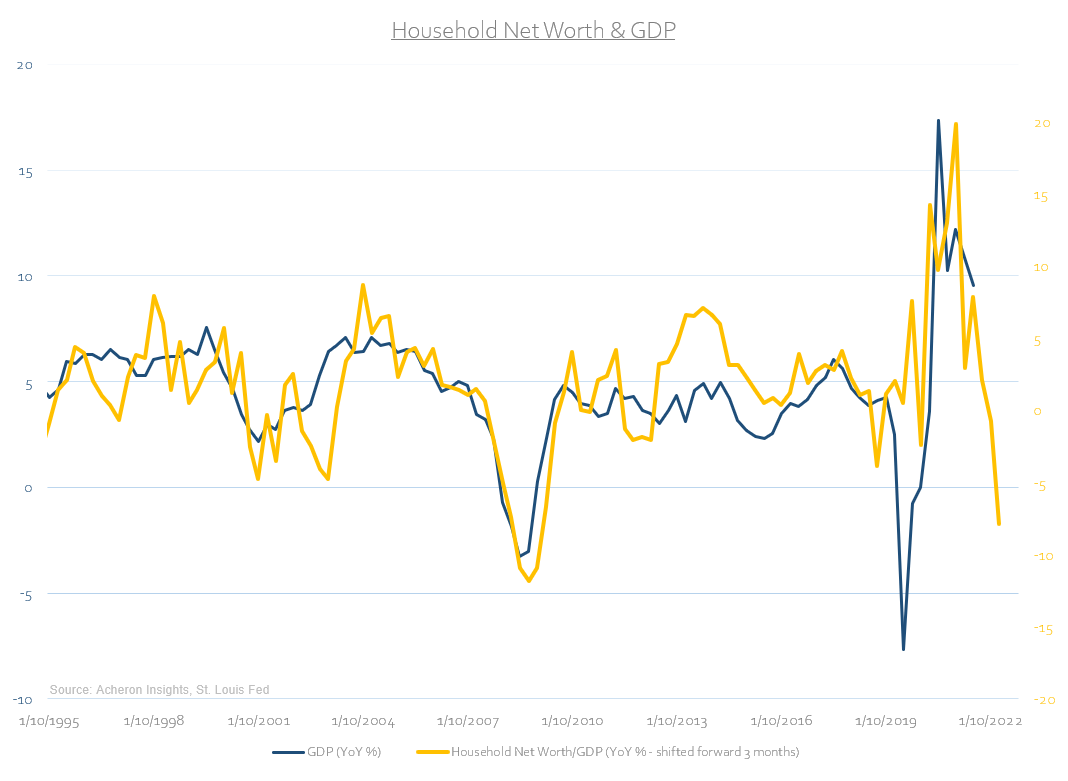
Just as concerning from a growth cycle perspective is the implication of falling housing prices on household net worth. Given we have already seen household net worth growth turn negative in a year-over-year growth rate basis and that housing is by and large the consumers’ largest asset, this portends poorly to the outlook for growth. This is especially so when we consider the likelihood that the house price decline is only just beginning.
It cannot be overstated how financialised the US economy has become. Housing is central to this dynamic. According to Bloomberg’s John Authers, this wealth effect is so pronounced that for “every dollar of change in housing wealth leads to a 38 cent change in consumption”. This relationship is illustrated below with the relationship between house prices (x-axis) and consumption (y-axis) clear.
John Authers – Bloomberg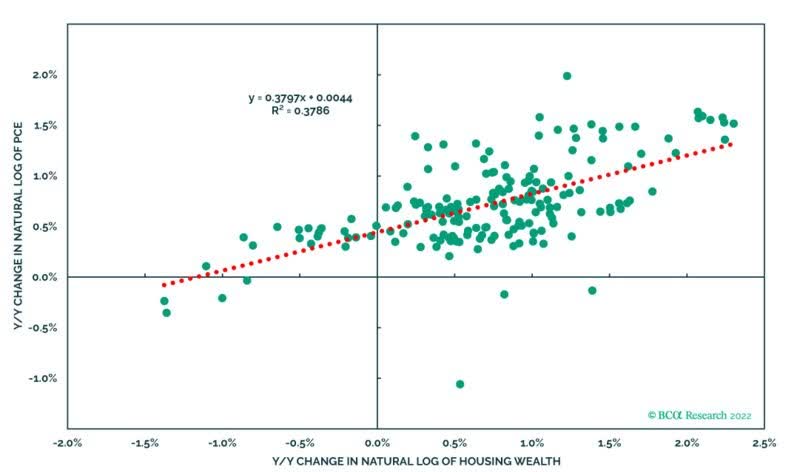
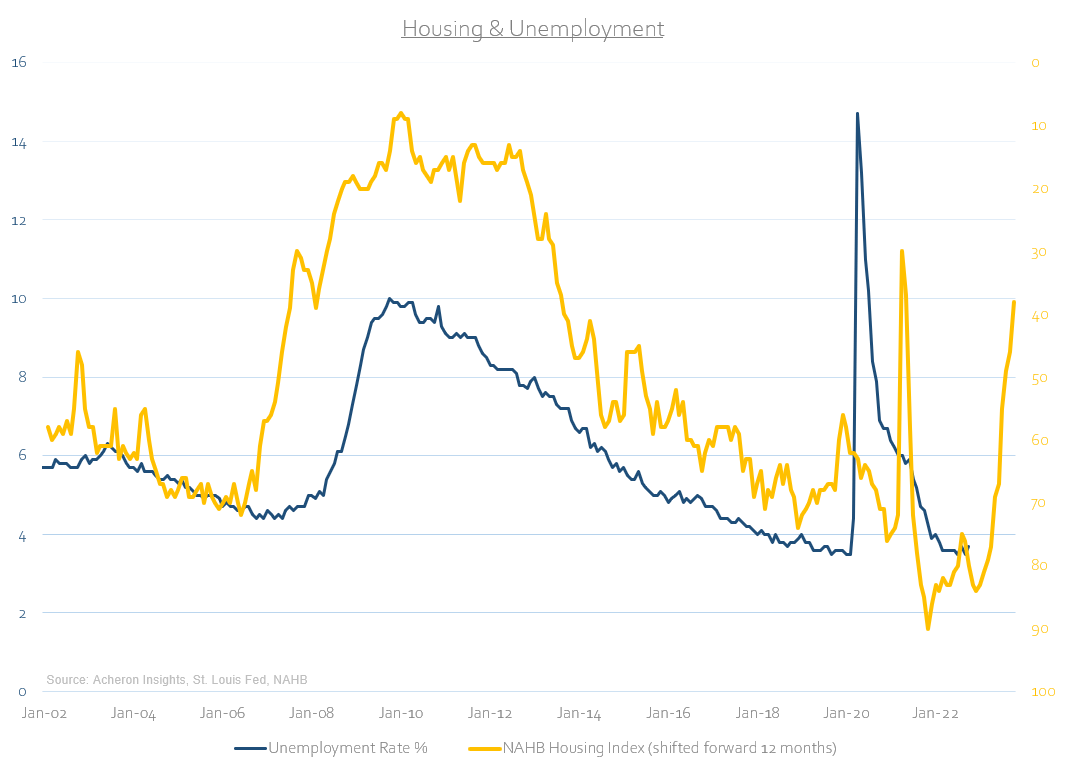
Indeed, not only is this true for consumption but the housing markets too plays a key role in the outlook for employment. Historically, the housing market (proxied via the NAHB Housing Market Index) tends to lead the unemployment rate by around 12 months. This is one measure (among many) pointing to a significant pick-up in unemployment in 2023.
So long as the trend for house prices is down, this will be a drag on economic growth and employment. What’s more, as the downturn progresses, falling house prices will eventually become a disinflationary force through the Owners’ Equivalent Rent component of CPI, to which house prices has historically led by around 12-18 months. This is a story for 2023, however, given the significant lag in this relationship.
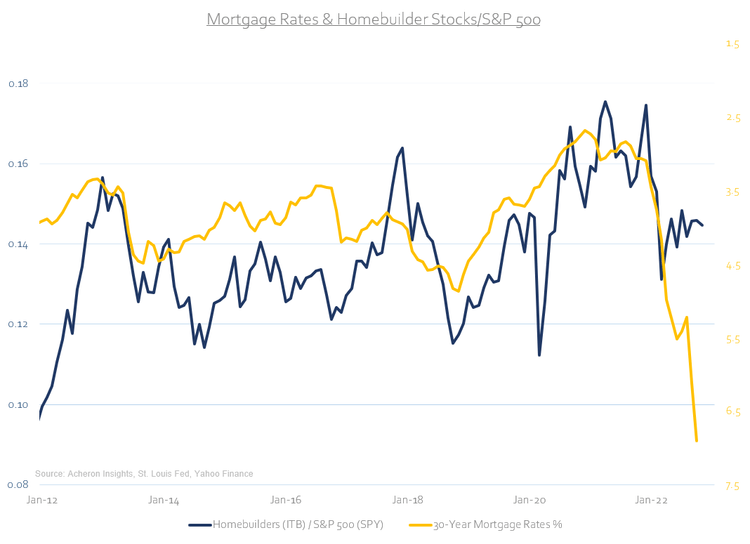
From an investment perspective, the fundamental headwinds for house prices will similarly weigh on homebuilding stocks.
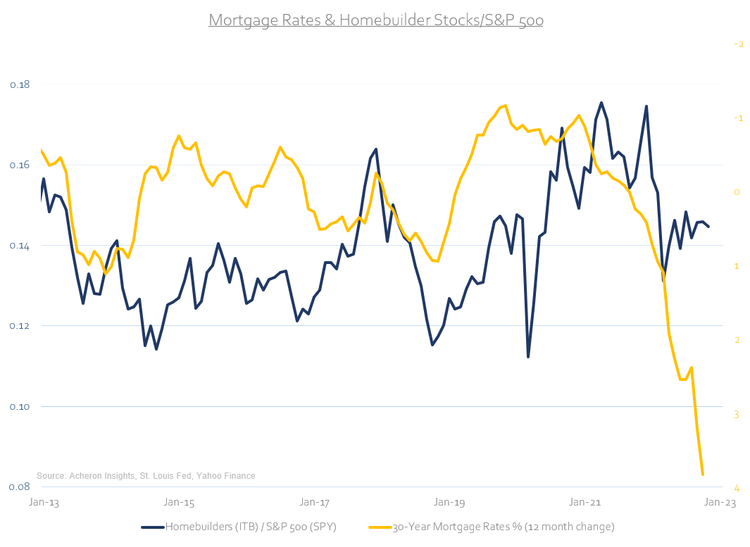
On a relative basis versus the S&P 500, higher mortgage rates (inverted below) suggest further underperformance for homebuilder stocks (per the ITB ETF).
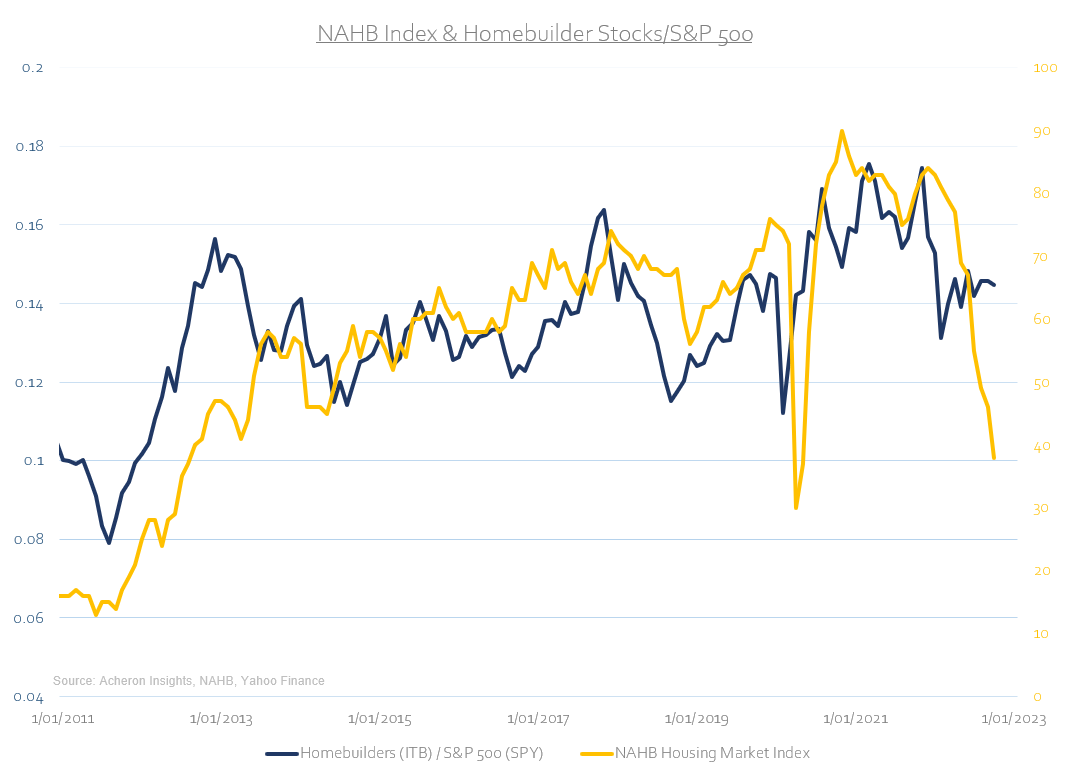
Likewise, not only does the relative performance of homebuilder stocks versus the S&P 500 track mortgage rates, but also the NAHB Housing Market Index. This relationship suggests the ITB/SPY ratio could fall to the lows seen during March 2020. That equates to a near ~20% underperformance of homebuilder stocks from here.
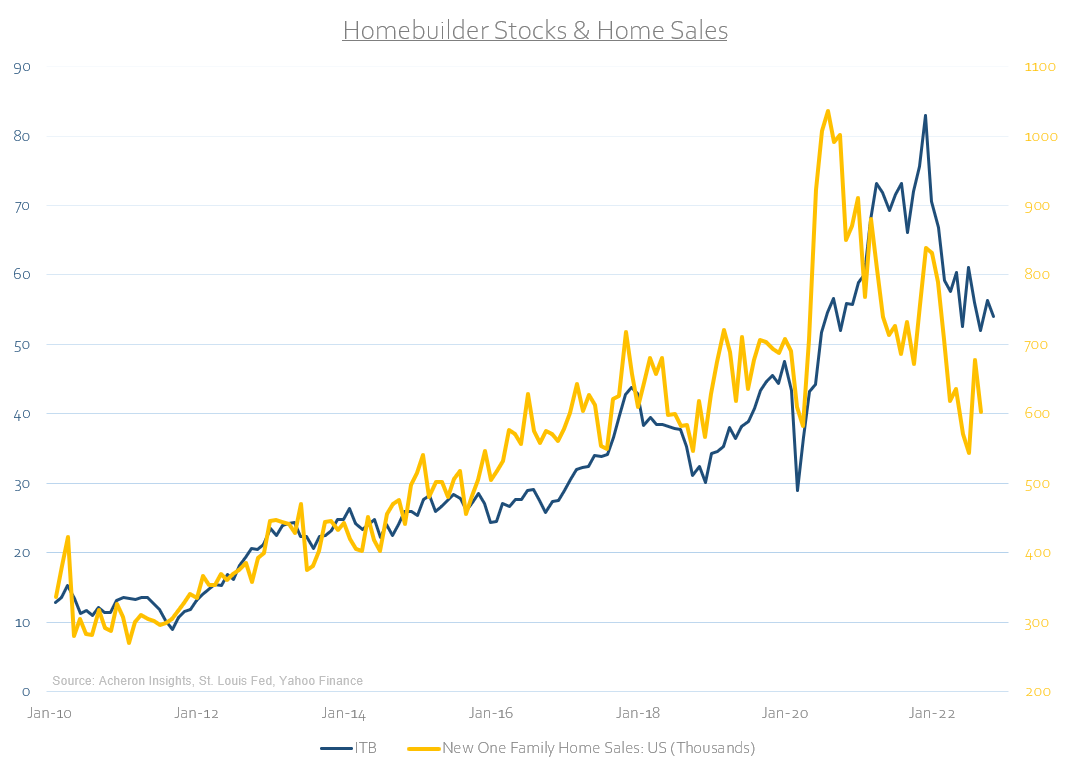
Furthermore, another close relationship that can be observed is the path of home sales and the performance of the ITB homebuilders’ ETF. Home sale too suggests further downside is on the cards for homebuilder stocks.
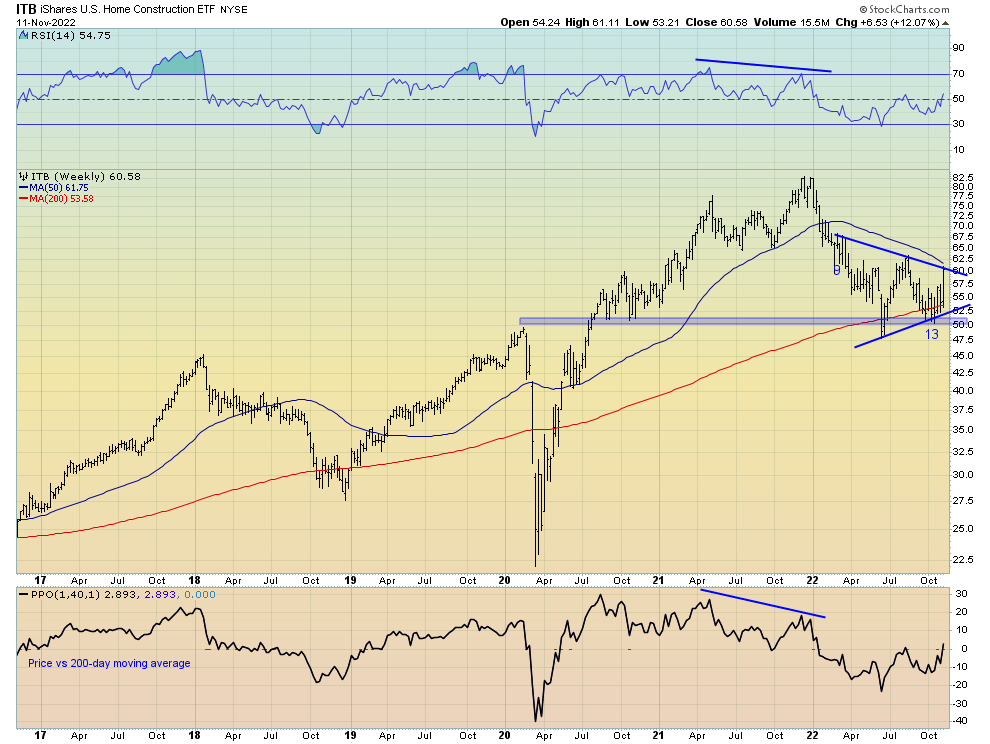
From a technical perspective, the ITB ETF was one of the primary beneficiaries of the downside surprise in CPI this past week, gaining by more than 10% during the market rally. This big move higher came on the back of a weekly 9-13 DeMark sequential buy signal and from a significant level of technical support around the $50-$52 area. This move higher now puts the current price just below the current downtrend line/50-week moving average, marking important overhead resistance levels, all the while seemingly in the process of forming a symmetrical wedge patter. Such technical structures are usually continuation patterns, and if this holds true then a break of the lower trend line could be the impetus for a big move lower should the $50 support level also fail. Much of this will depend on the path of interest rates in the coming months.
It is also important to remember that homebuilder stocks are forward-looking by nature, and should yields begin to roll over, homebuilders will look to quickly price in any pull-back in mortgage rates at a moment’s notice.
On a positive note
To finish off, I must stress what is happening currently in the housing market is not a 2008-like event. Whilst the path of this housing downturn will depend on the leading indicators of housing in mortgage rates, demand and supply, it is the household sector’s ability to withstand a housing downturn that will likely determine the severity of the downturn. Fortunately, the news on this front is positive.
As I detailed here, the household sector is on very solid footing, a fact being underappreciated by many market commentators and analysts alike. Indeed, household mortgage debt to GDP and housing loan to value ratios are both at 20-year lows; mortgage debt service payments as percentage of disposable income is at 40-year lows; household and mortgage debt as a percentage of disposable income is at 20-year lows; while household net worth to GDP and household checkable deposits are both well above trend.
While these measures of consumer and household health will likely inflect lower as the growth slowdown persists, they place the household sector on solid footing and in a far better position to weather a housing market downturn than was the case during the Great Financial Crisis.
This won’t stop a housing market downturn, but it will greatly reduce the severity.
Be the first to comment