


gece33
The Dividend Achievers are companies that have increased their annual regular cash dividend payments for at least each of the last ten consecutive calendar or fiscal years. A trademarked property of the Nasdaq, the Dividend Achievers are tracked under license by several exchange-traded funds, including Invesco’s PFM.
With strong competitive advantages and years of cash flow growth, Dividend Achievers are committed to enhancing shareholder value through the return of capital to shareholders. The very best Dividend Achievers will go on to join the Dividend Aristocrats, which have grown sufficiently to be included in the S&P 500 index and have dividend increase streaks of at least 25 years.
In this article, I present the highest quality Dividend Achievers based on Quality Snapshots, an eloquent system presented by David Van Knapp for assessing the quality of dividend growth [DG] stocks. The system employs five quality indicators from independent sources and assigns 0-5 quality points to each quality indicator for a maximum score of 25 quality points.
I decided to use a variation of the original Quality Snapshots system to find the highest quality DG stocks among the Dividend Achievers. The variation uses Value Line’s Price Stability instead of Value Line’s Safety Rank.
To identify the highest quality Dividend Achievers, I considered only Dividend Achievers scoring at least 20 out of 25 points and only ones scoring in the top two categories of all five quality indicators. In August, I used a similar approach to identify The Highest Quality Dividend Growth Stocks in 2022.
Quality Scoring
The original Quality Snapshots system uses quality indicators from four trusted sources: Value Line, Morningstar, S&P Global, and Simply Safe Dividends. The quality indicators used are:
- Value Line [VL] Safety Rank
- Value Line [VL] Financial Strength rating
- Morningstar [M*] Economic Moat
- S&P Global [S&P] Credit Ratings
- Simply Safe Dividends [SSD] Dividend Safety Scores
For this article, I decided to replace VL Safety Rank with VL Price Stability. The reason is VL Safety Rank is actually an average of the VL Financial Strength rating (the second quality indicator) and VL Price Stability. By implication, the original Quality Snapshots system assigned 7.5 quality points to VL Financial Strength rating and 2.5 quality points to VL Price Stability. With this change, all five quality indicators have the same weight and contribute up to five quality points to each stock’s quality score.
VL Price Stability is based on a ranking of the standard deviation (a measure of volatility) of weekly percent changes in the price of a company’s stock over the last five years. It is reported on a scale of 100 (highest) to 5 (lowest) in increments of 5.
VL Financial Strength measures a company’s financial condition and is reported on a scale of A++ (highest) to C (lowest) in nine steps. To assign ratings, VL considers factors such as balance sheet strength, corporate performance, market capitalization, and stability of returns.
M* Economic Moat is a proprietary data point that reflects the strength and sustainability of a company’s competitive advantage. A wide-moat company can sustain its competitive advantage for at least 20 years, whereas a narrow-moat company can do so for at least 10 years.
S&P Credit Ratings are designed to help investors determine investment risks. Ratings are either investment grade (AAA through BBB–) or speculative (BB+ through D).
SSD Dividend Safety Scores are based on more than a dozen fundamental metrics that influence the ability of companies to continue paying dividends:
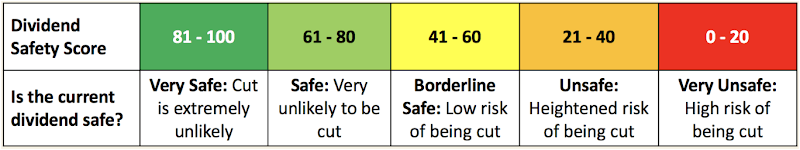
Simply Safe Dividends
Here is the adjusted Quality Snapshots system and quality points assigned to different ranks, ratings, and scores per quality indicator:

Created by the author
Generally, 5 points are assigned to the highest ranks and best ratings, so the highest quality stocks would get 5 points on every factor for a maximum score of 25 points.
Some quality indicators do not map to every point in the scoring system. For example, M*’s economic moat rating distinguishes between wide, narrow, and no moats. The scoring system assigns 5 points for Wide moats, 4 points for Narrow moats, and 2 points for No moats.
For S&P credit ratings, points are only awarded for investment-grade stocks. A stock gets either 5, 4, 3, or 0 depending on its credit rating, or 0 if it doesn’t have a credit rating. Some stocks do not have credit ratings, including stocks with no or little debt. In such cases, the scoring system assigns 4 points to stocks with a Debt/Capital of less than 10%.
I assigned scores to different VL Price Stability ranks to somewhat match the distribution of scores of VL Safety Rank but elected to penalize the lowest price stability ranks by shifting them down one row.
Highest Quality
To screen for the highest quality Dividend Achievers, I’m considering only stocks that appear in the top two scoring categories of all five quality indicators, as illustrated in the following image:

Created by the Author
The top-scoring stocks received 5 points for every quality indicator, for a maximum score of 25 points. The lowest qualifying stocks received 4 points for every quality indicator, for a total of 20 points.
Key Metrics and Buy Below Prices
Below, I’m presenting tables for each qualifying score (25 points down to 20 points). Stocks are presented in rank order.
Each table presents key metrics of interest to DG investors and the five quality indicators.
-
Yrs: years of consecutive dividend increases
-
Qual: quality score out of 25
-
Fwd Yield: forward dividend yield for a recent share Price
-
5-Avg Yield: 5-year average dividend yield
-
5-DGR: 5-year compound annual growth rate of the dividend
-
5-YOC: the projected yield on cost after five years of investment
-
C#: Chowder Number, a popular metric for screening dividend growth stocks
-
5-TTR: 5-year compound trailing total returns
-
Buy Below: my risk-adjusted buy-below price
-
–Disc +Prem: discount or premium of the recent share Price to my Buy Below price
-
Price: recent share price
|
Color-coding
|
I use a survey approach to estimate fair value [FV], collecting fair value estimates and price targets from several online sources such as Morningstar, Finbox, and Portfolio Insight. Additionally, I estimate fair value using each stock’s five-year average dividend yield. With up to 11 estimates and targets available, I ignore the outliers (the lowest and highest values) and use the average of the median and mean of the remaining values as my FV estimate.
My risk-adjusted Buy Below prices allow premium valuations for the highest-quality stocks but require discounted valuations for lower-quality stocks:
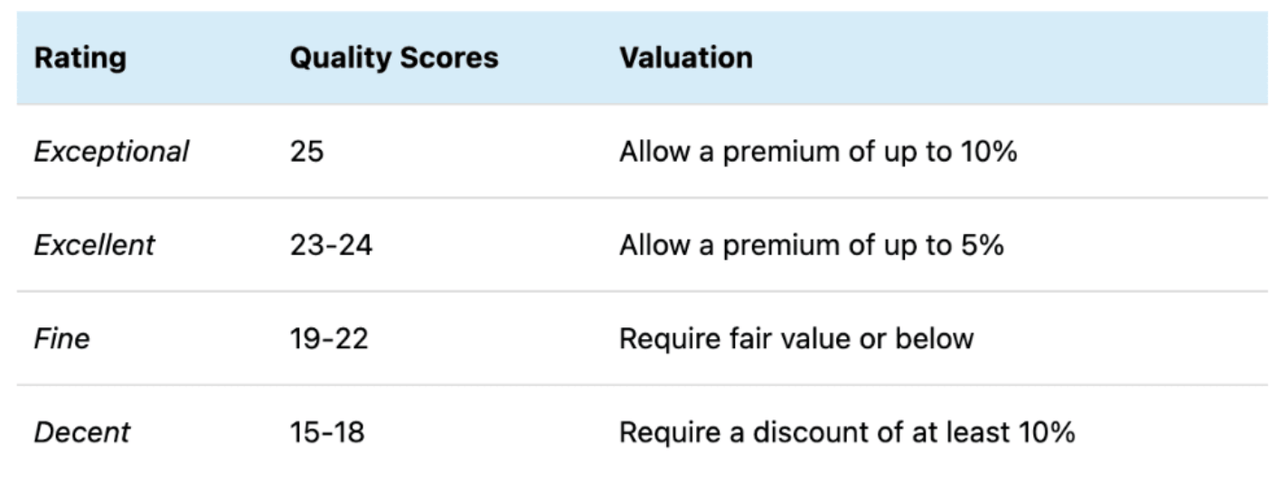
Created by the author
My Buy Below prices recognize that the highest-quality stocks rarely trade at discounted valuations. As a dividend growth investor with a long-term investment horizon, I’m more interested in owning higher-quality stocks than getting a bargain on lower-quality stocks.
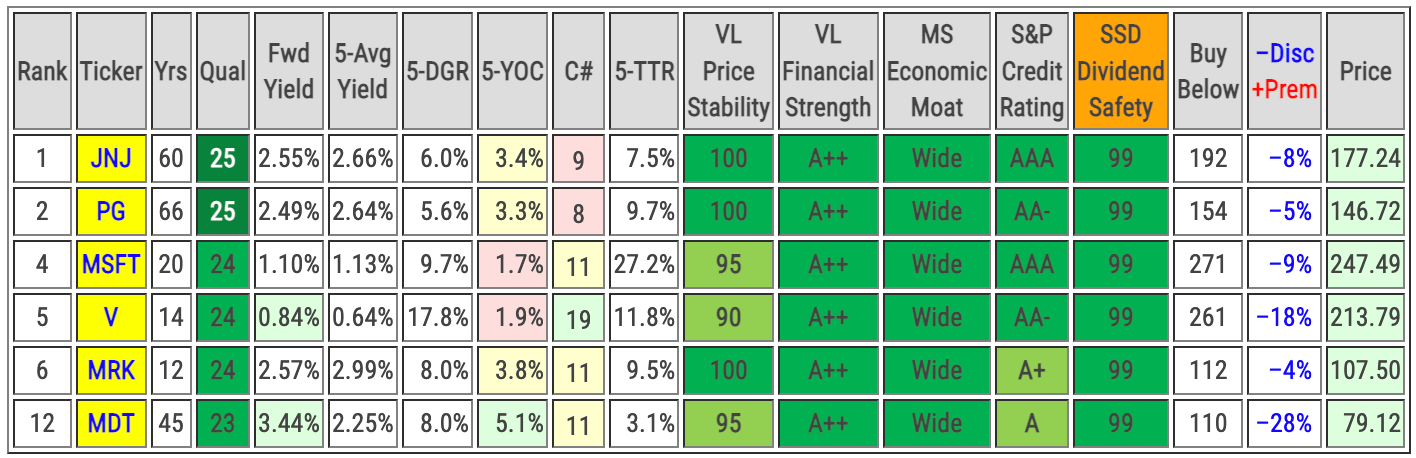
Dividend Achievers Scoring 25 Points
This elite group of stocks earned the top scores for every quality indicator, scoring a perfect 25 out of 25 points. I rate these stocks as Exceptional.
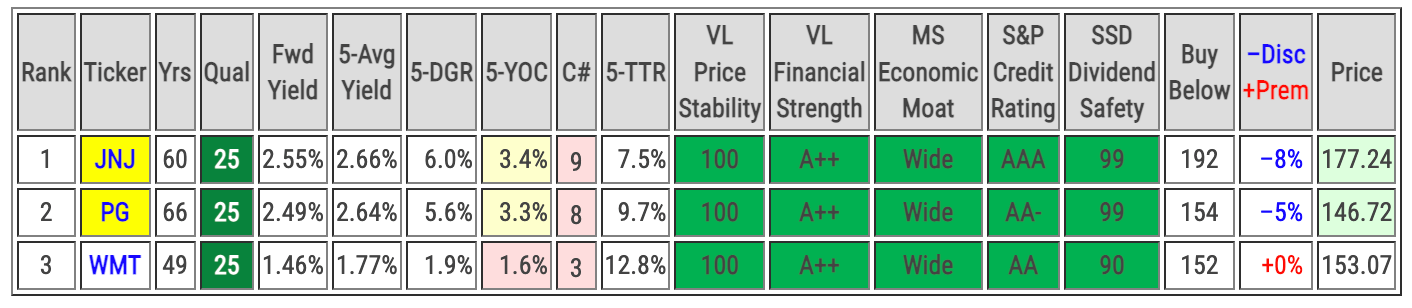
Created by the author
| Rank | Company (Ticker) | Sector | Supersector |
| 1 | Johnson & Johnson (JNJ) | Health Care | Defensive |
| 2 | Procter & Gamble (PG) | Consumer Staples | Defensive |
| 3 | Walmart (WMT) | Consumer Staples | Defensive |
Dividend Achievers Scoring 24 Points
The stocks in the second group missed a perfect score by not scoring five points on one of the quality indicators. This is indicated in the table with lighter green cells. I rate stocks with quality scores of 22-23 as Excellent.

Created by the author
| Rank | Company (Ticker) | Sector | Supersector |
| 4 | Microsoft (MSFT) | Information Technology | Sensitive |
| 5 | Visa (V) | Information Technology | Sensitive |
| 6 | Merck (MRK) | Health Care | Defensive |
| 7 | Costco Wholesale (COST) | Consumer Staples | Defensive |
| 8 | Automatic Data Processing (ADP) | Information Technology | Sensitive |
| 9 | PepsiCo (PEP) | Consumer Staples | Defensive |
| 10 | Accenture plc (ACN) | Information Technology | Sensitive |
| 11 | Cisco Systems (CSCO) | Information Technology | Sensitive |
Dividend Achievers Scoring 23 Points
These stocks failed to score the highest points on two quality indicators. As mentioned above, I rate stocks with quality scores of 22-23 as Excellent.
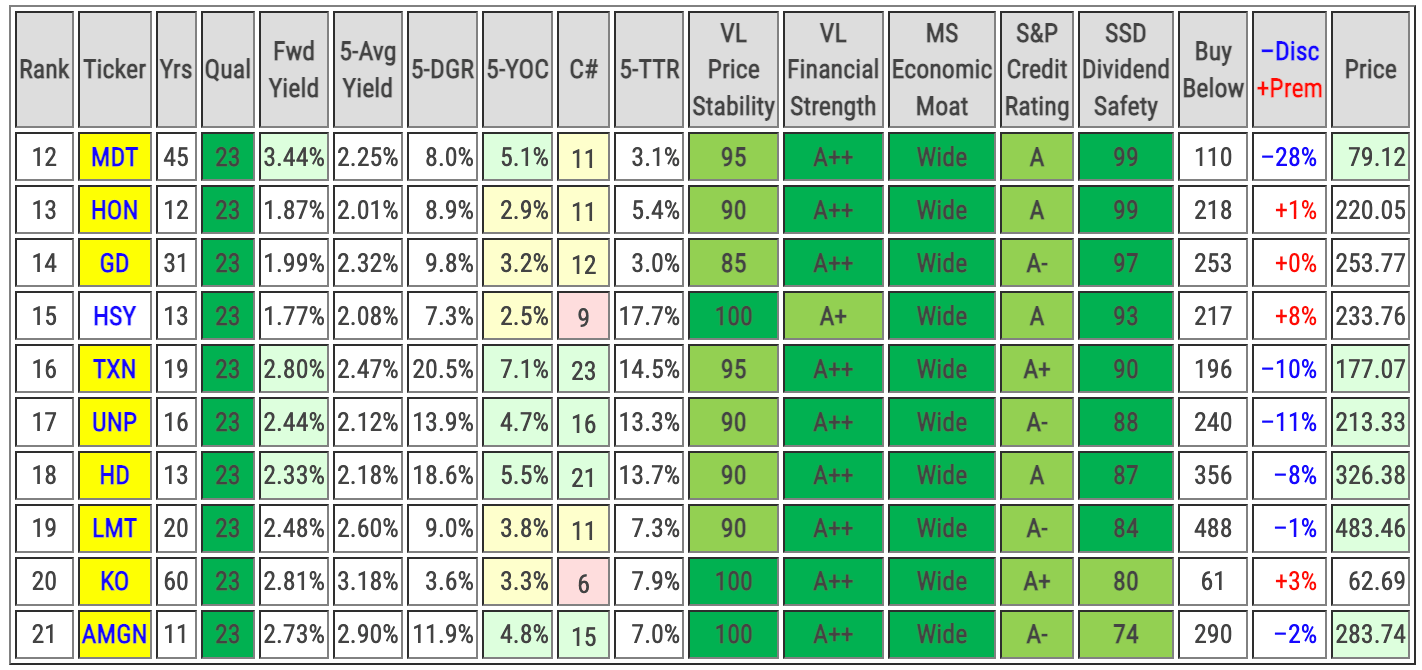
Created by the author
| Rank | Company (Ticker) | Sector | Supersector |
| 12 | Medtronic plc (MDT) | Health Care | Defensive |
| 13 | Honeywell International (HON) | Industrials | Sensitive |
| 14 | General Dynamics (GD) | Industrials | Sensitive |
| 15 | Hershey (HSY) | Consumer Staples | Defensive |
| 16 | Texas Instruments (TXN) | Information Technology | Sensitive |
| 17 | Union Pacific (UNP) | Industrials | Sensitive |
| 18 | Home Depot (HD) | Consumer Discretionary | Cyclical |
| 19 | Lockheed Martin (LMT) | Industrials | Sensitive |
| 20 | Coca-Cola (KO) | Consumer Staples | Defensive |
| 21 | Amgen (AMGN) | Health Care | Defensive |
Dividend Achievers Scoring 22 Points
The stocks in this group failed to score the highest points on three quality indicators. I rate stocks with quality scores of 19-22 as Fine.

Created by the author
| Rank | Company (Ticker) | Sector | Supersector |
| 22 | UnitedHealth (UNH) | Health Care | Defensive |
| 23 | Hormel Foods (HRL) | Consumer Staples | Defensive |
| 24 | Air Products and Chemicals (APD) | Materials | Cyclical |
| 25 | Comcast (CMCSA) | Communication Services | Sensitive |
| 26 | Illinois Tool Works (ITW) | Industrials | Sensitive |
| 27 | American Electric Power (AEP) | Utilities | Defensive |
| 28 | Bristol Myers Squibb (BMY) | Health Care | Defensive |
| 29 | Pfizer (PFE) | Health Care | Defensive |
Dividend Achievers Scoring 21 Points
These stocks failed to score the highest points on four quality indicators. As mentioned, I rate stocks with quality scores of 19-22 as Fine.
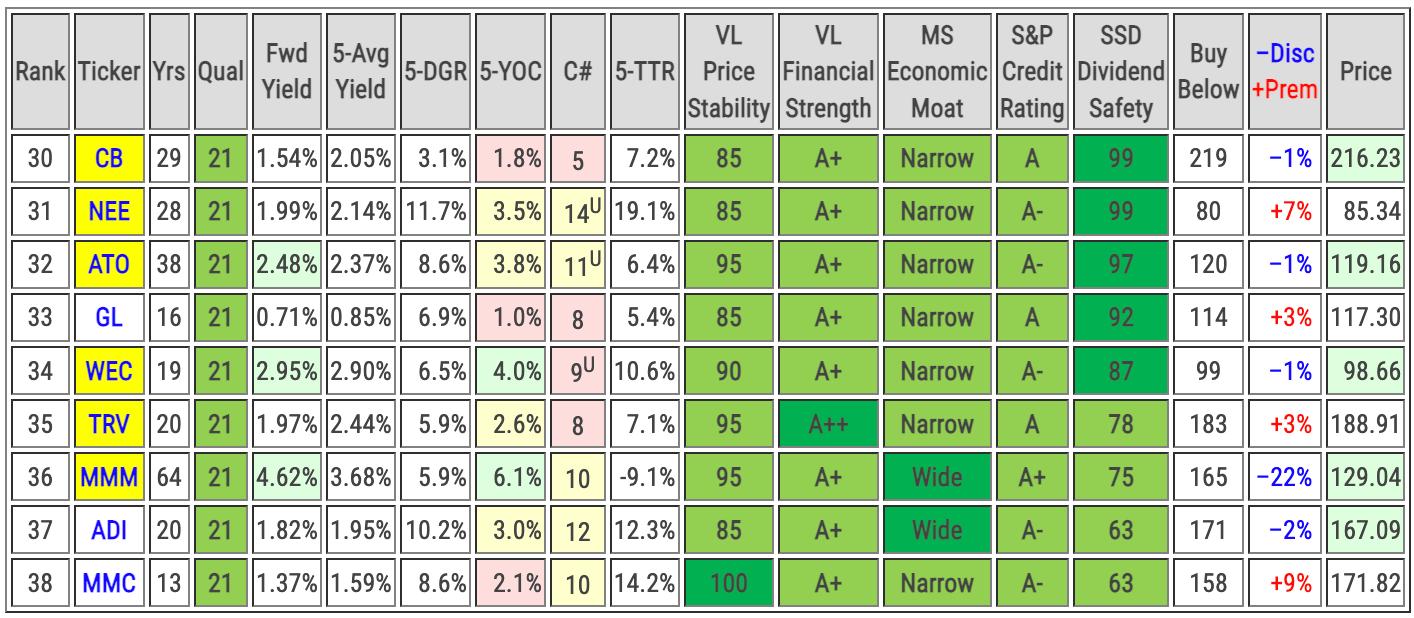
Created by the author
| Rank | Company (Ticker) | Sector | Supersector |
| 30 | Chubb (CB) | Financials | Cyclical |
| 31 | NextEra Energy (NEE) | Utilities | Defensive |
| 32 | Atmos Energy (ATO) | Utilities | Defensive |
| 33 | Globe Life (GL) | Financials | Cyclical |
| 34 | WEC Energy (WEC) | Utilities | Defensive |
| 35 | Travelers (TRV) | Financials | Cyclical |
| 36 | 3M (MMM) | Industrials | Sensitive |
| 37 | Analog Devices (ADI) | Information Technology | Sensitive |
| 38 | Marsh & McLennan (MMC) | Financials | Cyclical |
Dividend Achievers Scoring 20 Points
These stocks failed to score the highest points on all five quality indicators. Stocks with quality scores of 19-22 are rated as Fine.
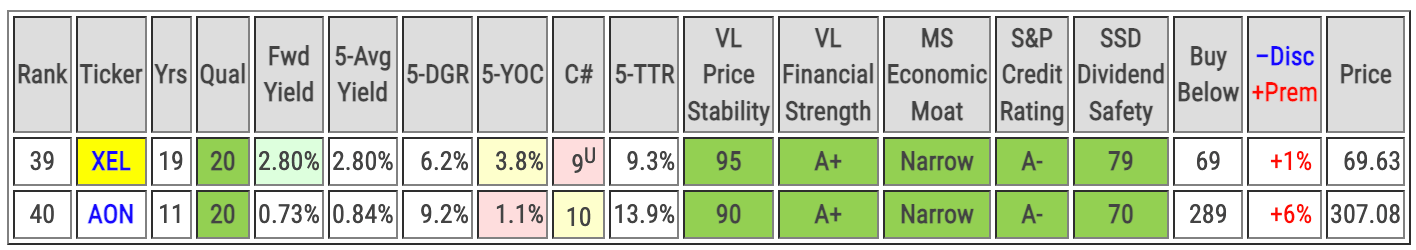
Created by the author
| Rank | Company (Ticker) | Sector | Supersector |
| 39 | Xcel Energy (XEL) | Utilities | Defensive |
| 40 | Aon plc (AON) | Financials | Cyclical |
Observations
Of the 371 Dividend Achievers in my database, only 40 (or 10.8%) survived the stringent quality screens. I call these stocks the Highest Quality Dividend Achievers.
The Highest Quality Dividend Achievers are nearly evenly split between Defensive and non-Defensive sectors (19 to 21 or 47.5% to 52.5%):
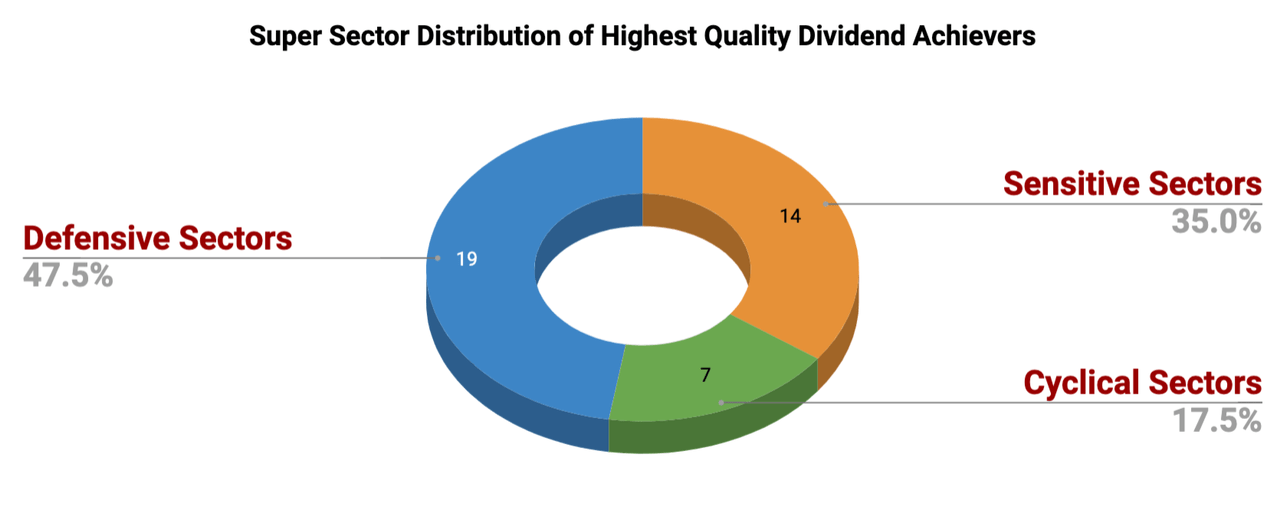
Created by the author
The Consumer Staples, Health Care, and Information Technology sectors each have seven representatives and account for 21 of the 40 stocks, or 52.5%:
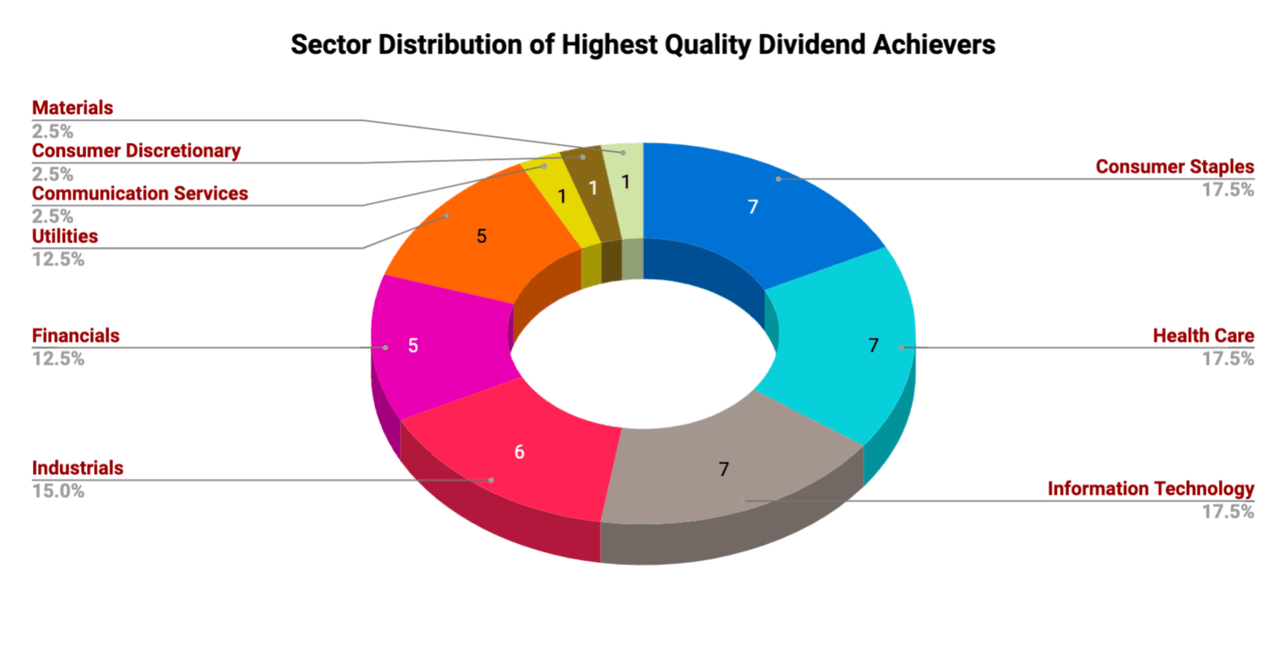
Created by the author
No Energy or Real Estate sector stocks appear in the Highest Quality Dividend Achievers. For information, here are the top-ranked Energy and Real Estate sector Dividend Achievers:
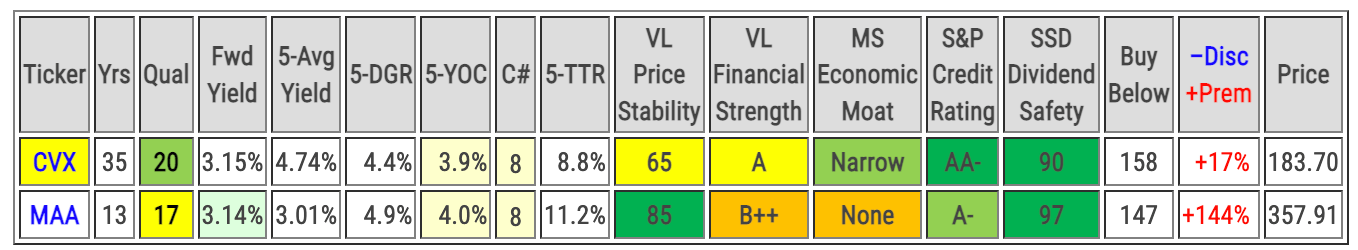
Created by the author
| Company (Ticker) | Sector | Supersector |
| Chevron (CVX) | Energy | Sensitive |
| Mid-America Apartment Communities (MAA) | Real Estate | Cyclical |
While CVX scored 20 points and is rated Fine, its VL scores do not pass my stringent quality screens. MAA fails because of its total score, VL Financial Strength rating, and M* Economic Moat.
Here’s a comparative analysis of an equal-weighted portfolio of the Highest Quality Dividend Achievers, courtesy of Finbox.com:
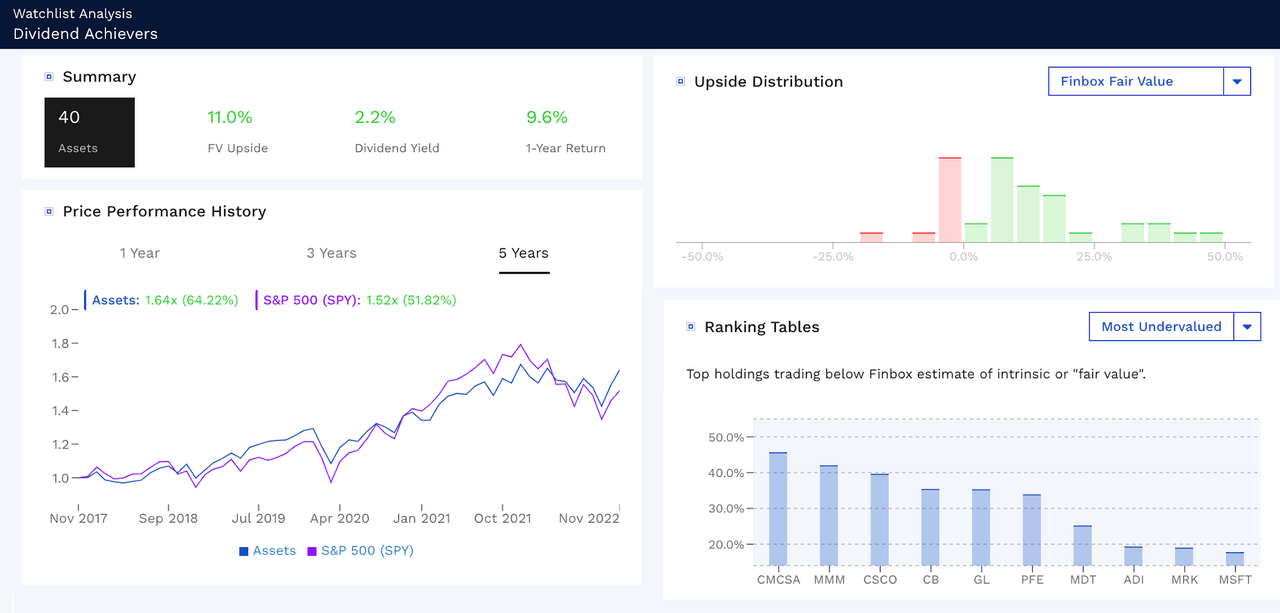
Finbox.com
Finbox.com
Price-performance comparison of highest quality Dividend Achievers to S&P 500 (represented by SPY)
From a price-performance perspective, the portfolio would have outperformed the S&P 500 (as represented by the SPDR S&P 500 Trust ETF (SPY)) over the last five years, returning 64% versus SPY’s 52%.
According to finbox.com, CMCSA, MMM, and CSCO are discounted most relative to fair value.
Opportunities
Let’s now use additional screens to isolate Dividend Achievers with compelling metrics and favorable valuations.
With compelling metrics, I mean stocks with superior growth and income outlooks and stocks offering safe dividends. Stocks with strong recent performance may have the momentum to propel future performance.
Regarding favorable valuations, I look for stocks trading below my risk-adjusted Buy Below prices or stocks whose forward dividend yield exceeds its 5-year average dividend yield.
Best Total Return Prospects
The Chowder Number is a popular metric for screening dividend growth stocks. It sums a stock’s forward yield and 5-year DGR and measures the likelihood that a stock will deliver annualized total returns of at least 8%, according to the Chowder Rule.
Here are the Highest Quality Dividend Achievers sorted by their Chowder Numbers:
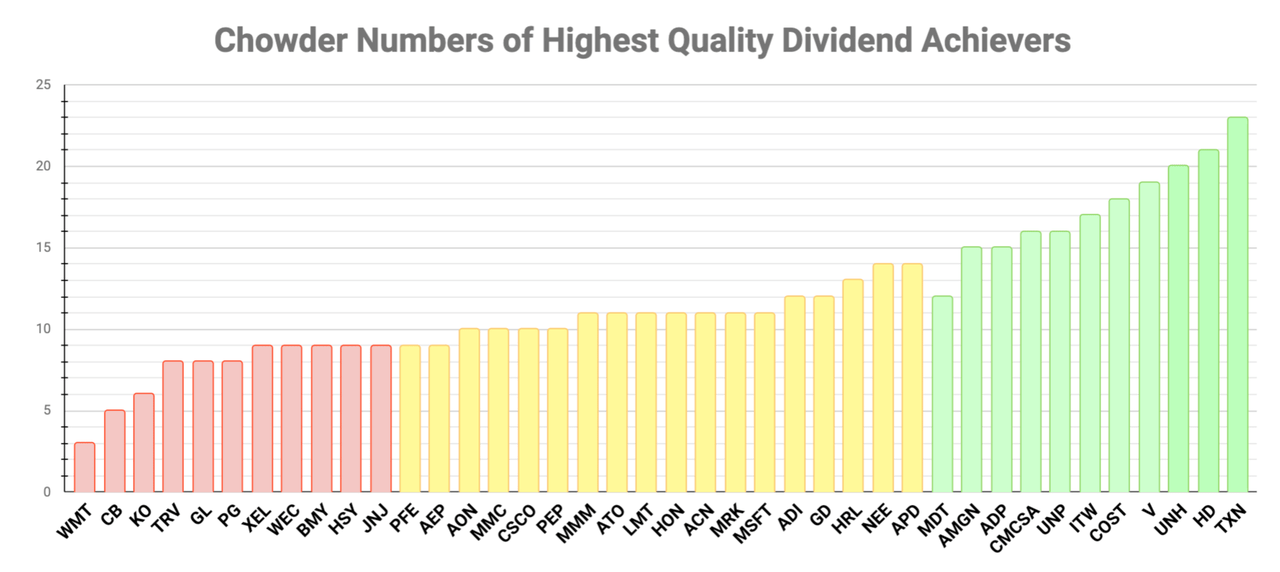
Created by the author (Data Source: Portfolio Insight)
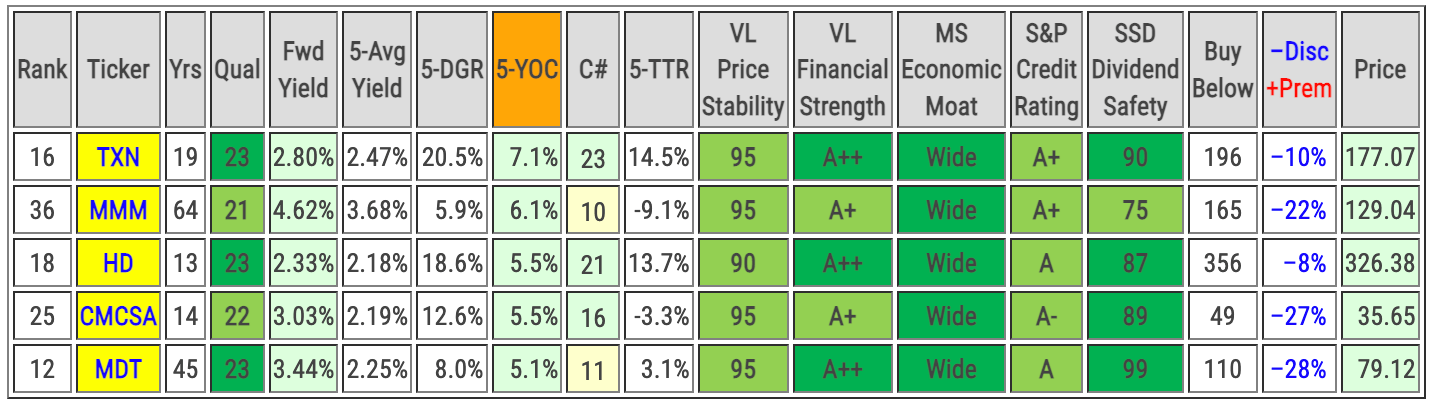
Let’s consider the top five discounted stocks when sorted by C#:

Data Sources: Portfolio Insight, Value Line, Morningstar, S&P Global, and Simply Safe Dividends
Texas Instruments (TXN) tops the list with a C# of 23.
High Chowder Numbers are often due to high 5-year dividend growth rates. When using the Chowder Number to predict total returns, remember that future dividend increases may be more modest. Not many stocks can maintain high dividend growth rates for an extended time.

Portfolio Insight
TXN’s dividend growth history is impressive, and its earnings are growing at a 5-year CAGR of 20.5%! TXN’s stock price has dropped about 14% from its 52-week high, and it looks pretty attractive now. Portfolio Insight has an upside of 9% on a 1-year target price of $192.64.
Best Income Prospects
The 5-year Yield on Cost [YOC] is an income-oriented metric indicating your YOC after you buy a stock and hold it for five years, assuming the same 5-year DGR is maintained. I look for a 5-year YOC of at least 4.0%.
To calculate the 5-year yield on cost is easy:
5-YOC = Fwd Yield × (1 + 5-DGR)5
Here are the Highest Quality Dividend Achievers sorted by the 5-year yield on cost metric:

Data Source: Portfolio Insight
Let’s consider the top five discounted stocks when sorted by 5-YOC:
Data Sources: Portfolio Insight, Value Line, Morningstar, S&P Global, and Simply Safe Dividends
Texas Instruments tops the list with a 5-YOC of 7.1%, mainly thanks to its forward yield and high 5-year DGR.
In calculating the 5-YOC, we assume the same 5-year DGR will be maintained. To see if maintaining the same 5-year DGR is likely, one should cross-check the 5-year DGR against the stock’s revenue growth rate, earnings growth rates, and payout ratio.
| Ticker | 5-YOC | 5-DGR | 5-yearRevenue CAGR | 5-year Non-GAAP EPS CAGR | Non-GAAP EPS Payout Ratio |
| TXN | 7.1% | 20.5% | 6.5% | 18.7% | 58% |
TXN has a high earnings growth rate, which allows the company to grow its dividends accordingly. However, the company’s revenue growth rate is substantially lower, and its payout ratio is “edging high for semiconductor firms,” according to Simply Safe Dividends. Lower revenue growth rates cannot support high earnings growth rates indefinitely. Likewise, the company may opt for more modest dividend increases to improve its payout ratio.
Safest Stocks
I strongly favor DG stocks deemed Very Safe or Safe by Simply Safe Dividends. Nobody likes seeing a dividend cut or suspension soon after investing in a DG stock, so targeting the safest candidates is a good strategy.
Here are the Highest Quality Dividend Achievers sorted by Dividend Safety Scores:

Data Source: Simply Safe Dividends
Let’s look at the top six stocks when sorted by SSD Divi Safety and Qual:
Data sources: Portfolio Insight, Value Line, Morningstar, S&P Global, and Simply Safe Dividends
Medtronic plc looks interesting here, as its forward dividend yield exceeds its 5-year average dividend yield by 53%, and it is discounted most relative to my risk-adjusted Buy Below price.
The following P/E Fair Value and Yield Fair Value charts show that MDT is trading well below its Undervalue Price (green line). Portfolio Insight has an upside of 29% on a 1-year target price of $101.68.

Portfolio Insight
MDT offers an excellent opportunity for DG investors looking for very safe dividends.
Highest Total Trailing Returns
While it remains true that past performance is no guarantee of future results, I like to consider the 5-year TTR of candidates. There’s something to be said for momentum, especially for stable, blue-chip dividend growth companies.
Here are the Highest Quality Dividend Achievers sorted by the 5-year trailing total returns:

Data Source: Portfolio Insight
Let’s look at the top five discounted stocks when sorted by 5-TTR:
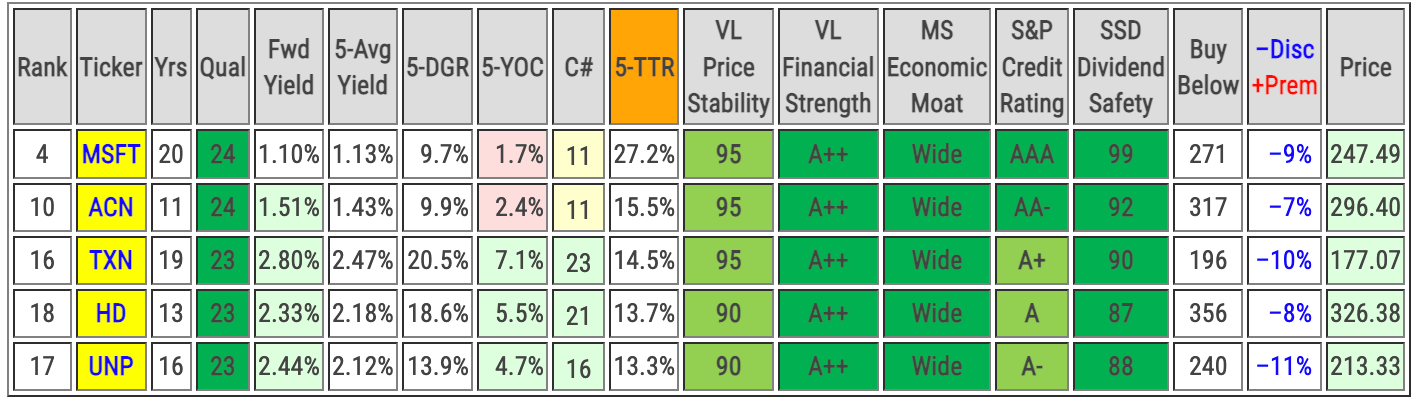
Data sources: Portfolio Insight, Value Line, Morningstar, S&P Global, and Simply Safe Dividends
Microsoft tops the list with a 5-year TTR of 27.2%. While TXN, HD, and UNP have more modest 5-TTRs, these stocks are stronger candidates given their favorable 5-DGR and 5-YOC metrics.
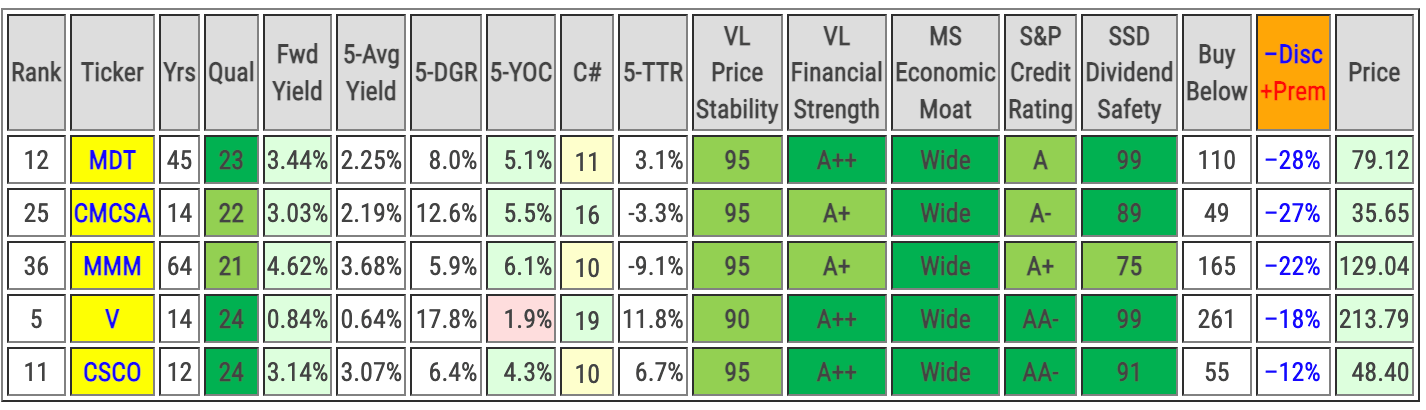
Stocks Discounted Most
When a stock is discounted, early investors will benefit when the market finally recognizes the stock’s true value. So it is worthwhile to consider the highest discounts among the Dividend Achievers.
Here are the Highest Quality Dividend Achievers sorted by their discount to my risk-adjusted Buy Below price:
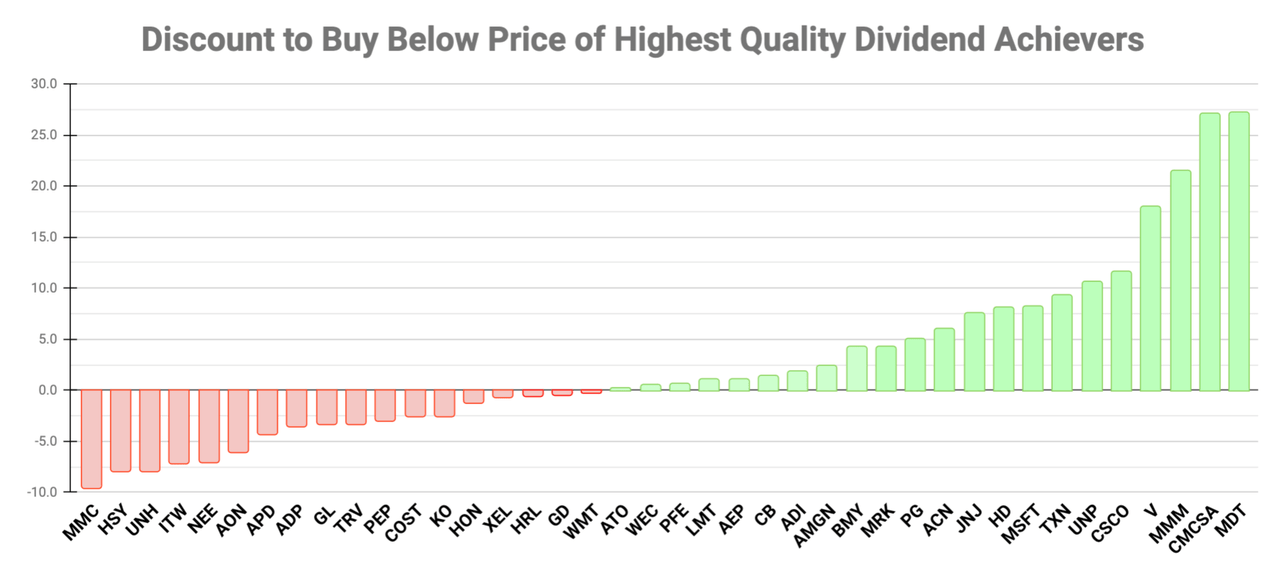
Data Source: Author’s Fair Value Assessment
Let’s consider the top five stocks sorted by their discount to my Buy Below price:
Data sources: Portfolio Insight, Value Line, Morningstar, S&P Global, and Simply Safe Dividends
Stocks available at deep discounts need particular scrutiny as there may be good reasons for their undervaluations. This is particularly true for stocks with poor historical performance, such as MMM and CMCSA, with their negative 5-year TTRs.
Medtronic and Comcast present good opportunities for value investors. Both stocks have forward yields that top their respective 5-year average yields (by 53% and 38%, respectively), indicating that these stocks are trading at significant discounts to their dividend yield histories.
Conclusion
In this article, I presented the 40 highest-quality DG stocks among 371 Dividend Achievers. To assess the quality of candidates, I used a variation of Quality Snapshots in which I replaced Value Line’s Safety Rank with Value Line’s Price Stability. The variation assigns equal weights to each of the five quality indicators.
Quality is not the only factor to consider when selecting candidates for investment. The stock’s valuation is important, too. To assist readers, the tables in this article provide my risk-adjusted Buy Below prices and a column indicating how much the stock’s price is discounted or at a premium to my Buy Below price.
Other factors to consider include dividend yield and dividend growth rate, total return performance, and income and growth prospects.
I’ve highlighted a few stocks trading below my risk-adjusted Buy Below prices that also offer compelling metrics.
Here are some candidates to consider depending on your investment style:
- For income: TXN (and perhaps MMM for its high yield)
- For growth: TXN, HD, and UNP
- For safety: MDT
- For value: MDT and CMCSA
As always, I recommend doing your own due diligence before investing in any stock covered in this article.
Thanks for reading, and happy investing!
Be the first to comment