


Sergey_P/iStock via Getty Images
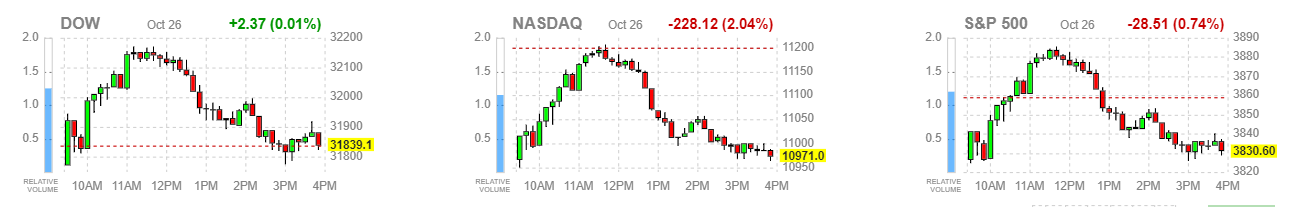
Yesterday’s market action was extraordinarily unusual from the standpoint that five bellwether stocks, which account for approximately 25% of the entire S&P 500’s value, were all down meaningfully, resulting in a more than 2% loss for the Nasdaq Composite. Yet the Dow Jones Industrials closed in positive territory. That has only happened on six trading days over the past 10 years.
Finviz
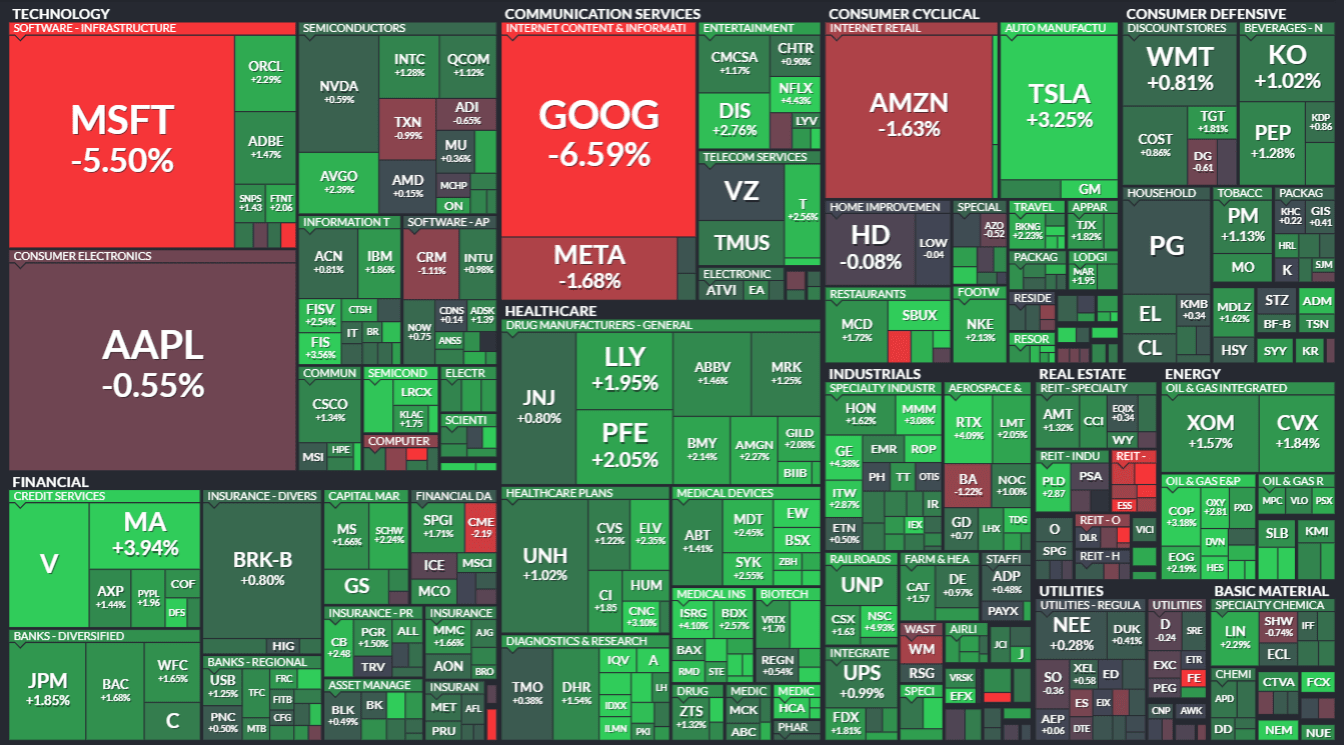
I thought the performance of Microsoft and Google, following earnings report disappointments, would have dictated action in the broad market yesterday, but I was wrong. Below is the heat map for the S&P 500 constituents at around noon, showing how investors didn’t seem to care about the shortfalls in revenue and earnings for the megacap technology-related names that dominate the index. Instead, they bought practically every other stock around them. As the losses for these market leaders worsened, they did drag more names into the red, but the stark contrast still stood strong.
Finviz
It looks as though we are seeing the same dynamic occur this morning after the bomb Facebook dropped on investors last night. Despite a disappointing revenue outlook, Mark Zuckerberg still plans to spend close to $100 billion on his virtual world. I prefer the real one. That is resulting in a 20% decline in his stock this morning. Once again, the broad market looks to be holding up rather well. In my view, this a very bullish development that indicates a shift in macroeconomic headwinds, as we begin the seasonally best performing months of the year for the market.
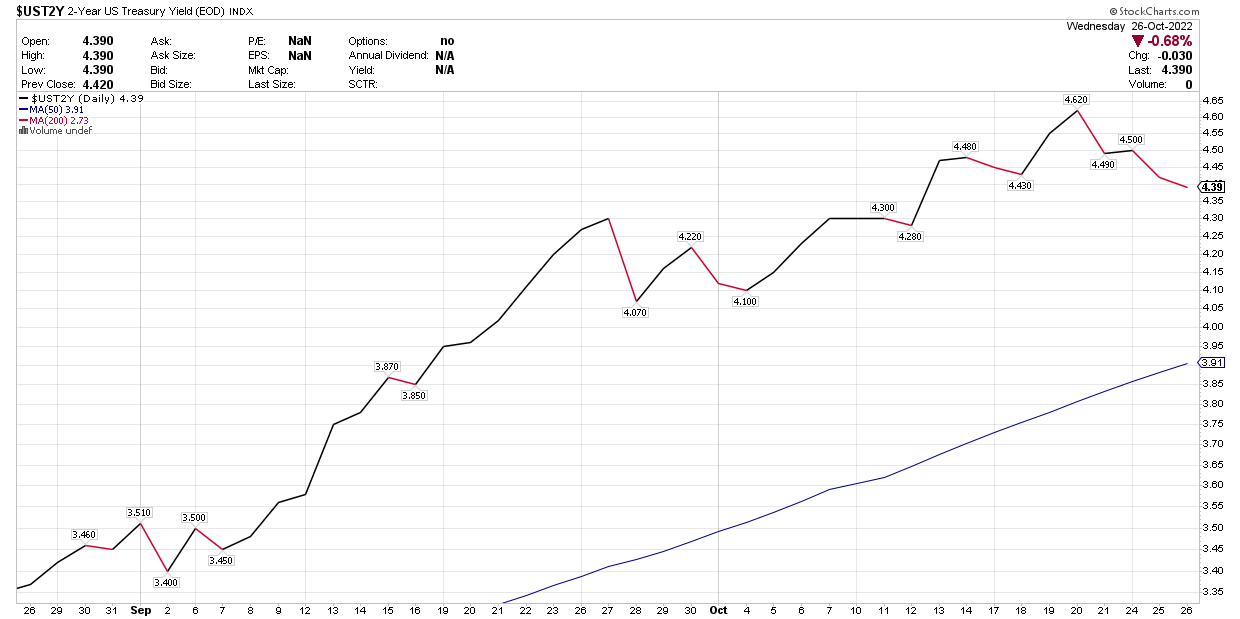
The most important shift is in the 2-year Treasury yield, which is a proxy for where investors see the Fed funds rate one year from now. It has fallen in recent days from a high of 4.62% to 4.39%. That indicates the market sees the Fed being less aggressive in policy next year, which is a positive rate of change for markets.
Stockcharts
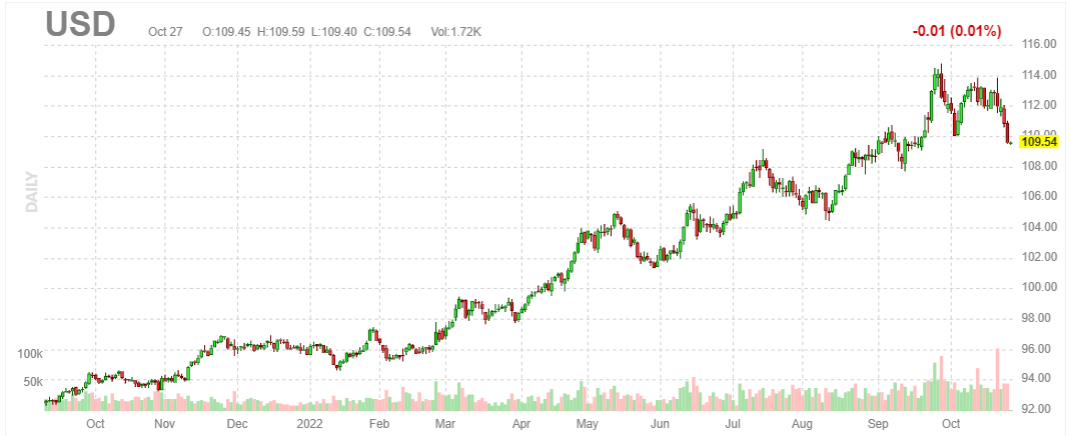
As a result, the dollar is weakening from its September high, which is a huge tailwind for S&P 500 revenue and earnings growth in 2023, provided it continues. Still, it is another positive rate of change for risk assets.
Finviz
What about the abysmal performance of our market leaders? I think it is more indicative of the gradual rotation from growth to value that appears to have started more than a year ago. This rotation tells me that we can realize a more shallow decline in the S&P 500, despite seeing the market leaders underperform, as investors reposition in undervalued names that still have reasonable growth prospects. In other words, this is a stock pickers market.
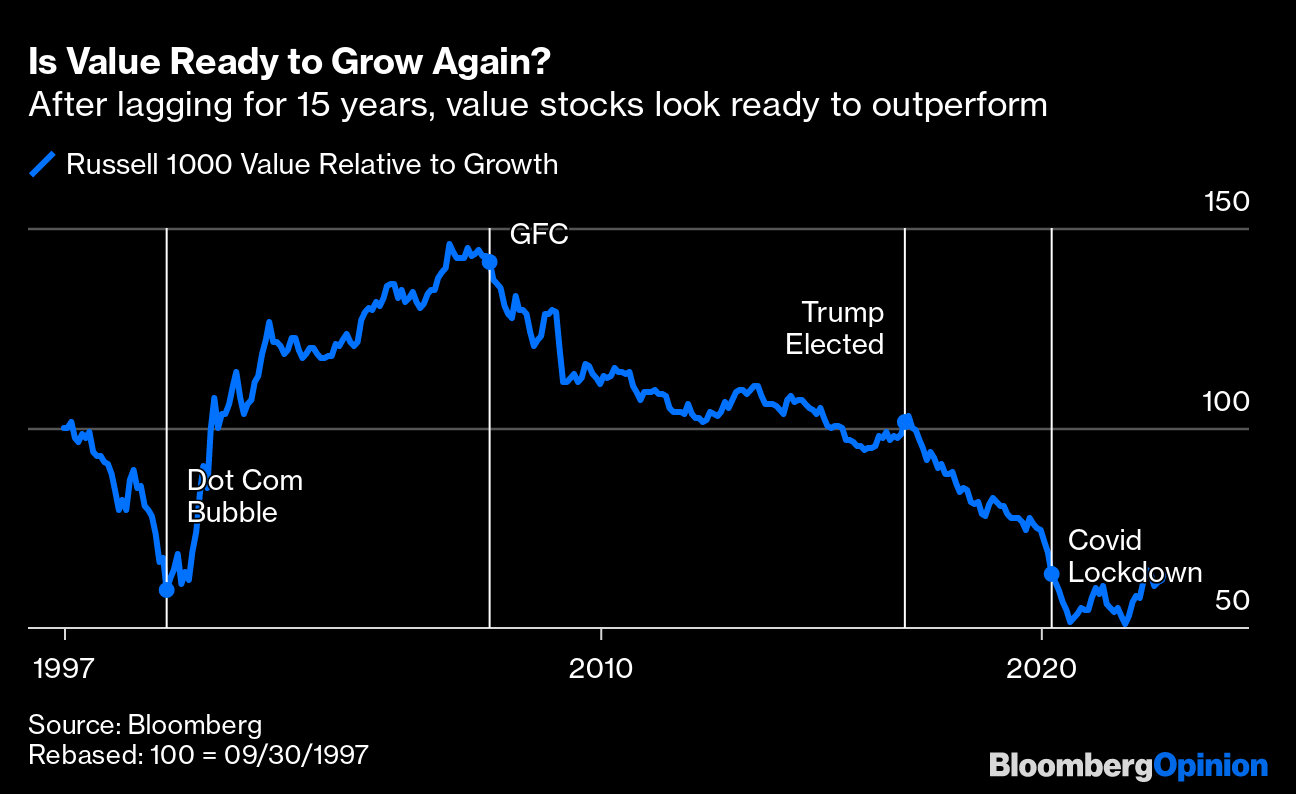
Bloomberg
I am further encouraged by the performance of the more domestically focused Russell 2000 index, which held above its June low when the mega-cap dominated S&P 500 index was falling to new lows.
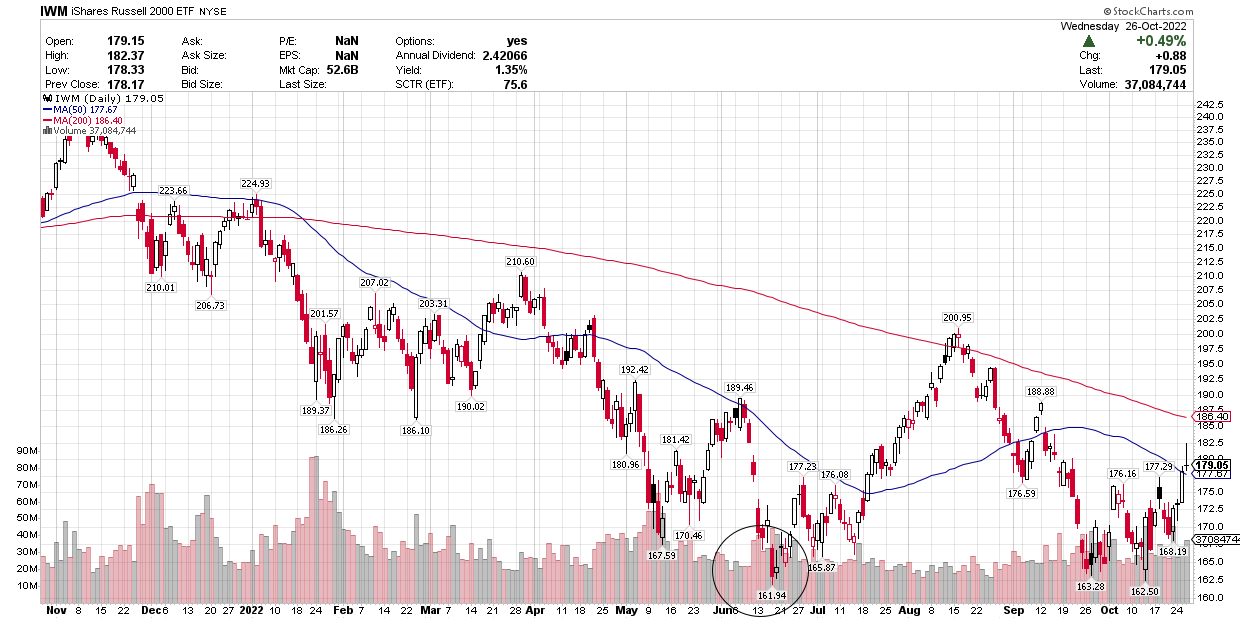
Stockcharts
These positive rates of change embolden my outlook for a strong fourth-quarter recovery in risk asset prices, fueled by a peak Fed funds rate before year end and the continuation of the economic expansion that started in 2020.
Be the first to comment