
Photobuay/iStock via Getty Images
Last week, the Federal Reserve hiked its target Federal Funds rate by 75 Bps, moving its current target rate into a new range of 3.75% to 4.0%. This is the fourth consecutive 75 Bps hike, since June 2022. I read the Fed’s statement and then I watched Chairman Powell’s November 2, 2022 press conference live. The statement read less hawkish than in the recent past, however the accompanying press conference sounded very hawkish. Given the high frequency data, which I would argue clearly indicates inflation has peaked, combined with the well-known understanding that rapid interest rate increases work with a lag, I continue to be befuddled by the Fed’s thought process.
Although, on October 11, 2022, I wrote How We Got Here And The Oceanic Forces The Fed Can’t Control, in today’s piece, I write to explore, in greater detail, the topic of Demographics and the Great Resignation Movement. To be crystal clear, from a policy perspective, I can’t for the life of me work out how getting overly tight (I would argue a Fed Funds rate north of 3% to 3.5% is too tight) will somehow change the demographics of the U.S. labor force or how it would magically change the underlying motivations behind the Great Resignation Movement.
This looks like mis-guided and highly reactive policy.
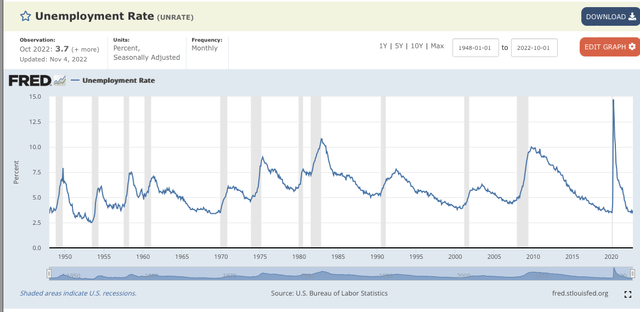
We hear all the time about how the job market is exceptional and how the unemployment rate is sub 4%, something that hasn’t consistently been witnessed since the second half of the 1960s.
Although this is technically true, in reality the picture is more nuanced.
St. Louis Federal Reserve
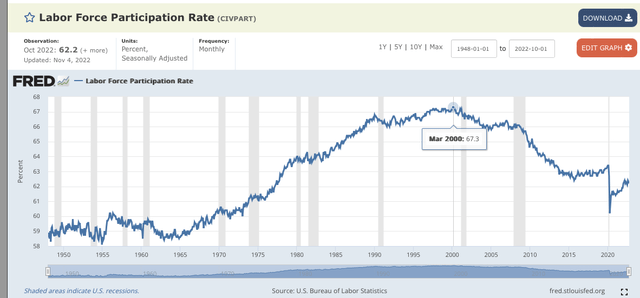
For perspective, when we think about the unemployment rate, it is crucial that we understand the labor force participation rate.
The labor force participation rate peaked on March 2000, at 67.3%, and then essentially has mostly fallen, with a few short term rises that were followed by the next leg lower. In other words, the recent 3.5% and now 3.7% unemployment rate isn’t close, from a relative strength comparison, to the strength of the job market during 1999 and the first half of 2000.
It isn’t even close!
Economic activity and the job market, with a 66% labor force participation rate and sub 4% unemployment rate is markedly differently than a sub 4% unemployment rate and a 62% labor force participation rate.
Labor Force Participation Rate (1948 – Present)
St. Louis Federal Reserve
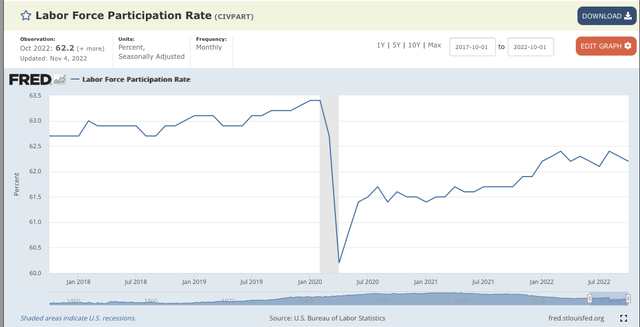
If you look at the labor force participation rate, it was stuck under 62%, for over eighteen months, after the massive Covid shock and then immediate drawdown.
Labor Force Participation Rate (5-Year Chart)
St. Louis Federal Reserve
Well, I would argue that you don’t have to be a rocket scientist to work out that there are two oceanic forces impacting this much lower labor force participation rate: Demographics and the Great Resignation Movement.
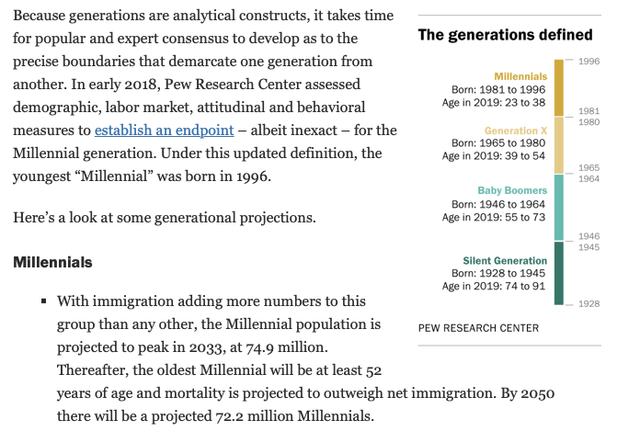
It is estimated that the Baby Boomer generation, people born between 1946 and 1964, is roughly 72.5 million strong.
According to the Pew Research Center, in July 2019, the Millennials, as a cohort, passed Baby Boomers in term of sheer population size.
Pew Research Center
To keep the numbers smooth, it is estimated that nearly 10,000 people in the Baby Boomer generation turn 65 years old, every day. Unless you absolutely have to work for economic reasons, who the heck, aged 65 plus, really wants to work from 7am to 6pm, every day (I’m including the commute times)? The only reason you might keep doing so would most likely be:
1) You love what you do and are well compensated, so it is too hard to walk away (golden handcuffs) or 2) You need the money either directly or to help family members.
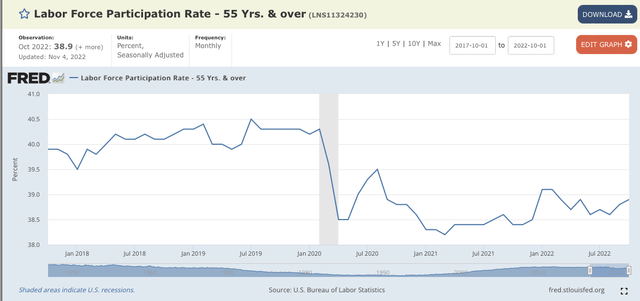
Next, let’s look at labor force participation rate, of people 55 years old and over. As we can clearly see, and this data isn’t perfect, as we would really like to see data stratified by age, as retiring at 55 or 57 is much different than at say 65 or 67, labor force participation rate for 55 years old and over hasn’t really rebounded.
Labor Force Participation Rate (55 Yrs. & over) – 5-Year Data
St. Louis Federal Reserve
So if we do a little more digging, and by the way, this data is readily available, you just need to be intellectually curious and know how to use Google, we learn the following:
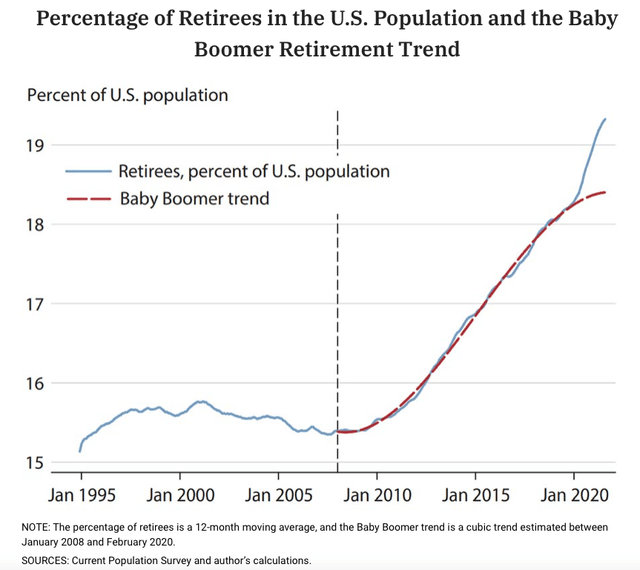
As of August 2021, and according to the work of Miguel Faria-e-Castro, we learn that there were an estimated 2.4 million ‘excess’ retirements, since Covid and as of August 2021.
Senior Economist Miguel Faria-e-Castro sought to answer that question in an Economic Synopses essay published in October, and he found that there were slightly more than 2.4 million “excess” retirements due to the pandemic as of August 2021.
And here is Miguel’s chart:
St. Louis Fed (Miguel Faria-e-Castro)
Therefore, it is crystal clear that the unemployment rate is so low and there are pockets of tightness largely due to demographics.
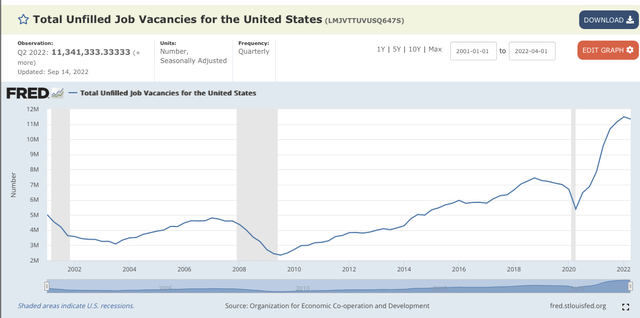
As everything is at the margins, at least in economics, we see the big leg up in total unfilled job vacancies in the United States.
Total Unfilled Job Vacancies
St. Louis Fed
As the St. Louis Fed’s chart is based on quarterly data, again to smooth out the noise in the data, in case you’re wondering, the BLS data, as of November 1, 2022, has an aggregate number that stood at 10.7 million. This is lower than 11.34 million, the Q2 figure, in the St. Louis Fed chart.
On the last business day of September, the number of job openings increased to 10.7 million (+437,000), partially offsetting a sharp decline in August. The rate changed little at 6.5 percent in September but was 0.8 percentage point lower than its peak in March 2022. In September, the largest increases in job openings were in accommodation and food services (+215,000); health care and social assistance (+115,000); and transportation, warehousing, and utilities (+111,000). The number of job openings decreased in wholesale trade (-104,000) and in finance and insurance (-83,000).
Yes, it is elevated, but is coming down.
The Great Resignation Movement
The other big factor that has captured the fancy of the nation, and many journalists, perhaps rightly so, is the Great Resignation Movement.
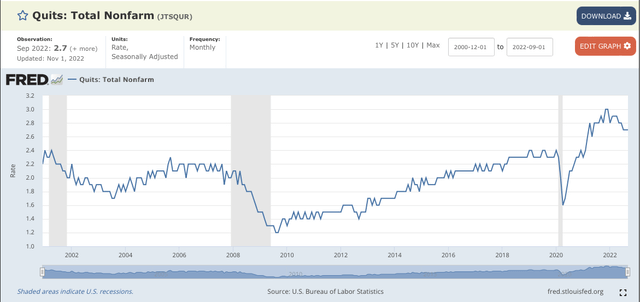
The best way to empirically capture this movement, at least from a simple economic data/ chart perspective, is the JOLTS data.
Quits: Total Nonfarm
St. Louis Fed
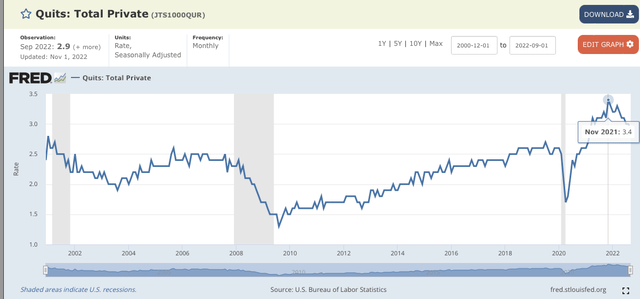
And if we isolate the ‘Total Private’ employer quit rate, we see it peaked in November 2021, at 3.4%, and is now down to 2.9%. And if you look at the chart, it was approaching 2.5% from most of 2005 to 2008 and 2016 until the big Covid shock (February 2020).
Quits: Total Private
St. Louis Fed
And if you are intellectually curious then you can look at the seasonally adjusted data, available at the Bureau of Labor Statistics (BLS).

BLS.gov
Now, writing on the underlying qualitative and quantitive root causes that sparked a Great Resignation Movement would be a lot of fun. However, it is beyond the scope of this piece. If I had to theorize, I would guess that a combination of overly generous and prolonged unemployment benefits, three rounds of stimulus, and people putting their health and family above a paycheck (there was a lot of burn out during Covid).
Putting It All Together
If you listen to Chairman Powell’s November 2, 2022 conference call, if you haven’t already, he is concerned that inflationary forces can get anchored. If they were to become anchored, then it becomes extraordinarily difficult to fight and much more expensive. Secondly, he pointed to the number of job openings and hinted that the underlying strength of the job market could mean that a nasty recession might be avoided, as the labor tightness and openings could cushion the Fed’s very strong medicine. In other words, I would argue the subtext here is, yes, the medicine is potent, but we might thread the needle and avoid a nasty recession, categorized by a big increase in unemployment, because of this starting point in labor tightness.
From my perspective, I’m suggesting neutral Fed Funds Rate is closer to 3% to 3.5%. Furthermore, I’m not sure how the Fed getting way too tight, can change the demographics. If at least 2.4 million retirees left the job market (permanently) whether voluntarily or involuntarily, this a big driver explaining a big piece of the labor tightness. How is the Fed taking its Fed Funds rate up, well beyond neutral, to say a range of 4.5% or 4.75%, going to get 2.4 million retirees to come back into the labor force? And even if they wanted to, who is going to hire them, if they only have plans to work a few more years?
Secondly, another big driver of the labor tightness was the Great Resignation Movement. Yet, we have clear and compelling BLS data, that this wave peaked, in November 2021, and has already crested and starting to come back down. If we zoom out, there were multiple periods where the ‘Quit Rate’ was around 2.5%, so it isn’t nearly as elevated as the media makes it out to be. Either way, the Fed is looking backwards and the Quit Rate should continue to revert back.
In closing, and this is only part one of a multi-part series, I would argue that the Fed is too tight, possibly way too tight. Getting too far above neutral risks inflecting more harm than good. In the next installment, I will discuss the impact of the chip shortages and how that was another big driver of inflation. And, you guessed it, this also isn’t something the Fed can really control.


Be the first to comment