

JimVallee/iStock via Getty Images
Introduction
Last Wednesday, the Fed decided to hike its interest rates by 75bps for the first time since 1994, levitating the FFR to a range of 1.5% to 1.75%. Market expectations changed radically following CPI inflation print the week before, with CPI inflation coming in higher than expected at 8.6% in May (vs. 8.3% exp.). Policymakers also revised their PCE inflation forecast to 5.2% for 2022, up from 4.3% in their March projections.
Powell also signaled another ‘big move’ for the July meeting to continue the fight against inflation, with market split between a 50bps and 75bps hike. According to the Fed CME Watch Tool (figure 1), implied probability for a 75bps hike currently stands at 86.2% (vs. 13.8% for a 50bps hike).
Figure 1
CME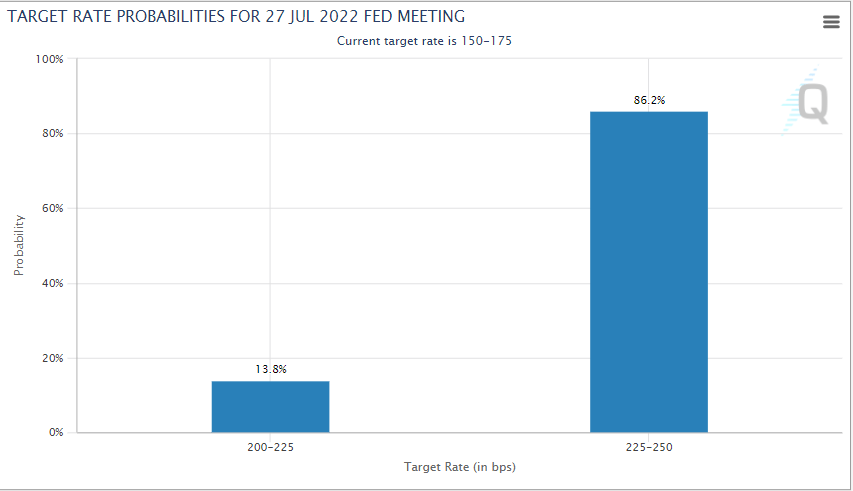
Even though the aggressive response from US policymakers is mostly done to ease the inflationary pressures as inflation continues to accelerate globally, part of the decision has also been done to create some room for the economic downturn, which keeps approaching very rapidly.
Economic outlook Is Worsening
Since the start of the year, we have seen that a range of leading economic indicators have been pricing in a significant deceleration in the economic activity. For instance, OECD ‘diffusion index’, which looks at the percentage of countries with rising Leading Economic Indicator (LEI), is pricing in a significant deceleration in the business activity. Figure 2 shows that OECD ‘diffusion’ index has strongly led global manufacturing PMI by 6 months in the past 25 years, and is currently pricing in a global PMI at 46. The last few times where global manufacturing PMI fell to 46 were in 2001, 2008 and 2020; these periods were associated with significant selloffs in markets.
Figure 2
Bloomberg, OECD, RR
Financial Conditions Also Pricing In Significant Downward Readjustments In the US
Even though the recession risk has been particularly rising in Europe following the Ukraine war, with business surveys pricing in sharp slowdown in the medium term, the economic situation has also been deteriorating significantly in the US.
In addition to the surge in mortgage rates (30Y nearing 6%) pushing homebuilders to slash prices as they are being hit by both a fall in demand (globally) and high material and labor costs, financial conditions have also been pricing in significant downward economic readjustments in the activity.
Figure 3 shows that the dramatic tightening in US financial conditions (YoY) is pricing in further decrease in the ISM manufacturing PMI (proxy for US real economic activity). It is important to know that the relationship between the PMI and US real growth is non linear when PMI falls below 50 (a move from 48 to 46 is usually associated with a bigger impact on economic growth than a move from 50 to 48, etc…).
Figure 3
Bloomberg
What Happened To The ‘Fed Reaction Function’?
With inflationary pressures rising globally since the start of the year, exacerbated by the Ukraine war, and economic outlook constantly worsening, investors have been fearing a ‘stagflationary’ outcome, which has historically been the worst quadrant for markets. The surge in inflation risk globally has left bonds vulnerable since the start of the year, and the market uncertainty combined with the sharp tightening in ST rates have led to a plunge in risky assets, with US equities down nearly 25% since their January high.
Figure 4 shows that equity returns tend to crash when inflation rises above 4%; in this chart, we compute the average monthly returns of US equities for different buckets of inflation using Robert Shiller monthly data since 1871.
When inflation rises significantly above 4%, business uncertainty in terms of investments tends to surge and market starts to price in a sharp tightening in financial conditions, which implicitly put investors in a difficult position as most of the assets in financial markets tend to experience significant selling pressure.
Figure 4
Reuters, RR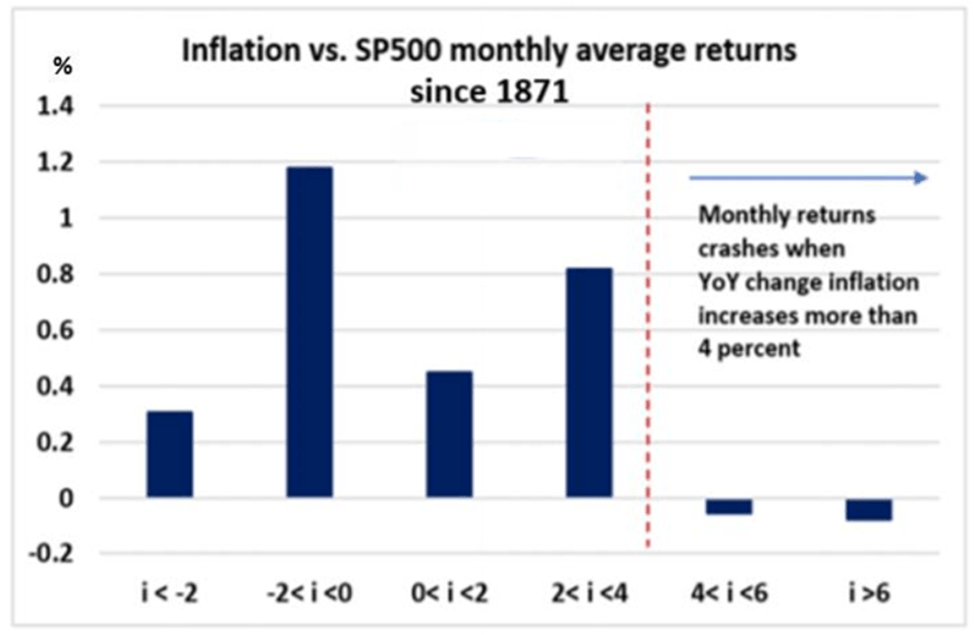
Hence, with equity markets down 25% since the start of the year, investors have been questioning if the Fed will eventually ‘set up’ an implied floor on risky assets to prevent further deceleration in the economic activity. The last time we saw sharp drawdowns in equity markets were Q4 2018 and Q1 2020, which were immediately offset by a strong ‘dovish’ reaction from the Fed.
We think that this time is different due to the current level of inflation, and we expect the Fed to continue their ‘hawkish’ stance in the near to medium term by front-loading a series of aggressive hikes, aiming to tame inflation by year-end 2023 and then immediately starts cutting rates as the economic activity will likely be in a recession within the next 12 to 18 months.
Further aggressive rate hikes are likely to invert the 2Y10Y yield curve before seeing the sharp ‘steepener’ that occurs in periods of economic downturn (figure 5)
Figure 5
Reuters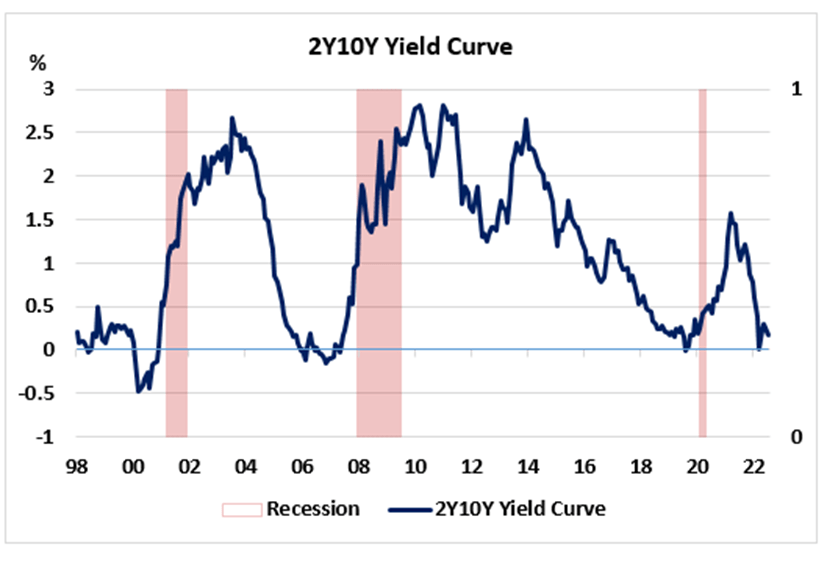
US Dollar To Hit New Highs
We still expect the US Dollar to outperform in the current environment, taking every consolidation as an opportunity to buy the dip on the DXY (UUP). Even though the US dollar appears expensive (with the DXY index trading at a 20-year high), market uncertainty, hawkish Fed and the ‘stagflationary’ outlook will drive preference for the ‘safe’ dollar.
In addition, further flattening in the yield curve could also support the USD in the near term; figure 6 shows that periods of significant fall in the 2Y10Y yield curve have been associated USD strength (and vice versa).
Figure 6
Reuters Reuters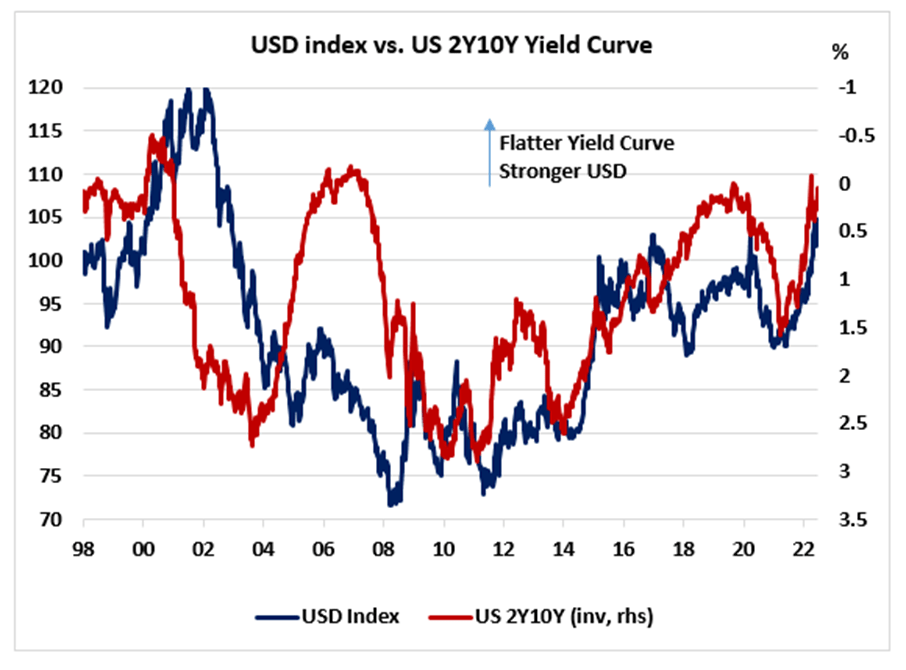
Long The US Dollar vs. EUR, GBP
The surge in recession risk between the Euro area and the US will continue to weigh on the single currency, with EURUSD likely to reach parity this year. In addition, risk off sentiment will also weigh on Sterling, which has historically been the worst performing currency in high-volatility regime. Figure 7 shows the monthly average performance of the most liquid currencies relative to the dollar when the VIX rises above 20 in the past 30 years.
Figure 7
Bloomberg, RR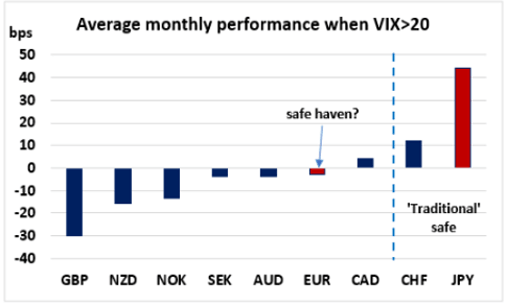
Conclusion
To conclude, the Fed is likely to continue its ‘hawkish’ stance in the near term to create further room for the next economic downturn (H2 2023/ early 2024), leaving risky assets vulnerable and therefore pushing preference for the US dollar.
Be the first to comment