

Douglas Rissing
Recently, there has been a lot of fuss about inflation and rising bond yields. It seems a pretty difficult task for the Fed and institutional investors to forecast the inflation development accurately, let alone for retail investors. Every time inflation is just a bit below expectations, FinTwit is bursting with comments on the Fed pivoting. And every time there is some inflation acceleration, the market starts panicking. There’s an impression that even the Fed doesn’t fully understand what is happening. Especially if you listen to Wharton Business School professor Jeremy Siegel harsh criticism of the Fed’s chairman Jerome Powell.
In this article, we analyze why it is almost impossible to precisely forecast inflation. There are just too many positive and negative factors affecting it. A human brain simply cannot assess them all correctly. Instead of reading inflation leaves, it is worth looking at the Fed that can’t overturn its policy, even if the inflation data starts looking good. I believe that upon reading this article to the end, you will agree with me. The Fed prefers bringing the economy into a recession rather than not being consistent enough to curb inflation. In the past, the market bottomed during the recession, not before. I don’t know if history can repeat itself, but I believe it can definitely rhyme with the past.
Fed’s crusade against inflation
Inflation became a hot topic in the post-COVID era. We can argue till the morning whether it was caused by supply-chain issues or loose Fed policies that brought too much money into circulation. Let us leave this argument for academia. What is important for us investors is that inflation didn’t turn out as transitory as originally expected. In November 2021, the Fed stopped using the word “transitional” and started harsh combat against the rising prices. It used two main weapons in its crusade against inflation: quantitative tightening and rate hikes. This policy increased the 10y treasury yield from 1.5% in November 2021 to 4.0% today and it had a dramatic effect on the stock market, which is closely connected with the bond market.
As you know, share price should be equal to the present value of future cash flows. In order to calculate the present value, you divide future cash flows by the respective rates. The higher the rates are, the lower the present value and the lower the share price. Increasing 10y bond yields lead to higher rates that you use for present value calculations. Therefore, such an unexpected yield increase resulted in 19% S&P and 33% Nasdaq declines.
Despite the bloody battle where lots of us lost plenty of savings, inflation remains high. September figures were expected at 8.1%, but turned out to be 8.2%. Surprisingly, the market went up on the day the inflation data was published. It sparked talks about the Fed’s pivot. Some may think that the market cheered just a 0.1% overshoot of actual data over the forecast, but I disagree. Even such a marginal excess over the forecast is quite unpleasant because it shows how sticky inflation is. If we look at previous inflation dynamics, we can see that almost every time, the forecast was below actual figures.
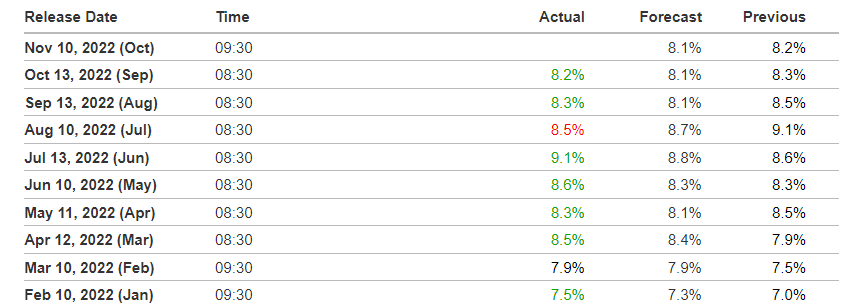
Source: investing.com/economic-calendar/cpi-733
One of the explanations is that the market believes that the inflation index looks in the rear-view mirror, not the front one. And although inflation is high, it will be much lower in the future since it doesn’t properly depict the actual situation. For example, rent contributes roughly 1/3 to the inflation index. Recent research shows that the official rent measure lags behind market rents by roughly a year. In the post-COVID era, prices climbed a lot due to the popularity of remote work. People require more spacious apartments as they started spending more time at home. As lockdowns were lifted, the trend started reverting. Some say it was only recently that the inflation index started considering a steep rent increase. In reality, prices have already started to decrease. A recent Forbes article describes the situation very well:
“Sequential rents month over month paint the most striking picture of the deteriorating rental market,” according to Business Wire. “Only 13 of the 40 largest markets saw month-over-month rents holding positive or at zero. San Francisco rents declined the most in the past 30 days as far as absolute terms, down $29 or 0.9%, but Nashville led in percentage change, down 1.1% or $18.”
As you know, the supply-chain disruptions were what initially sparked inflation. Parts could not be delivered on time, ports were backlogged, and there was an extreme shortage of semiconductors due to high demand for electronics during the lockdown. This development brought chaos to the shipping industry and raised prices for cargo transportation. As we can see in the chart below, the highest shipping costs were recorded in summer of 2021. Since then, the prices have decreased a lot and are almost back to the pre-COVID levels. Thus, the decrease in shipping prices is a good indicator of alleviating pressure of supply-side issues on inflation.

Source: fbx.freightos
Granted, there are many other factors that may have had a significant impact on inflation. Oil prices recovered from COVID-19 bottom and remain high despite sluggish growth in China and looming recession in the US and West. I believe that this is mostly driven by uncertainty surrounding Russian oil. As part of the sanctions, the US and Europe are introducing the oil price ceiling, which should prohibit Russia from exporting oil above certain price levels. This can be done, for instance, via sanctions on the shipping insurance. The tankers can’t get insured if transported oil costs more than a certain amount. It’s quite a new mechanism and right now it is not clear how it will be implemented. In case it’s implemented efficiently, meaning India and China would also join the ban, Russia may stop its exports completely. Although this decision is absolutely counterintuitive to the Russian economy, it is not the first time Russia has shot itself in the foot. For instance, you may remember the situation with gas exports to Europe that were restricted from the Russian side.
Another factor is low unemployment rates in the USA. It may lead to a dangerous increase in wage dynamics and have a negative effect on overall prices. It is an old macroeconomic case named the “inflation spiral.” When you raise wages for your workers in the situation of uncertainty and wondering of high inflation, people start to buy more products because they don’t know if they will be able to afford them in future. The increasing demand also increases the firms’ revenue so that they can pay higher salaries, and the cycle repeats. Data tells us that we aren’t in such a cycle yet because consumers still don’t expect high inflation over the next few years. The Fed wants to at least see such a dynamic, and is therefore trying to cool down the labor market.
In a nutshell, we don’t and can’t know how quickly the inflation will abate. What is important is that the majority still expects price changes to remain moderate long-term. It means that investors still believe that the Fed copes with the situation. But where do we know it from?
The inflation genie is still in the bottle.
To understand the market inflation expectations, my team and I rely on two main sources.
There are two types of government bonds: treasury bonds that show yield in nominal terms, and the inflation-linked treasury bonds where the yield is adjusted for inflation. The difference between the bond yields measures expected inflation. In the chart below, we look at the difference between 10y Treasury bonds. We can see that inflation expectations started rising since the COVID bottom, where they reached about 3% earlier this year and are currently close to 2.5%. It means that investors expect long-term inflation in line with the Fed’s target of 2%. It is much below the 6% inflation expected over the next year. We looked at the difference between 1y bonds for it.
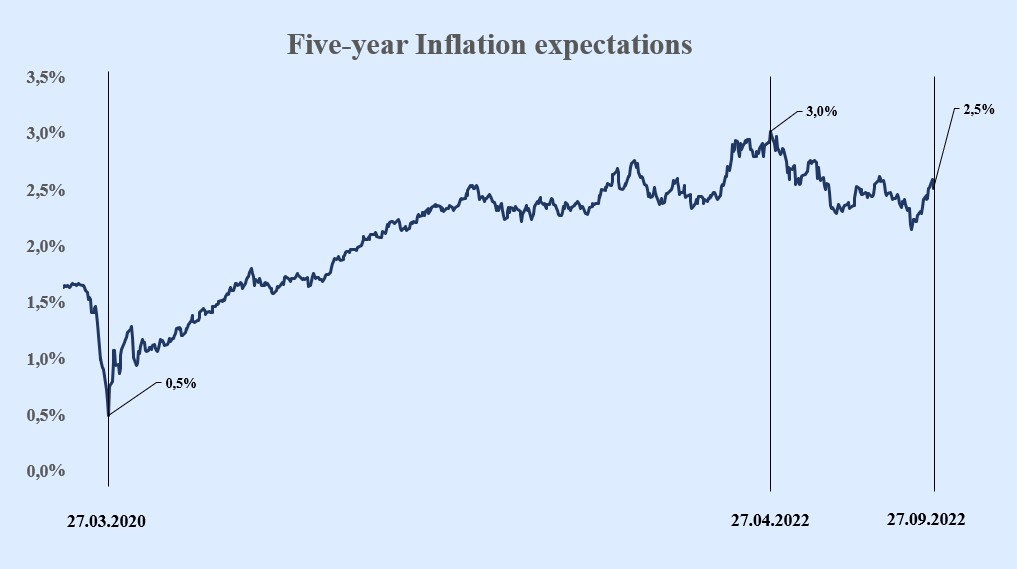
Prepared by author / fred.stlouisfed.org
Unfortunately, inflation-adjusted bonds didn’t exist in the 70s when inflation went through the roof. To compare the current situation with those days, we refer to the Michigan survey, a monthly survey conducted by the University of Michigan. The survey is based on telephone interviews that gather information on consumer expectations for the economy. From this chart we see that 5y inflation expectations are now at about 3%. This is the level in line with previous years. To our relief, they are significantly below the figures seen in the late 70s when inflation went out of control.
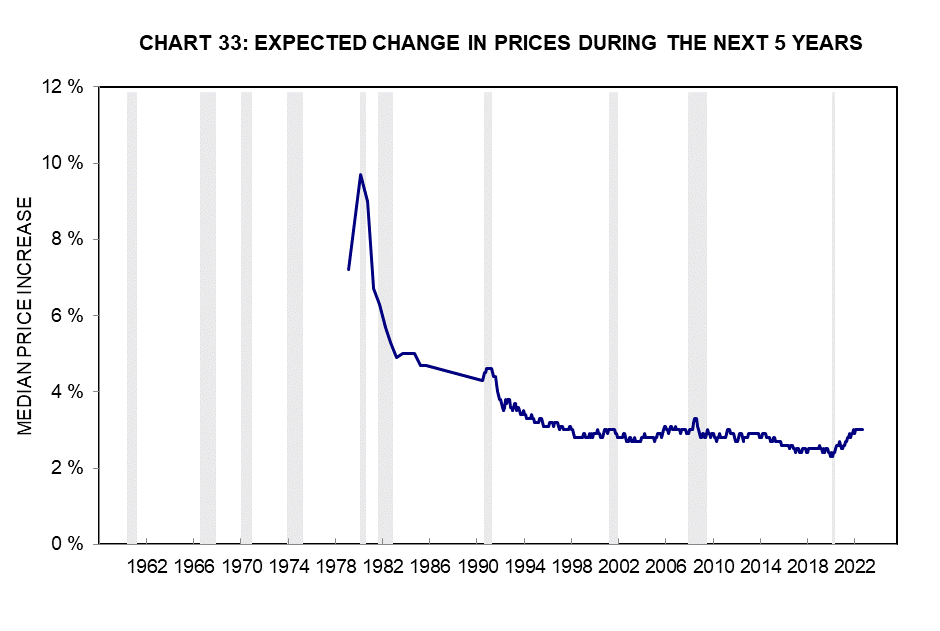
Source: data.sca.isr.umich.edu
From these metrics, we see that although the Fed made a mistake with excessive economic support, inflation still sits in the bottle. Therefore, it is very important for the Fed to keep its credibility and not to let inflation out.
The Fed can’t pivot easily
The Fed understands that the inflation index reflects the past and not the future. And it understands that it should stop hiking so as not to bring the economy into a recession. The issue is that the Fed isn’t a wizard who can wave a magic wand and change price directions. Instead, it’s better to imagine the Fed as the coachman that can either loosen his reins to get the horse to move, or tighten them to slow down the horse. In other terms, it works with lags, which means it takes time.
Oliver Blanchard, a former chief economist of the Monetary Fund and a close friend of my macroeconomic professor summarized the problem in a very clear way:
Suppose there are lags, that it takes, say, a year for tighter [monetary] policy to affect activity. Then, the central bank should stop increasing rates when it anticipates that in a year, core and wage inflation will stabilize and then turn around. This implies that it should stop increasing rates while core and wage inflation are still increasing. The problem then is obvious: By doing so, it may lose credibility. People may well conclude that the central bank is not committed to disinflation. To counter this, the only avenue the central bank has to keep credibility is to keep increasing rates until core and wage inflation actually stabilize and turn around. But this implies overshooting, a period of excessively high rates, followed by a deeper than needed recession.
In this case, the Fed may cause the recession not because they are “stupid” or “insane,” but simply because monetary policy works like this. A similar idea was expressed in the latest research published on September 22nd 2022 by the hedge fund founded by the famous Ray Dalio:
With core inflation still north of 6%, unemployment at 3.7%, and a record number of unfilled jobs, the Fed is now playing catch-up, and the policy risk facing it is asymmetric—it needs to tighten a lot and can’t afford to underdeliver or back down too early.
Plus, Bridgewater Associates believe that the current sell-off is still low than needed to force the inflation go down.
While markets, on Fed guidance, have priced in the Fed’s rate tightening ahead of actual hikes, they have yet to price in any real growth slowdown and continue to see a pivot to persistently tighter policy as unlikely.
It was interesting for me to check if the growth slowdown was already factored in by the current market. There is one famous spread that allowed us to forecast recession pretty accurately in the past. It is the spread between 10-year and 2-year bonds. If it is negative, it means that 2-year rates are higher than 10y rates. When short-term yields climb above longer-dated ones, it signals that short-term borrowing costs are more expensive than longer-term loan costs. The economy eventually contracts and unemployment rises. Historically, it predicted the recessions quite precisely. You can notice it in the chart below where recessions are marked in gray. We also see in the chart that currently the spread is negative again, which means that the probability of a recession is currently very high.
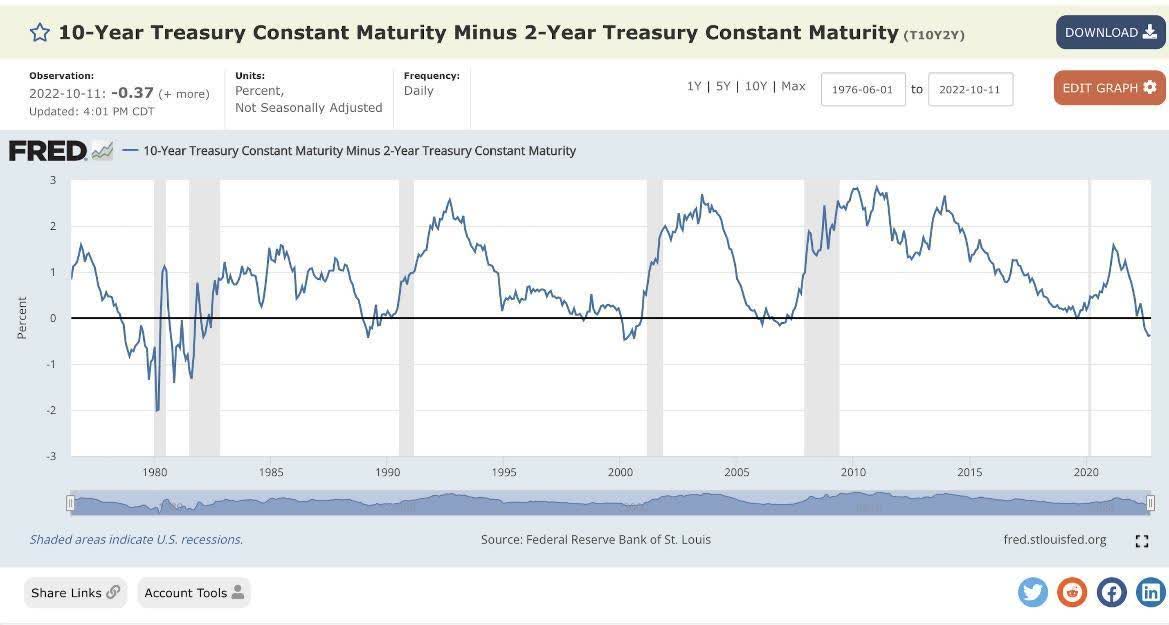
fred.stlouisfed.org
If we look at the previous recessions after the dot-com bubble and during the 2008 financial crisis, we can see that the market declined by 49% and 57% respectively. It is almost double compared with the recent 25% decline. The interesting thing is that the market didn’t decrease before the recession. Instead, in the chart below you can see that the market declined after the start of declining GDP and reached the bottom before the recession ended. It is also interesting that the market begins to grow before the recession ends. But let’s leave this idea for another article when we are closer to this point.
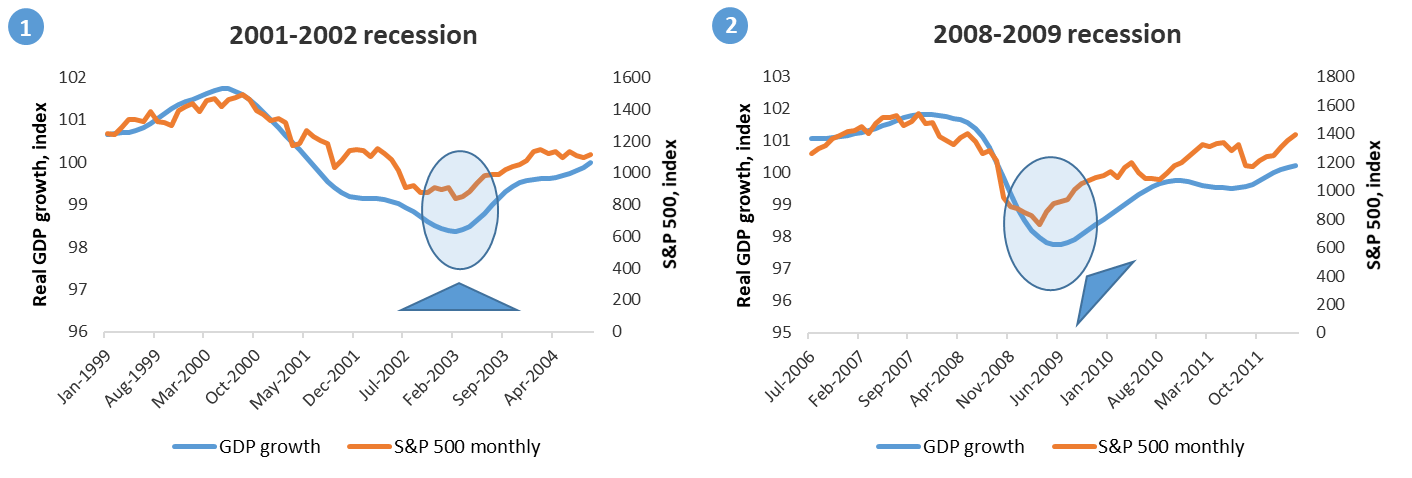
Author’s work
If we look further in the past, we can see that the sell-off of financial assets in the 70s was much more severe than the recent sell-off.
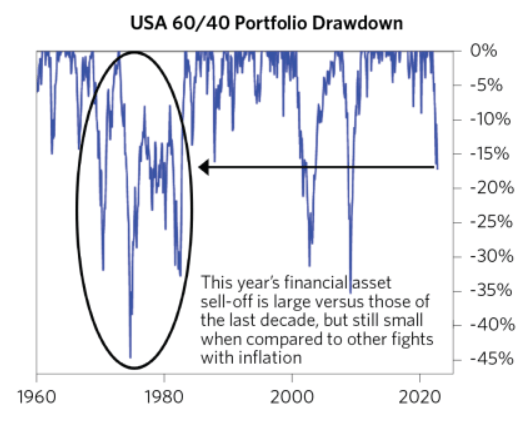
Bridgewater Associates
Patience rewards investors
I would like to show you how important timing can be. The chart below illustrates annualized five-year S&P performance after the respective year, where all investments are assumed in early January. We see that the investment in 2002— just a couple of months after the March 2001- November 2002 recession— would bring 3.9% while buying stocks just before the recession or several years earlier would result in negative returns. The investments before the Great Recession that lasted from December 2007 to June 2009 show us similar poor results. The stock purchase during the recession in January 2009 or just after it in 2010 would result in double-digit returns. Conversely 2007-2008 would have been terrible years even for long-term investors. Patience is sometimes much more important than Fear Of Missing Out.
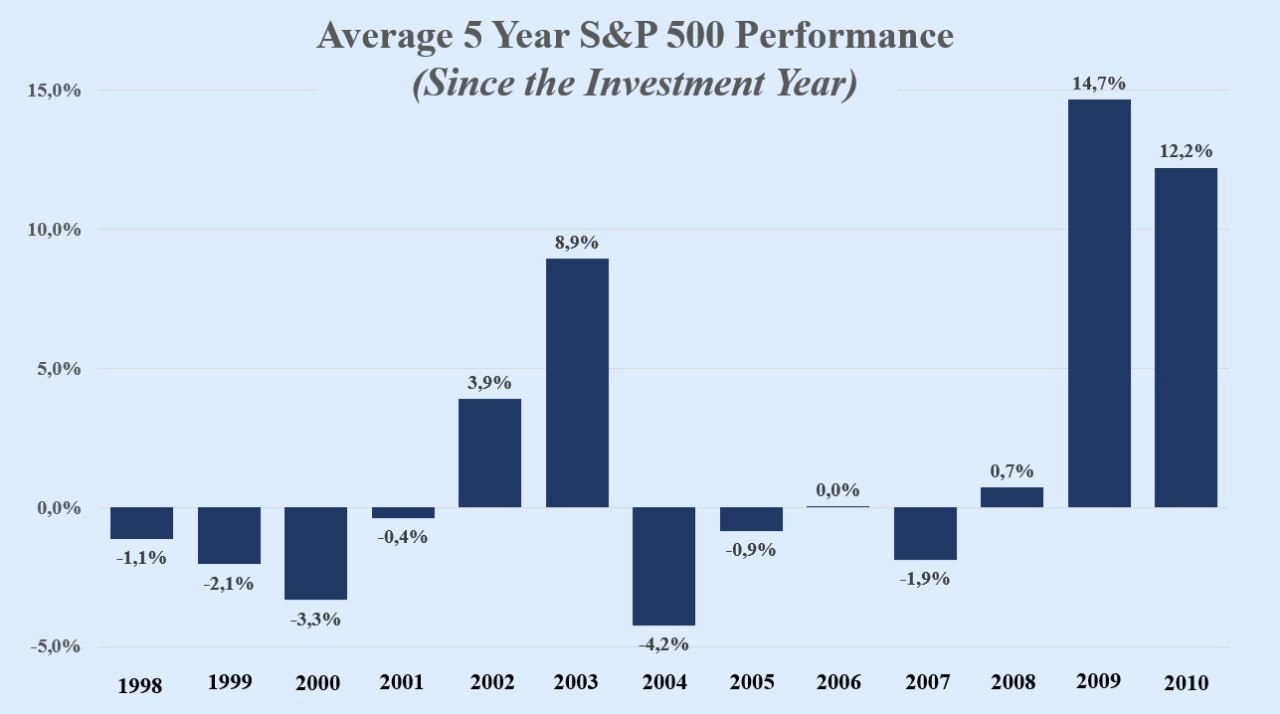
Author’s work. Yahoo Finance
Bulls say
S&P 500 bulls would claim that inflation reached its peak this summer and has been decreasing since then. The key inflation drivers such as shipping costs and rent prices are going down. The Fed’s tightening of money supply will increase unemployment and have a downward pressure on wages. Thus, the labor market won’t contribute to a significantly higher inflation. It will allow the Fed to pivot and avoid recession and be a strong catalyst for future market growth that lies in the currently oversold territory.
Conclusion
The Fed’s tightening policies will lead the economy into a recession. Although the bond market signals the economic slowdown, it has not been reflected yet in share prices. History rhymes with the previous bear markets when the market bottom was reached during and not before the recession started. I believe that investors should still sit on the sidelines and their patience will be rewarded with a juicy portfolio performance.
Be the first to comment