


gorodenkoff
1. Introduction
In this article, I will explain why high net working capital is not necessarily good for shareholders, even though its importance is widely taught in financial courses and textbooks. Some even generalize that negative net working capital is a clear sign that a company is in trouble, while the reality is much more nuanced.
I also will provide an easy-to-understand explanation of working capital accounts by using The Coca-Cola Company (NYSE:KO) and PepsiCo (NASDAQ:PEP), two excellent, largely recession-resistant blue-chip companies in the consumer staples sector, as illustrative examples.
In addition, I will also highlight the impact of working capital management on a company’s cash flows. After all, we as shareholders are all about the cold, hard cash our companies generate – the more the merrier. And as I will show, companies that look negative from a text book perspective can, contrary to intuition, actually be excellent cash flow managers, which in turn leads to market-beating results for us, the company’s owners.
2. What Is Working Capital?
In principle, working capital is the capital a company needs to carry out its day-to-day business. Working capital includes only short-term (i.e., convertible into cash within one year) assets and liabilities on the balance sheet. The main working capital accounts are:
- Accounts Receivable: When a company has provided services or sold products to a customer but has not yet been paid, the balance is reported in this account on the balance sheet. In effect, this account represents purchases on credit – the company is owed money, so it takes a credit risk. Companies deduct from accounts payable a certain amount that’s unlikely to be collected and refer to this amount as “doubtful accounts” or “allowance for credit losses.” For example, for 2021, Coca-Cola has established an allowance of $516 million, or 13% of the gross amount of accounts receivable (p. 62, 2021 10-K). Retailers often do not show accounts receivable on their balance sheets because their customers generally pay for their goods at the time of purchase.
- Inventories: This account shows the “value” of raw materials, work in progress, and finished goods that are owned by a business and have not yet been sold to customers. The actual value of inventories on the balance sheet depends on the adopted accounting rules. It’s important to note that an ever-growing inventory position carries the risk of future markdowns. Therefore, this asset may be worth much less than it is accounted for on the balance sheet. This is especially true for retailers (e.g., Target Corp. (TGT), see my update and my comparison to Walmart (WMT)) and apparel companies (e.g., V.F. Corp. (VFC), see my latest article).
- Accounts Payable: This item includes a company’s short-term obligations (a liability) to its suppliers and other creditors. In effect, one company’s payables are another company’s receivables.
Of course, there are other current assets and liabilities for which identification as a working capital account is less clear. Companies do carry more or less significant cash and cash equivalents on their balance sheet, and in some cases, this cash is not fully needed for day-to-day operations. There are no hard and fast rules for determining excess cash, but it may be useful to estimate the percentage of excess cash when performing entity-based discounted free cash flow valuations, when determining enterprise value, or when conducting an assets-based valuation.
Finance classes and textbooks teach that a company with positive net working capital (i.e., current assets minus current liabilities) has sufficient headroom to meet its short-term obligations. The ratio of current assets to current liabilities is commonly referred to as the current ratio, and values well above 1 are considered to indicate a well-managed company. In principle, there’s nothing wrong with this definition, but it’s easy to understand that a company with an extremely high current ratio is probably not using its capital efficiently. If a company forgoes growth opportunities by holding excess cash on a regular basis, it can hurt shareholder returns. This is manifested by a low or negative excess return on invested capital (i.e., the difference between the return on invested capital, ROIC, and the cost of capital).
Of course, I do not mean to sound as if every company should squeeze every last drop of efficiency out of its working capital management. Conservatively managed companies have actually done very well operationally in recent years when somewhat larger inventories, local manufacturing, and a low emphasis on just-in-time production protected these companies from supply chain disruptions and the near-term effects of high inflation. Therefore, it’s important to consider the specifics of the company, such as its sensitivity to business cycles, product switching costs, margin profile, and free cash flow productivity.
In particular, FCF productivity and reliability are two very important aspects to consider when evaluating a company’s working capital needs before jumping to the conclusion that a company is in distress simply because the current ratio appears to be inadequate.
3. The Importance Of Efficient Working Capital Management For Free Cash Flow
In my recent article on how to calculate sustainable free cash flow, I noted that I normalize a company’s working capital movements over the years to smooth out seasonal and one-time effects. I highlighted the importance of such normalizations in the context of cash flow-based company valuations.
For example, as a direct result of government-imposed measures to contain the spread of SARS-CoV-2 in 2020, many companies reduced their inventories in anticipation of the ensuing economic slowdown. In 2021, demand recovered and companies restocked, often finding themselves in a competitive situation that was partly responsible for the oft-cited supply chain disruptions. An investor valuing a company from a discounted cash flow or similar perspective, using conventionally determined FCF (operating cash flow less capital expenditures) based on either a 2020 or a 2021 cash flow statement, would therefore either over- or underestimate the company’s actual FCF. Smoothing the movements in working capital and having a good understanding of the nature of the company’s operations help to correctly assess sustainable FCF and thus enable a meaningful valuation.
However, considering working capital movements also helps to understand and evaluate a company’s operational efficiency. Retailers, for example, need to tie up a lot of capital in inventories especially before and during the holiday season, which affects profitability, especially if inventories are managed improperly. At the same time, a look at working capital trends makes it easy to see if a company is in trouble. The business may have a current ratio well above 1, but a steady increase in inventory could point to an obsolete business model. A steady increase in accounts payable or days payables outstanding (DPO, see Section 5) may indicate financial distress, as the company may no longer be able to pay its suppliers and is masking the problem by taking on long-term debt that would increase current assets (i.e., increase cash). Of course, looking at DPO in isolation can be very misleading as well (see Section 5), as can concluding that financial stability should be assessed solely on the basis of a high current ratio.
4. Examples Illustrating The Interplay Between Working Capital And Free Cash Flow
Before discussing working capital management at Coca-Cola and PepsiCo and the impact on FCF, I would like to give a few examples that illustrate the interplay between working capital accounts on the balance sheet and the statement of cash flows.
Consider the example I mentioned earlier of a company trying to hide distress – evidenced by disproportionately increasing payables – by taking on long-term debt. As payables increase, the current ratio decreases, and the company will eventually be unable to pay its suppliers. By taking on long-term debt (+$300, 2021, Figure 1), the current ratio improves as long-term capital is converted into a current asset. A look at the cash flow statement shows that an increase in accounts payable has a positive sign, increasing operating cash flow (+$800, 2021, Table 1). Of course, all else being equal, such behavior can represent an unsustainable way of “generating” operating cash flow (OCF). Looking only at 2021 OCF and capital expenditures in the exemplary cash flow statement in Table 1, ignoring movements in working capital accounts, would have led to the wrong conclusion about the company’s financial health. As an aside, financing paydown of payables with long-term debt would represent a transaction with mismatched maturity terms, which banks do not like to see. However, such transactions do occur, and investors should therefore pay close attention to where the net cash flow comes from, i.e., whether the company generates actual free cash flow, only benefits from movements in working capital, or is relying on cash flow from financing activities, as the example in Table 1 shows.
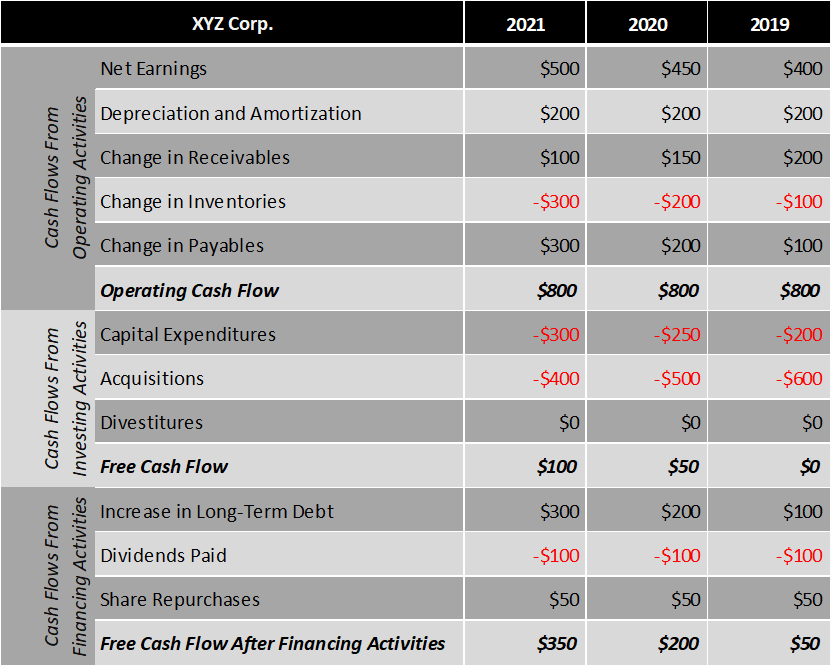
Table 1: Cash flow statements of a fictional company (own work)
Our fictitious company also regularly increases its inventories, another potential sign of trouble. As inventories are increasing on the balance sheet, the cash flow statement shows a negative number reflecting cash outflow.
Finally, I would like to draw your attention to XYZ Corp.’s acquisitions – in each of the last three years, it has acquired other companies, as shown in the cash flow from investing activities section of the statement of cash flows. At the same time, the company recorded cash inflows due to decreases in accounts receivable. This could be perfectly acceptable, as the company may simply be taking payments for goods delivered to customers in the past. However, it could also be that the company is trying to paper over the cracks in its business model by cashing in receivables taken over from the recently acquired companies. If it turns out that our fictitious company is indeed collecting receivables that it did not generate organically, this would have a further negative impact on the company’s sustainable free cash flow.
5. Leveraging Working Capital Management For Stronger Free Cash Flow Productivity
Unlike retailers and cyclical companies with significant intermittent working capital needs, businesses such as software companies or asset managers can typically operate on the basis of lean working capital and low capital expenditures, so their profits convert to FCF almost immediately, i.e., they have high FCF productivity. Add strong brands that translate into pricing power and operations in an area that satisfies everyday needs, and you arrive at consumer goods giants like Coca-Cola and PepsiCo. Such companies are characterized by high cash flow reliability and productivity likewise. As a cash flow-oriented investor, these are exactly the companies I look for.
Coca-Cola and PepsiCo own several extremely valuable brands and operate globally. The companies are growing organically to a significant extent, but also through acquisitions. Coca-Cola focuses on beverages and owns a veritable empire of brands, including Coca-Cola in its several varieties, Sprite, Fanta, Fresca, Schweppes, glacéau, Powerade, Topo Chico and Minute Maid. The company also owns the Costa coffee brand and involved with energy drink behemoth Monster Beverage (MNST). In contrast, PepsiCo has diversified into convenience foods. PepsiCo owns world-class brands such as Pepsi-Cola, Gatorade, Tropicana, SodaStream, Mountain Dew, Lays, Doritos, Cheetos and Quaker.
Unlike PepsiCo, Coca-Cola prices its products relative to its competitors. Moreover, in addition to its consolidated bottling and distribution operations, the company is increasingly relying on its network of independent bottling partners, such as Coca-Cola FEMSA (KOF, Central and South America) and Coca-Cola Hellenic (OTC:CCHBF, significant parts of Europe). It’s therefore understandable that Coca-Cola’s normalized free cash flow margin is significantly higher than PepsiCo’s. The operational differences are also underscored by the striking difference in capital intensity (Figure 1 versus Figure 2). While Coca-Cola’s capital intensity has fallen substantially, from 25% in 2012 to 10% in 2021, PepsiCo’s more consolidated approach has been at least partly responsible for the increase in its capex ratio from 31% to 38% over the past decade.
Of course, Coca-Cola’s superior cash flow profitability is not a free lunch, as the company bears significant risks associated with its bottling partners, which are independent contractors. It should not be forgotten, however, that Coca-Cola has long-standing relationships with its bottling partners. At the same time, this approach protects the parent company some extent from material adverse events. While sales and therefore cash flow would suffer if a bottler were to go under, the contractual partners are in principle interchangeable. Since both companies are operating throughout the world, they can leverage growth in emerging markets very well. However, I think Coca-Cola’s approach indirectly gives its bottling partners more freedom in terms of local market realities, which could benefit growth in such regions. At the same time, I doubt that PepsiCo’s more centralized approach better protects the company from exchange rate fluctuations. Both companies report in U.S. dollars, and I assume that cash management in both cases is likely to be on a regional basis, ensuring adequate liquidity in local currency.
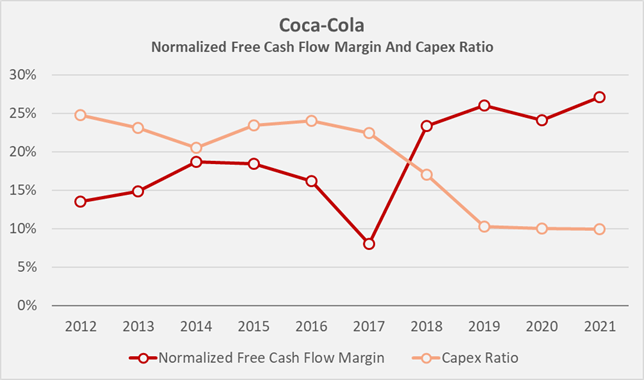
Figure 1: Historical normalized free cash flow margin and capex ratio of Coca-Cola; free cash flow has been normalized with respect to working capital movements and stock-based compensation expenses (own work, based on the company’s 2011 to 2021 10-Ks)
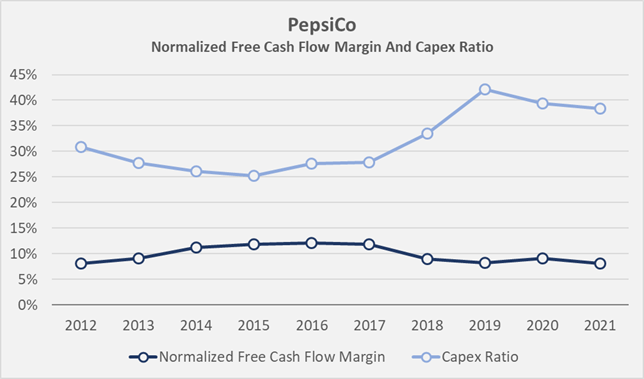
Figure 2: Historical normalized free cash flow margin and capex ratio of PepsiCo; free cash flow has been normalized with respect to working capital movements and stock-based compensation expenses (own work, based on the company’s 2011 to 2021 10-Ks)
While Coca-Cola’s free cash flow margin increased primarily due to the decrease in capital expenditures, improvements in working capital management also played an important role. In this context, it’s helpful to look at metrics such as the following:
- Days Sales Outstanding (DSO), a metric that indicates how long it takes a company to collect its receivables. It’s calculated by dividing average receivables by revenue per day (annual revenue divided by 365). The faster the better, because each additional day means credit to the customer, probably at a zero or low interest rate.
- Inventory Days (ID) is a metric that measures the time it takes the company to sell its inventory. It is calculated as the quotient of average inventory days and daily cost of goods sold (COGS divided by 365). The faster the company is able to sell its inventory, the better.
- Days Payables Outstanding (DPO): This ratio indicates how long it takes a company to pay its suppliers and other creditors. It’s calculated as the ratio of accounts payable to daily cost of goods sold per day.
I already briefly touched on DPO in Section 3 and noted that an increasing number of days payables outstanding may indicate a problem. However, larger companies with stable business models and reliable cash flows, such as the two examples at hand, can take the liberty of stretching DPO and thereby increasing OCF in what is actually a fairly sustainable way. Such behavior indicates pricing power, market dominance, and even monopolistic tendencies. Figure 3 (Coca-Cola) and Figure 4 (PepsiCo) illustrate that both companies have been paying their suppliers and other creditors at an increasingly slow pace, effectively giving themselves free credit. Days sales outstanding have remained relatively constant over the past decade, at 36.6 days for KO and 33.5 days for PEP. The similarity in DSOs suggests that the companies are struggling to improve payment terms with their customers further, although especially Coca-Cola may be able to improve somewhat in this area. However, it’s worth noting that the company’s DSO fell to 31 days in 2021, and it will be interesting to see how sustainable this improvement will be. Inventory days have increased at Coca Cola, which puts some pressure on free cash flow productivity. In contrast, PepsiCo is obviously integrating its regularly acquired businesses extremely well, as is underscored by the de facto flat inventory days.

Figure 3: Historical working capital efficiency ratios of Coca-Cola (own work, based on data by Morningstar)
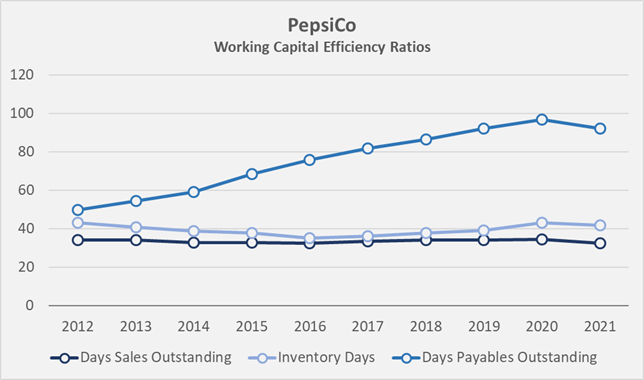
Figure 4: Historical working capital efficiency ratios of Coca-Cola (own work, based on data by Morningstar)
Finally, based on these three ratios, the cash conversion cycle (CCC) can be calculated. It measures the time in days it takes for a dollar spent on production to be converted into cash – the faster, the better. Figure 5 compares the historical CCCs of Coca-Cola and PepsiCo and shows that both companies have improved significantly in recent years. However, PEP’s cash conversion cycle is significantly better than KO’s. I believe that Coca-Cola can still improve in this regard if it continues to optimize its operational relationships with its bottling partners.

Figure 5: Coca-Cola’s and PepsiCo’s historical cash conversion cycles (own work, based on data by Morningstar)
6. Negative Net Working Capital – Largely Reserved For Non-Cyclical Large Caps
Earlier, I pointed out that the current ratio (current assets divided by current liabilities) should be well above 1 according to many courses and textbooks. In principle, there’s nothing wrong with this, but as is so often the case in life, reality is somewhat more nuanced. Having established that both Coca-Cola and PepsiCo are true profitability powerhouses with negligible cyclicality, owning world-class brands with significant pricing power, a look at their balance sheets is warranted. Viewed in isolation, PepsiCo’s declining current ratio could be taken as a warning sign, but given the strength of the company, I think it’s safe to assume that the decline is due to working capital optimizations.

Figure 6: Coca-Cola’s and PepsiCo’s historical current ratios (own work, based on the companies’ 2012 to 2021 10-Ks)
Finally, focusing on the main working capital accounts as discussed in Section 1 of this article – namely receivables, inventories and payables – and netting assets and liabilities, the two companies’ relentless focus on working capital optimization becomes even clearer (Figure 7). Research confirms that companies with consistently negative working capital and asset-lean business models that give rise to dependable earnings tend to outperform the broader market. Notable examples include not only Coca-Cola and PepsiCo, with long-term average returns on invested capital of 12% and 16%, respectively (Figure 8), but also Apple (AAPL) and McDonald’s (MCD), the latter company being an equally interesting example due to its franchising approach and focus on real estate.
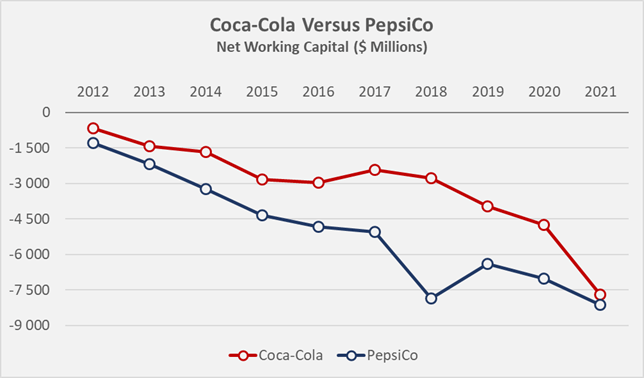
Figure 7: Coca-Cola’s and PepsiCo’s historical net working capital (receivables plus inventories minus payables) (own work, based on the companies’ 2012 to 2021 10-Ks)
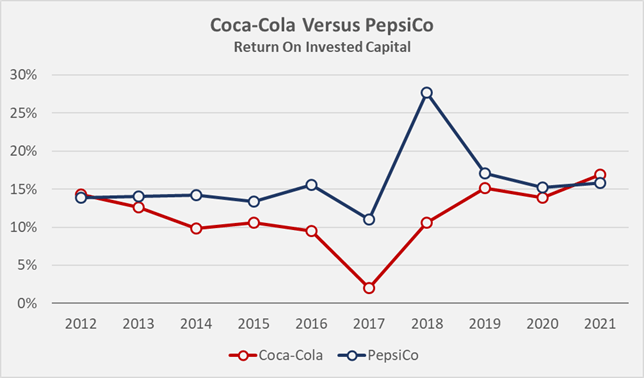
Figure 8: Coca-Cola’s and PepsiCo’s historical returns on invested capital (own work, based on data by Morningstar)
7. Key Takeaways
- Textbooks and financial courses often point out that a sound balance sheet is characterized, among other things, by a healthy current ratio, i.e., positive net working capital. Conversely, negative working capital may indicate problems.
- However, as is often the case in life, the reality is much more nuanced, and a relentless focus on an overly conservative balance sheet can lead to weak shareholder returns due to missed growth opportunities.
- In particular, leading global companies with recession-resistant business models and reliable cash flows can optimize their working capital management to further improve cash flow productivity.
- Coca-Cola and PepsiCo are particularly interesting examples in this context. Coca-Cola because it is increasingly relying on independent bottlers, and PepsiCo because it is integrating well the various brands it has acquired as it diversifies its business into convenience foods.
- Both companies are prime examples of proper working capital management, highlighted in part by their relentless efforts to extend payment terms with suppliers and other creditors.
- Although Coca-Cola’s revenue declined from $48.0 billion in 2010 to $38.6 billion in 2021, the company increased its free cash flow from $6.5 billion to $10.5 billion, confirming the success of its outsourcing strategy. However, PepsiCo’s path through more aggressive acquisitions and organic growth appears somewhat more sustainable, as profitability can only be optimized to a certain extent. At the same time, relying on quasi-independent partners carries significant risks.
- Coca-Cola and PepsiCo belong to an illustrious circle of companies that tend to outperform over the long run due to their increasingly negative net working capital, their high average return on invested capital, and strong free cash flow conversion.
Thank you very much for taking the time to read my article. In case of any questions or comments, I am very happy to hear from you in the comments section below.
Be the first to comment