


VizArch
Last week was the first time this year where the markets made my stomach drop, less because the market’s moves had been so unexpected than because they appear to be indicating that we are heading towards something more severe than a so-called “hard landing” (which in recent market commentary seems to denote an ordinary recession rather than a bona fide crisis). More concerning than the stock market indexes touching their 52-week lows is the significant declines in commodity prices (in this instance, most notably gold) and the persistent strength of the US dollar. Readers of my previous treatments of commodities this year will likely have an inkling of why gold’s decline is such a negative sign, but in this article, I want to isolate the role of the US dollar index (often abbreviated as DXY) within the modern process of globalization. Gold I will focus on in subsequent installments.
Thesis
In order not to mislead readers, I want to make clear that this article is less oriented towards predicting the next moves for the DXY or the ETFs that track its performance (for example, the Invesco DB US Dollar Index Bullish Fund (NYSEARCA:UUP)) than sketching out what the DXY can tell us about everything else going on around us in the markets, and particularly the state of globalization as we know it. But this analysis will ultimately feed back into an argument about a probable long-term elevated range of the DXY. That is, the DXY has broken from its long-term, downward historical trend for fundamental reasons—namely the exhaustion of the process of dollar-driven globalization that we will outline below—and this will more likely than not underpin a volatile but elevated level for the dollar in the long run (perhaps for the remainder of the 2020s).
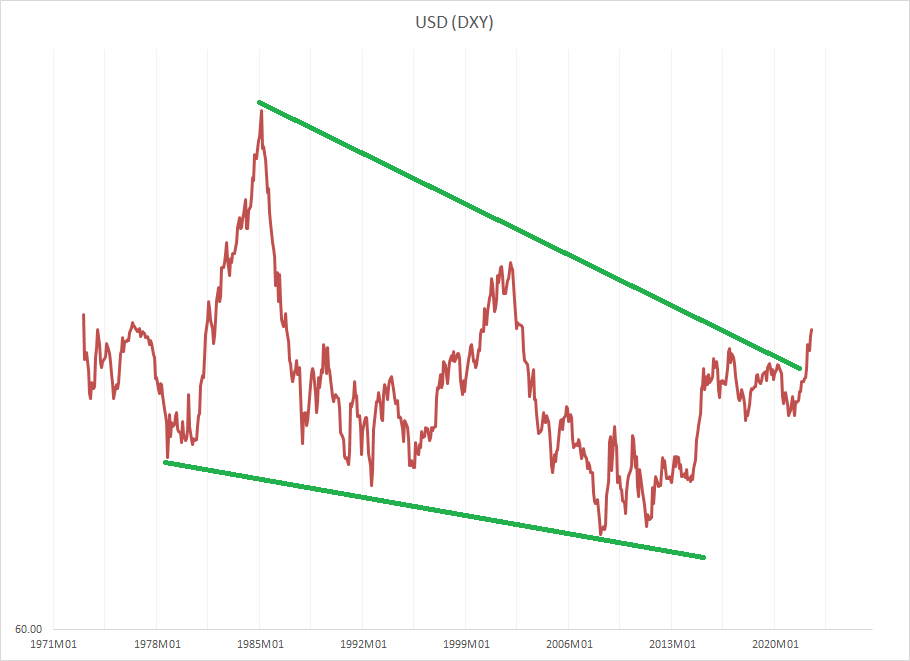
Chart A. The dollar has broken out of its downtrend and is on its longest rise since the inception of the index. (St Louis Fed; Investing.com)
The catalyst for this year’s remarkable dollar strength appears to be global growth differentials between the core of the global economy, the US, and the rest of the world, in both developed and emerging economies. One could point to global interest rate differentials, but in this instance, I think this is better reflected in the trajectories of long-term US yields and industrial commodity prices.
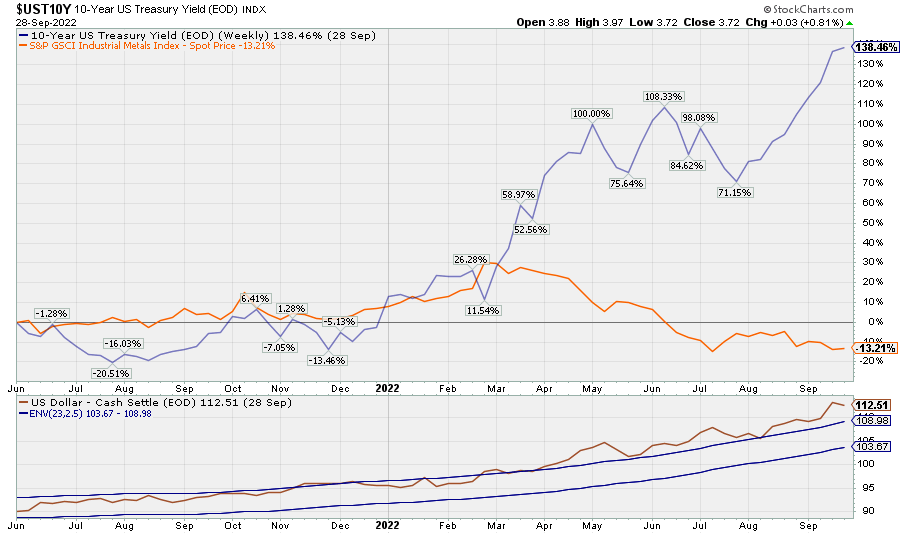
Chart B. The dollar’s rise accelerated as US interest rates rose while commodity prices slipped. (Stockcharts.com)
As I explained in June’s DBB: The Cyclical Downturn Has Likely Begun on the industrial metal ETF DBB, there is little reason to be optimistic about the trajectory of metals prices (assuming “up” is a good trajectory) for the foreseeable future. And, gold’s recent new lows strongly suggest further industrial commodity weakness ahead—probably late into 2023 and perhaps well into 2024. That, in turn, has grave ramifications for corporate earnings, as well, as described in that article. The decline in gold is just one more piece in the bear market puzzle.
In the short term, DXY strength will likely be sustained as long as this gap between the US and the rest of the globe persists, and there is, for now, no indication that that gap is prepared to close.
In this article, however, I am more interested in the larger significance of the DXY index’s strength. I fear that this strength is signaling more than an “air pocket” in the global economy and may be a symptom of a larger-scale breakdown in globalization as we know it that may ultimately require a revamped global monetary order, a Bretton Woods III.
But, things are complicated by a third, medium-term implication. Emerging markets are likely to start outperforming the US once the DXY finally finds its peak, but it is not clear when that peak will occur (with the DXY at 115? 135? 155?!), and this possible outperformance is likely to occur against a backdrop of overall global weakness and geopolitical tension, meaning that even that outperformance may not be worth pursuing. (Emerging markets, like gold, will likely require a separate article to outline that case more fully).
In other words, it is probable that the DXY will peak roughly at the moment that a transition in the relative performance of the US and emerging markets occurs, but until the catalyst that reverses that DXY strength manifests itself, there is a danger of being too early and thus failing to reap the benefits of that transition. Plus, global equity markets are likely entering a long-term bear market anyway (see SPY: Long-Term Outlook Remains Unchanged and Conjunction & Disruption: Technology, War, And Asset Prices).
To make this argument about the relationship between the dollar and globalization, it is necessary to define the DXY and, more trickily, the term “globalization”.
What is the DXY?
The DXY is a trade-weighted index of “major currencies”, including the British pound, the Swedish krona, the Canadian dollar, the Swiss franc, the Japanese yen, and above all, the euro.
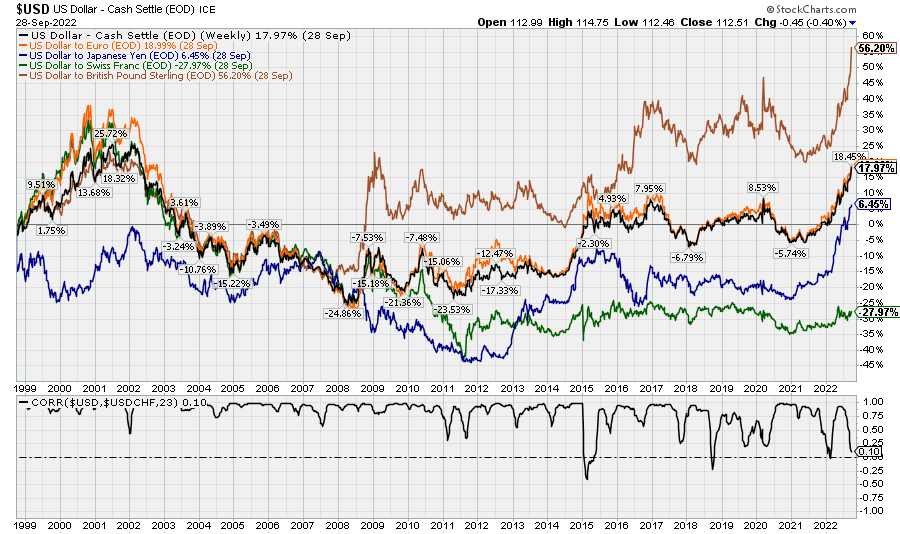
Chart C. The dollar index is primarily composed of the dollar/euro exchange rate. (Stockcharts.com)
European currencies make up the bulk of the index, which is why the euro tracks the DXY almost perfectly.
This index is in contrast to the broad trade-weighted index which includes every global currency. Wikipedia says this index is “better” because it includes more currencies (notably emerging market currencies) and this is probably true, all else being equal, but we are actually going to ignore the broad index throughout this article, since it adds little to our analysis. It is the narrower DXY that is key, even when talking about emerging markets.
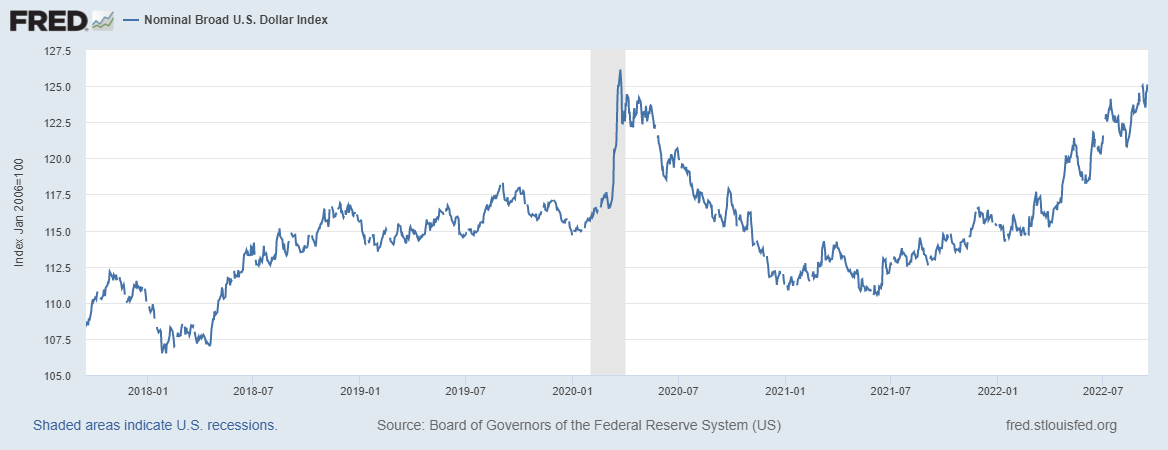
Chart D. The broad US dollar index is less critical to understanding globalization than the narrow one is. (St Louis Fed)
I explained why it is the narrower index, the DXY, that is more significant in a two-part series called Big Macs, Catch Up, And The Dollar Index: Thoughts On The Future Of Global Growth I wrote eight years ago. Thus, I will simply restate that argument here rather than laying out in full. The charts in the following section are from a less comprehensive but more up-to-date data set. These charts are based on data from countries highlighted in the map below.
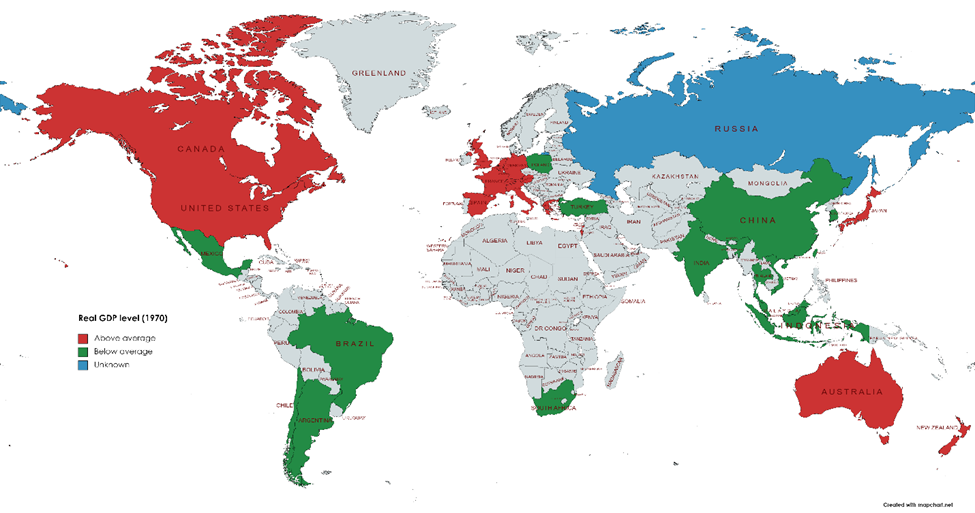
Chart E. Data for updated charts is drawn from the highlighted countries. (Author)
Historical rules of relative performance in the global economy
First, since the initiation of Bretton Woods I, the poorer a country is, the higher its long-term growth rate is likely to be—so long as it chooses to participate in the process of globalization. This is called the “Catch-up Effect” or “convergence”. Thus, once a poor country like China in the late 1970s resolves to get in on the globalization action, its growth will zoom upwards.
Second, since the initiation of Bretton Woods I in 1944, “comparative price levels” (the inverse of real exchange rates) across countries have tended to track their relative per capita GDP levels. That is a fancy way of saying that the richer a country’s citizens are, the higher the prices are likely to be in that country. If country A is richer than country B, and country B is richer than country C, then the price for, say, a Big Mac, is likely to be highest in country A and lowest in country C. This is called the Penn Effect, or if you want to impress your friends, the Penn-Balassa-Samuelson Effect. Some have argued that this holds true within domestic economies, as well. That is, richer regions have higher prices than poorer regions within a given country (see Chart K later).
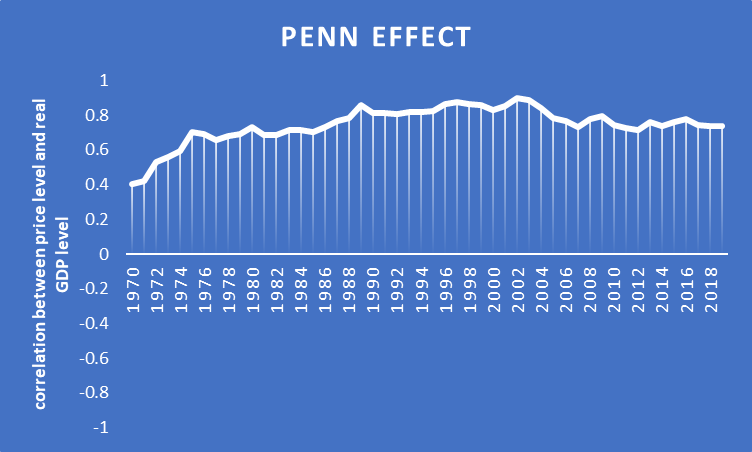
Chart F. Richer countries are more expensive than poorer ones. (Author’s calculations from Penn World Table 10, Groningen University)
Third, the Catch-up Effect, whereby poorer countries grow faster than rich countries, appears to be more powerful when the dollar is weakening relative to rich-world currencies, not poorer countries’ currencies. Thus, euro strength is a good indicator that the poorest countries are growing faster than middle-income or rich countries. Or, when the DXY is rising, that indicates that emerging markets are growing either more slowly or (more typically) less uniformly strongly against developed markets.
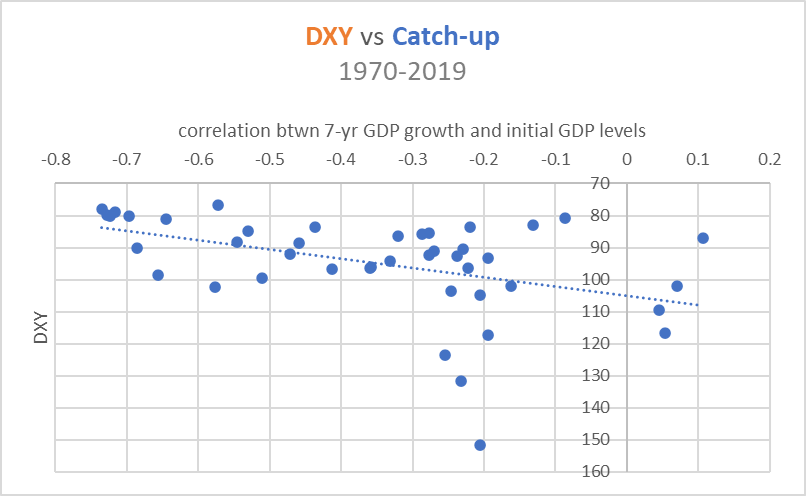
Chart G. The poorer a country is, the more likely it is to grow faster than richer countries when rich, ex-US countries currencies strengthen. (Author calculations from Penn World Table 10, Groningen University)
Fourth, as a country becomes richer, the more likely variations in the DXY are to be experienced in that country’s exchange rate rather than its growth rate. Thus, when South Korea was poor, a strengthening deutschmark (the proto-euro) implied high Korean GDP growth, but once South Korea became a rich country, a strong euro tended to imply a rising won and only a modest bump in Korean growth.
Fifth, we have tended to see the dollar peak about every 15 years (1970, 1985, 2000, 2015) albeit at ever lower levels. This year’s move up in the DXY breaks both aspects (15-year peaks and peaks at lower levels) of this pattern. This, in turn, implies that the Catch-up Effect has probably seen its longest period of weakness in the last 50 years, and the strength of the dollar this year leaves open the possibility that it becomes an emerging markets crisis. The following chart from the ECB suggests this relationship between emerging market crises and dollar strength, as well.
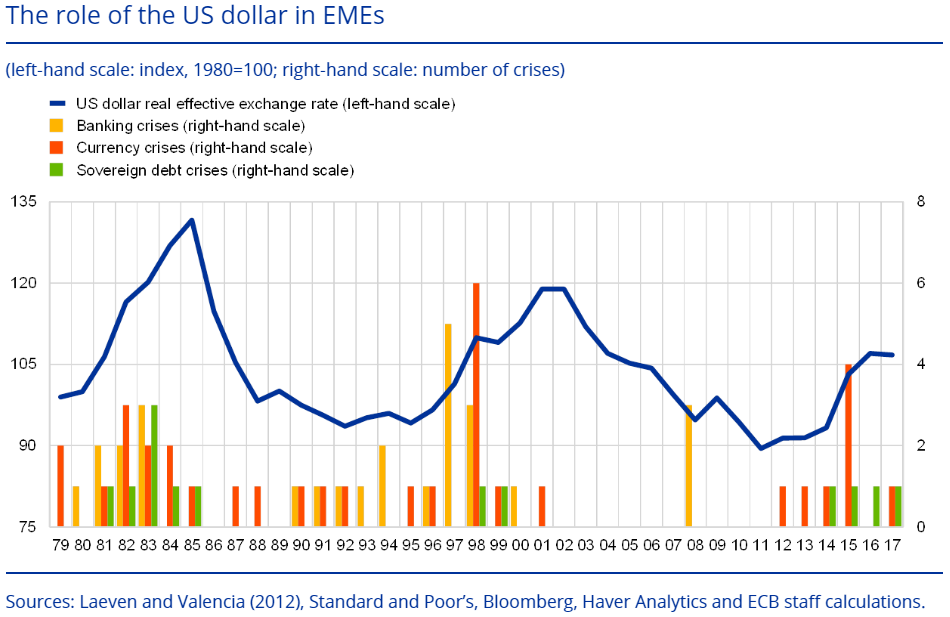
Chart H. Dollar strength against rich world currencies typically plays out as EM crises. (European Central Bank)
One might argue that Eastern Europe is experiencing an emerging markets crisis (masked as a geopolitical crisis) right now that is threatening not only other emerging markets but developed markets, as well (and certainly the strength of rich-world currencies at the moment).
We need to talk about why these processes occur, and this discussion will bring us towards a definition for a particular type of globalization necessary to comprehend the significance of the dollar index.
What is globalization?
The Penn Effect is, strictly speaking, the correlation between real GDP levels and price levels across countries. The Balassa-Samuelson Hypothesis, often conveniently packaged together with the Penn Effect, is an attempt to explain the underlying cause of the Penn Effect. This hypothesis says that countries that are more productive are likelier to have higher wages, and these higher wages are likely to manifest themselves as higher prices. A Big Mac in the US is more expensive than a Big Mac in Thailand largely because of the relative costs of labor in the two countries, and labor costs are likely driven by the productivity of labor (which is itself driven by the ability of relevant sectors, populations, and geographies to absorb new production techniques). People who work in new mass-production car factories, for example, are likely to get paid higher than people who work in toy assembly workshops, and this will drive wages up across a given society as a whole, since laborers (in all sectors) will need to be incentivized to stay in their jobs instead of looking for a job in the newly lucrative manufacturing sector.
What I attempted to show in Big Macs, Catch Up, And The Dollar Index is that both the Penn Effect and the Catch-up Effect only really emerged well after World War II and that they emerged in tandem. Investopedia says, “The catch-up effect is a theory that all economies will eventually converge in terms of per capita income.” But, one has to ask, if the Catch-up Effect were inevitable, how did meaningful gaps ever appear in the first place? History suggests that there have been a lot of contingent variables involved. Globalization as we know it, then, is the process whereby these contingencies are gradually eliminated (the world is becoming “flat”) or suppressed (setting up an ultimate “revenge” of culture and geography), thus permitting rapid convergence across the globe.
If you push back the historical analysis to before the 1970s, you will find that the Penn Effect, for example, did not appear to exist until the early 1960s, or at least was very weak. The next two charts are from my earlier articles using an older dataset.
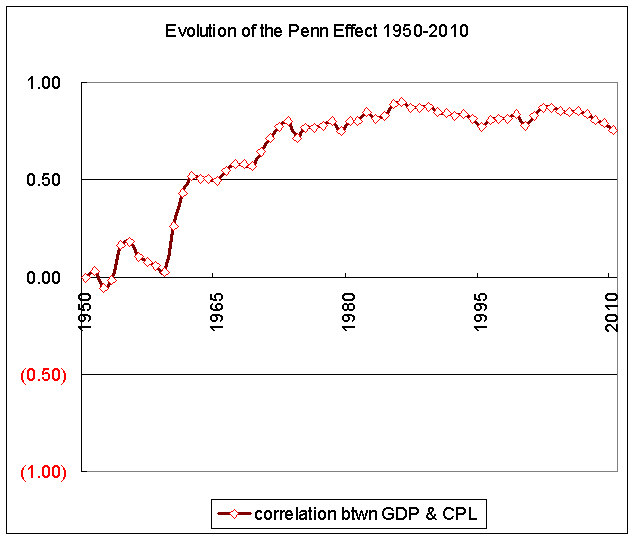
Chart I. Earlier research suggests that the correlation between price and wealth was almost nonexistent before mid-1960s. (Penn World Table 8)
The following chart suggests that there was no widespread catch-up effect prior to the late 1960s, either (since the red line measuring the correlation between growth and initial income level was near 0).
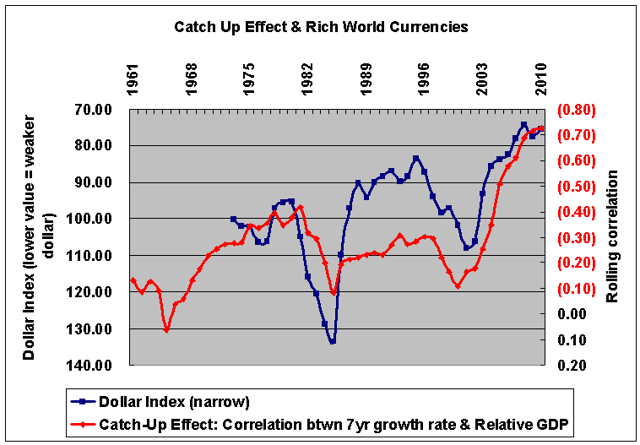
Chart J. The catch-up effect was also virtually non-existent prior to the mid-1960s. (St Louis Fed; Penn Table 8.)
My theory for this is that these sudden waves of catch-up growth and price-wealth correlation are generated by economic phenomena—a brew of monetary and “real” factors—in the global core spilling out into a more or less willing global periphery. In fact, as I recounted in A Reply To Professor Cowen On The Cost Disease, these patterns in the global economy lagged the appearance of virtually identical symptoms in the US domestic economy from sometime around the outbreak of World War I (or, more likely, the establishment of the Federal Reserve).
Once the Federal Reserve began its task of generating inflation in the 1910s, this resulted in the near-immediate deindustrialization of US urban cores (especially in the Northeast but also the Northeast region as a whole) and the spread of industry to both suburban areas (think of suburbs more as urban peripheries than as reified residential zones) and formerly peripheral regions, beginning with the Midwest, and then spreading in waves to the West and South over subsequent decades. Even today, the South and Southwest remain the fastest growing regions.
This is both because of internal changes within these peripheral regions (political and social changes that in many ways rival those that occurred in post-World War II miracle economies) and the desperation of core regions to export their production to, or import labor from, those peripheral regions. We could call this aspect of internal change a process of neoliberalization whereby a society accepts basic concepts of democratic capitalism that dominate in the core of the global economy (often along with a smattering of shibbolethic values that may indicate a population is on the ‘right path’). Although this is ultimately an internal process (you cannot force whole populations to think and behave like New Englanders, Germans, and Japanese), it also tends to come with more overt pressure from the core to accept sociopolitical and economic “reforms” (think of the American South in the 1950s and 1960s or Eastern European and Mediterranean countries in the EU today).
An internal desire among peripheral regions and countries to participate in the obvious economic and humanistic benefits of convergence, external pressure to conform to certain principles (usually framed in the language of rights), and the impact that consumerist/technocratic capitalism has on demographics, aspirations, aesthetics, and mores are the forces driving globalization since World War I (and especially after World War II). There is some empirical evidence from the World Values Survey that backs up this connection between particular stages of development and cultural values:
The shift from an agrarian mode of production to industrial production is linked with a shift from traditional values toward increasing rationalization and secularization. The survival versus self-expression dimension is linked with the rise of a service economy. It shows high correlation with the size of the work force in the service sector…but is only weakly (and negatively) related to the size of the industrial sector…
Postindustrialization brings emancipation from both traditional and secular authority, giving rise to an emancipative ethos. This is why liberal democracy becomes the prevailing political system in postindustrial societies. The linkage between the rise of the service sector and the strength of selfexpression values is replicated at the individual level. Within any given society, those with higher incomes, higher education, and jobs in the service sector tend to emphasize self-expression values more strongly than the rest of their compatriots…
The process of globalization begins as a monetary phenomenon but quickly produces a whole series of changes at multiple levels of the global socioeconomic system, from the individual’s dreams and values to the demographic distributions within countries to, potentially, clashes of civilizations.
But, if these convergence miracles really originated in the core economies, why would they have been so eager to create potential economic and political rivals in the first place? If the benefits of participating in this process are fairly obvious to many peripheral regions and countries, is it possible that the balance of preferences could reverse among those regions, if the economic benefits were judged to be outweighed by a perceived cost to identity, values, or security?
Again, from the World Values Survey:
Norms concerning marriage, family, gender and sexual orientation show dramatic changes but virtually all advanced industrial societies have been moving in the same direction, at roughly similar speeds. This has brought a parallel movement,[but] without convergence. Moreover, while economically advanced societies have been changing rather rapidly, countries that remained economically stagnant showed little value change. As a result, there has been a growing divergence between the prevailing values in low-income countries and high-income countries.
Not only may peripheral countries grow more wary of participating in the modern form of globalization, but core regions may grow weary of allowing those peripheral regions to continue to participate, if the latter refuse to accept what are regarded as the bare minimum social and political values that the core sees as nonnegotiable.
Convergence and costs of convergence
Going back to the example of the US economy after the establishment of the Federal Reserve, as the “cost disease” of rising wages and emerging technocratic classes ate into the sustainability of the economy of a given locality or region, growth booms moved elsewhere. The rise and then fall of Detroit is perhaps the quintessential example of this process. But, the tendency of rich, services-dominated regions to have higher prices than peripheral regions is persistent across countries, as the chart below helps illustrate.
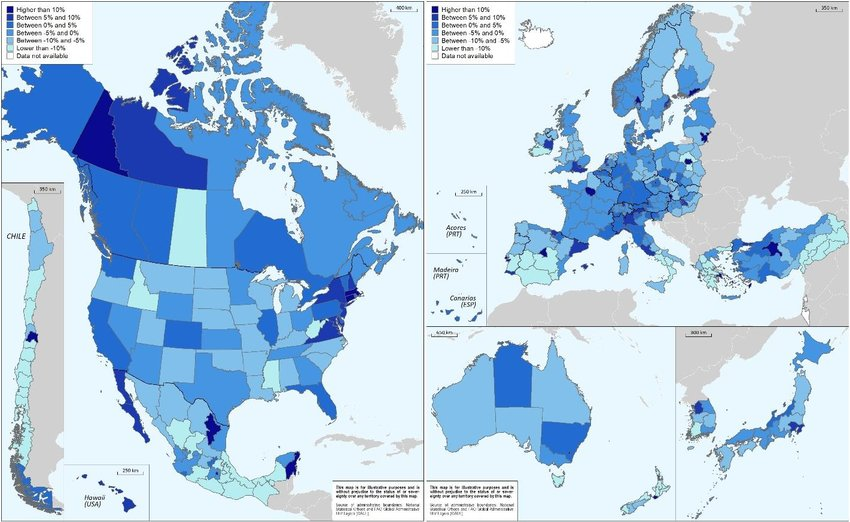
Chart K. Within countries, prices tend to be higher in wealthier, service-dominated regions. (Subnational Purchasing Power Parities in OECD countries by Costa, Garci, Raymond, and Sanchez-Serra)
Simply based on my anecdotal reading of urban history (Downtown: Its Rise and Fall, 1880–1950 is one book worth a close reading), prices have always tended to be somewhat higher in urban areas, but after the establishment of the Fed and the shift away from a gold standard, this tendency was exaggerated in urban cores and quickly spilled out into peripheral regions, first domestically within the US and then to Western Europe and Japan, and then to East Asia, and then to Southeast Asia, China, Mexico, and South Asia.
In the two or three years up until the eve of the pandemic, I made a point of taking walking tours of Shanghai, Seoul, Taipei, Manila, Ho Chi Minh City, Phnom Penh, Bangkok, Kuala Lumpur, and Jakarta and reading as much as I could about their urban histories as well as those of Osaka and Tokyo. Most of these cities are cauldrons of recently rural populations, foreign capital, export demand, and cosmopolitanism. Although these cities engage in some of the same skyscraper-building that occurred in America’s hyperindustrial phase, the overwhelming tendency is to build out rather than up, just as it has been in the US. (This is often blamed on the automobile, but my reading of modern urban history is that the automobile largely enabled the escape from urban cost disease rather than being the primary cause of sprawl). The word “city” is almost an anachronism; many of these are simply urban agglomerations, with Jakarta (more properly, Jabotabek or Jabodetabek) perhaps being the most notorious and fascinating of them. The areas beyond these sprawling “primate cities”, the countryside, tends to remain relatively stagnant, although earnings from relatives sent to the city to work in factories or on construction sites may flow back into rural regions to finance farms, businesses, or other family members’ educations.
The point is, globalization is built around a process of money creation—or, more precisely, inflation creation that is a jointly monetary and real phenomenon—that begins with the Fed and then flows through the global economy from the developed core and outwards to peripheral regions that are simultaneously pulled in closer. It is an extension of a process that began in the domestic US economy and then infected the rest of the world. In newly-joining peripheral economies, this process often seems to act as a process of comparative deflation, presumably as both cheaper foreign goods are permitted in and leaps in productivity push goods prices down.
This is not the only possible type of globalization, but it is the one we have had since the World Wars, and perhaps it is the only type of globalization possible on a reserve-status fiat currency. But, is it sustainable?
Dollar Globalization Undermines Itself
The printing of dollars—through whatever magic and in whatever form—flows into poor countries, jacks up their growth, and readjusts their price levels to roughly coincide with their wealth levels. (In Switzerland, the process was reversed; already a wealthy country, it experienced high levels of relative inflation through an appreciating currency). Over time, these countries become wealthier but also more expensive. And, this creates two problems that may become fatal to the system.
One, what happens when you run out of poor countries? Where can the globe find a cheap and exploitable labor force to continue this process? Are there natural or cultural limits to this process? To put this in more simplistic terms: Can we replace China? There are some possible candidates. Southeast Asia, South Asia, Latin America, Africa. India has to stand foremost among these possibilities, but it is a diverse and rambunctious democracy that has shown very few signs of an interest in pursuing an East Asia growth model. It is very possible that we have come to the effective end of the globalization frontier. Not an absolute frontier but a frontier where all the easy gains within the post-War globalization process have already been made and both the potential benefits are less obvious and the populist paths (left, right, other) seem more attractive.
There appears to be, for example, a structural tendency within the process of globalization that results in most economies never being able to catch up with the US and for non-US price levels remaining significantly higher than their wealth levels would suggest that they ought to be. In the chart below, real GDP levels only reach or exceed US levels in a handful of small countries.
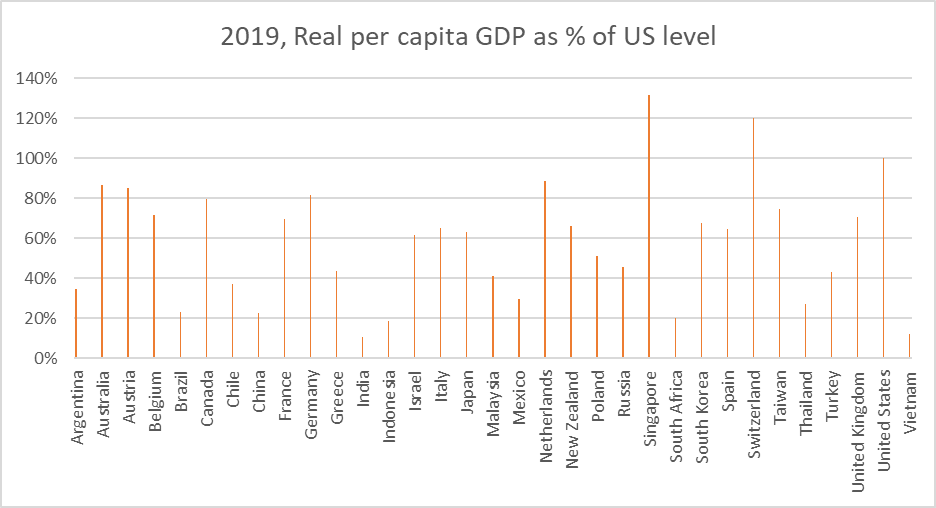
Chart L. Although wealth levels have grown closer to the US, only a couple of small countries succeed in catching up. (Author calculations from Penn World Table 10, Groningen University)
The following chart suggests that there is some built-in tendency for prices to remain higher in economies peripheral to the US, and the evidence, as pointed out earlier, suggests this is done through a tendency for currencies to move rather than changes in domestic inflation levels once they achieve a relative degree of convergence.
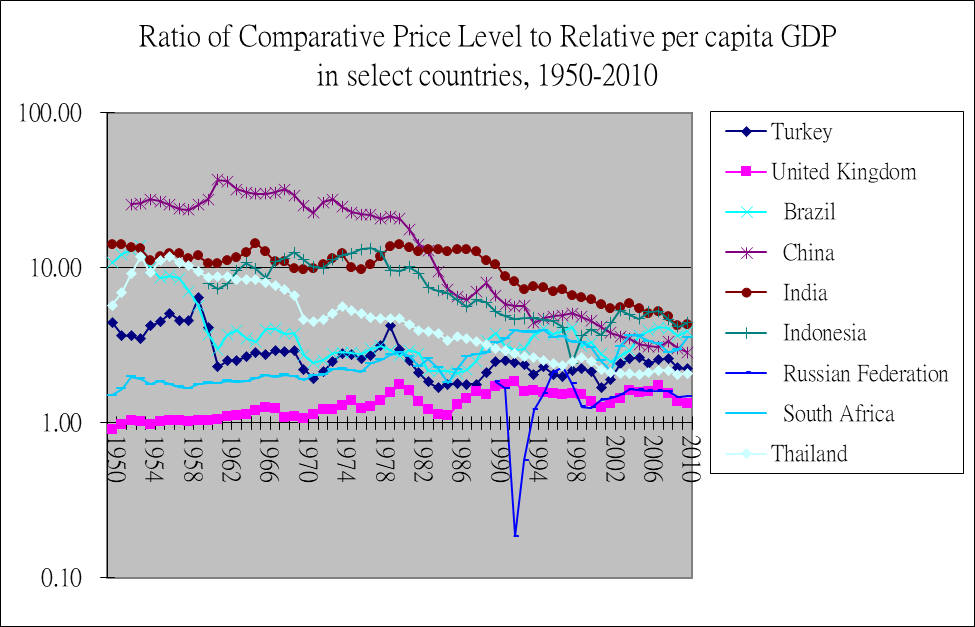
Chart M. Comparative price levels and relative wealth levels have all converged as globalization has spread. (Author calculations from Penn World Table 8)
As of 2019, price levels still remained high across most countries (above 1 in the chart below), especially among the BRICS.
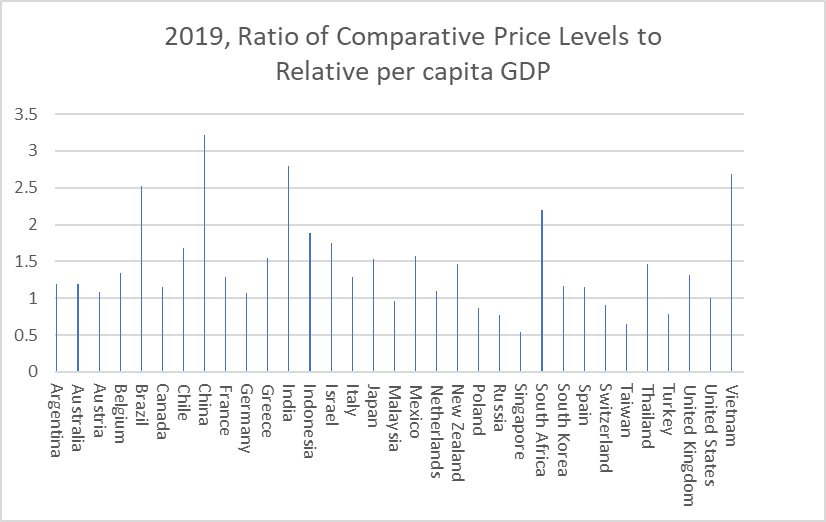
Chart N. Typically prices remain higher than what might otherwise be expected from wealth levels (Author calculations from Penn Table 10, Groningen University.)
Russia, the most notable exception to the BRICS rule, has a history of collapsing price levels (primarily via the currency) during periods of political crisis or conflict. Russia’s price level fell after the annexation of Crimea, for example, due to a plunge in the ruble.
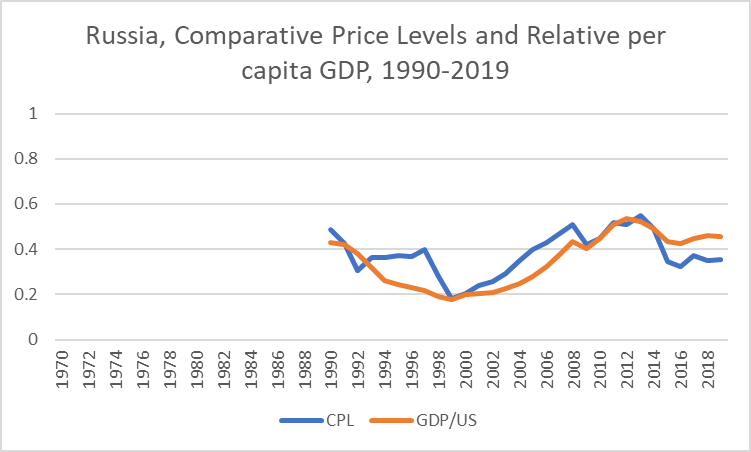
Chart O. Russian prices dropped sharply after the first Russian attack on Ukraine. (Author calculations from Penn World Table 10, Groningen University)
Turkey, another autocratic country that has chaffed against US-led globalization has also seen falling price levels driven by currency collapse.
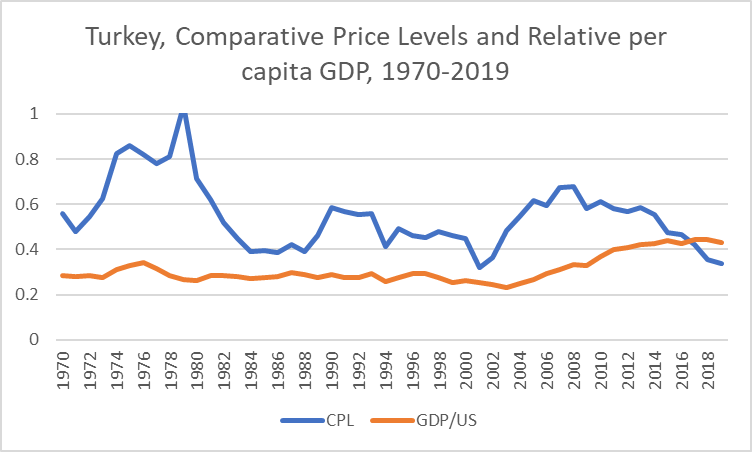
Chart P. Turkish price levels fell as the country began to shun globalization standards in the 2010s. (Author calculations from Penn World Table 10, Groningen University)
In both instances (Russia and Turkey), these episodes occurred after periods of economic strength as suggested by their relative GDP levels. On the other hand, there are some highly globalized countries (Singapore, Switzerland, and Taiwan, for example) that have very low prices relative to their wealth levels.
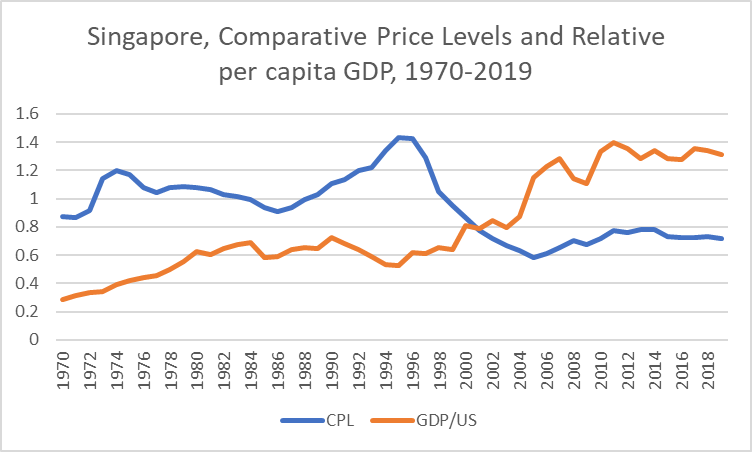
Chart Q. Small, wealthy, open economies have also seen declining prices. (Author calculations from Penn World Table 10, Groningen University)
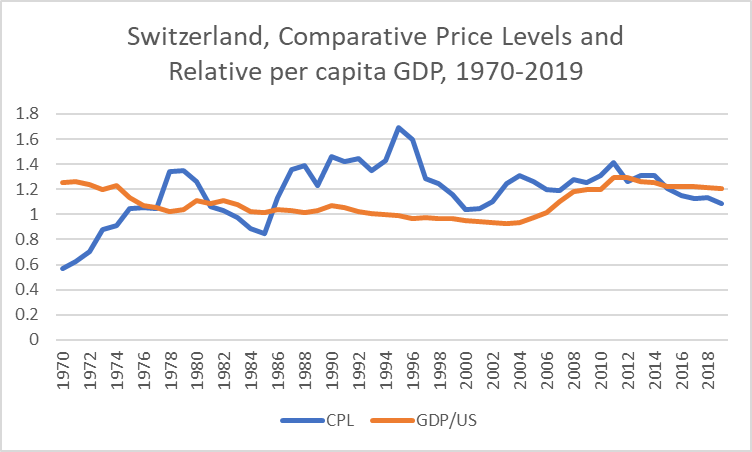
Chart R. Swiss prices fell through maintaining low levels of domestic inflation. (Author calculations from Penn World Table 10, Groningen University)
And in Switzerland’s and Singapore’s cases, they (unusually for rich country) lowered their comparative price levels primarily through maintaining low domestic inflation rates (see the following chart from 1996-2021) rather than currency weakness.
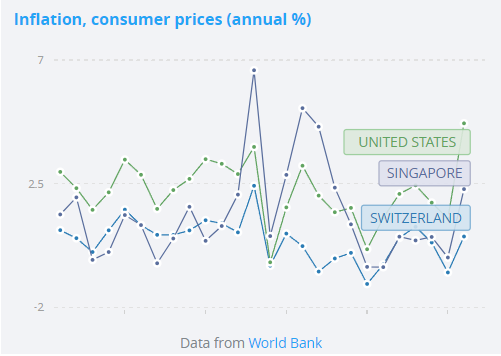
Chart S. Low inflation in Singapore and Switzerland are the primary explanation for seeing falling CPL values. (World Bank)
In other words, if in Turkey and Russia, the collapse in comparative price levels seems to have been spurred by a more or less conscious rejection of the process of globalization, this collapse has also occurred in rich, small, open economies, as well.
What if the system of dollar globalization boosts a country that wishes not to exit the process of globalization but to replace the core economy in that process? Ultimately, the Fed’s power to print rests on the productivity of the American economy and the moral and military power of the American state, but as the above analysis implies, these factors are themselves entangled with the process of globalization. Globalization is, in many critical ways, Americanization. If any country or region wished to undermine the process of globalization or the US’s role as globalization backstop (even from within the core itself?), it would send ripples and waves throughout the system—probably in terms of relative growth levels and relative price levels (both in exchange rates and domestic inflation) but also in terms of absolute levels.
But, perhaps there is no choice. If globalization is hitting a frontier (geographically, economically, politically, socially, psychologically) whereby the engine of global growth can no longer feed on the export of capital to regions with cheap labor, where do incentives across countries and classes then align? Needless to say, this would unlikely be a linear process. As the background level of inflation is likely to rise (since that pressure could no longer be exported), it also may become more volatile, and economic growth (including corporate profits) may be structurally lower and more volatile until a solution is found, if ever. The social, political, and geopolitical ramifications have to be factored in, or at least noted, as well.
We do not have an experience—or at least none comes to mind—of a situation in which we have had to confront the phenomenon of cost disease head-on. As in the case of Detroit, we have exported the jobs, population, and growth and held on to the high prices and urban decay. It is very hard to imagine what a Detroit with reshored industrial capacity would look like. Bring the jobs back, and this would likely reignite cost disease, which makes itself felt most intensely in the costs of education and health and the creation of societies bifurcated between rational but aloof technocrats and irrational but relatable populists.
In short, cost disease has to “blow” at some point or another. Either it succeeds in continuing to push forward the process of globalization until the entire globe is flat and expensive, or it pushes the process beyond the capacity of the globe to absorb the demands it creates, and this then leads to socioeconomic dislocations that are likely to play out at the level of identity and politics.
Fiat-induced inflation, in a word, pushes through different asset classes, social classes, regions, and industries at different speeds and at different times, and where it is accelerated through artificial means, it distorts economic incentives and political and social order at multiple levels. It also creates multiple points of failure that could, if triggered, cascade into a systemic breakdown.
Back to the dollar
The sharp break upwards in the DXY suggests, as alluded to above, that emerging market growth is, on a relative basis, declining. And with the globe as a whole slowing, this suggests a sharp absolute decline in emerging and indeed middle-income markets, which has been reflected to some degree in equity markets.

Chart T. Emerging market equity performance has largely tracked rich-world currency strength over the last 20 years. (Stockcharts.com)
The history of the process of globalization suggests that a reversal in DXY’s recent strength (that is a reversal in the recent weakness in the yen, pound, euro, etc.) is likely to come at the point of maximum emerging market pain, not necessarily because of a direct link between, say, the euro and the Bangladeshi economy, but because the pulse of globalization runs through developed world currencies and economies differently than it does in emerging market ones.
But, what would DXY’s performance look like if globalization began to systematically unravel? If the US were reshoring industry, even at the price of higher inflation, while the rest of the globe saw reduced growth and perhaps increasing degrees of regional and domestic anxiety, we may see, as in some economies led by anti-globalization governments, a much stronger dollar than has been the trend of the last 50 years would suggest is likely.
A sharp move downwards in peripheral economies accompanied by a sharp appreciation in the dollar and a breakdown in globalization are not mutually exclusive options. My own bias is that, against a backdrop of rising dissatisfaction with globalization and the growing sense of threatened identities on the left and right playing out at multiple levels of global society (religiously, civilizationally, religiously, nationally, regionally, and individually), a deterioration in dollar-denominated globalization is increasingly likely.
But, to go from the dollar to some alternative global fiat monetary basis would almost inevitably require a lot of political and economic chaos along the way, and in any such global monetary revolution, not only would the process be messy and perhaps extremely violent, as with most revolutions, it would be almost impossible to predict who or what system ultimately ended up on top. The dilemma is that the dollar system is probably unsustainable but the switching costs are extremely high.
Conclusion
The dollar is therefore unlikely to be losing its role anytime soon. As globalization comes undone, quietly here and more aggressively there, this will be a grave challenge to global stability, including the US, but it is likely to create even more instability in peripheral economies that have used dollar globalization to ‘miraculously’ pull themselves out of poverty. Structurally slower growth, domestic instability, and geopolitical dangers are all likely to make the dollar look like a relatively secure place to put one’s money (if legal obstacles do not prevent it).
It is likely therefore that the DXY has permanently broken out of its 50-year downward trend. But, this is only the beginning of a much longer and more painful process of moving towards a new global and monetary order. A reshoring US, for example, will be under pressure domestically to move beyond a model that exports cost disease and imports global capital and corporate earnings in exchange. Other economies will be under related and pressures. Crises will break out in the US one year, in Europe a second year, East Asia a third, and emerging markets a fourth. At times the present system will look more stable than it does now and at other times less stable. All of that suggests that the DXY is unlikely to simply move in a straight line upwards.
Rather, we are likely to see DXY find a new but wide and as yet indeterminate range above its old trend. Under such conditions, it is hard to take an enthusiastic long position, but in a period of declining growth, it might provide some ballast to some portfolios and, in the short term, offer a means of hedging against continued Treasury (IEF) weakness.
Be the first to comment