

mphillips007
Yes, it’s that time of the month again when the critical CPI numbers emerge. The latest forecasts imply that we could see October’s CPI come in at 8.1% YoY, and the core CPI number could be 6.6%. Provided that the Fed has now done four back-to-back 75 basis point increases, inflation is still very high, and this dynamic has the market asking if there will be a fifth. The current benchmark target rate is 3.75-4%, and a fifth 75 basis point increase would bump the Fed funds rate to the 4.50-4.75% range.
The market already feels pain due to higher interest rates and wants to see a minimal 50 basis point move at the next FOMC meeting. A drop from the 75 basis point trajectory down to 50 basis points would imply a possible move toward a more dovish monetary stance and an eventual pivot by the Fed. However, for the market’s dream to materialize, we need to see progress on inflation, and for that, we need a lower-than-expected CPI reading on Thursday.
The S&P 500: 1-Year Chart
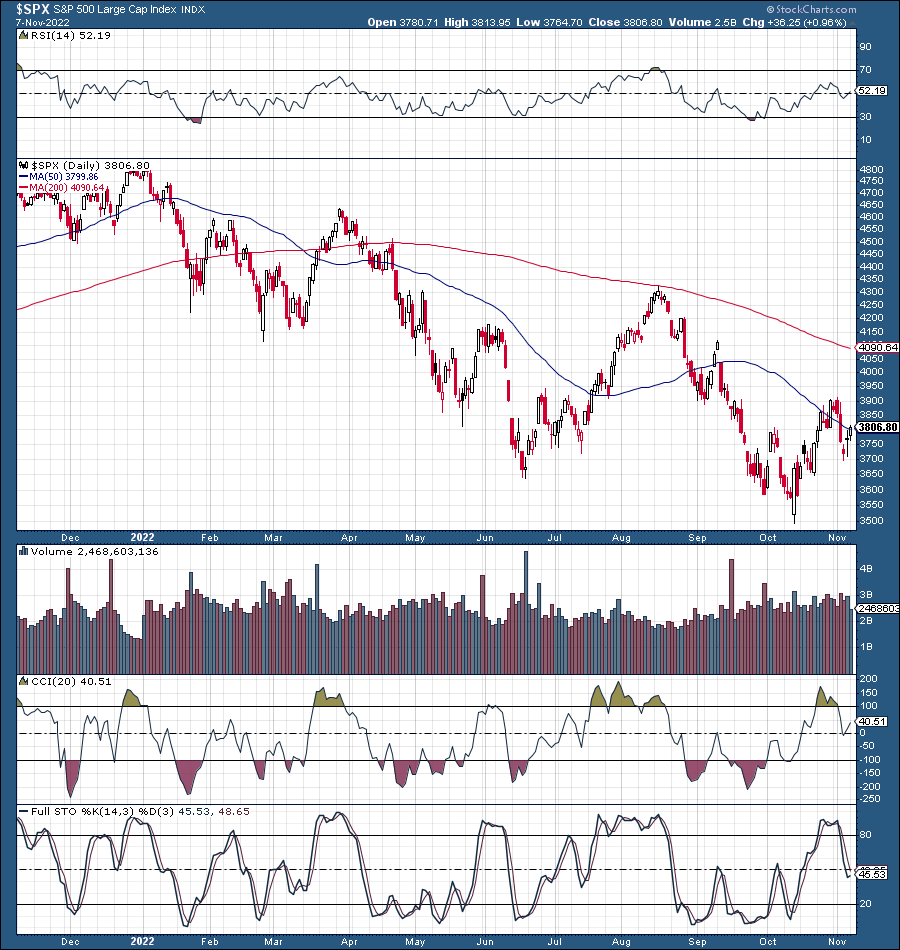
SPX (StockCharts.com)
The S&P 500/SPX (SP500) is at another pivotal moment. The downturn is still intact, and the bear market probably has not ended. Nevertheless, the market hit a tradeable low point in October, around 3,500. The recent rally fizzled out around 3,900 due to a more hawkish-than-expected Fed statement, and now the market is between critical support and resistance levels (3,700-3,900). The $64,000 question is where the market goes from here in the short term, and a lot has to do with the upcoming CPI report.
Post-CPI: Two Primary Scenarios
The critical CPI report will come out Thursday. Here, we can look for two things. Did inflation cool down as much or more than expected, or did inflation rise more than the market anticipates? Therefore, we’re looking at a hot or cold scenario, and the market is sure to react.
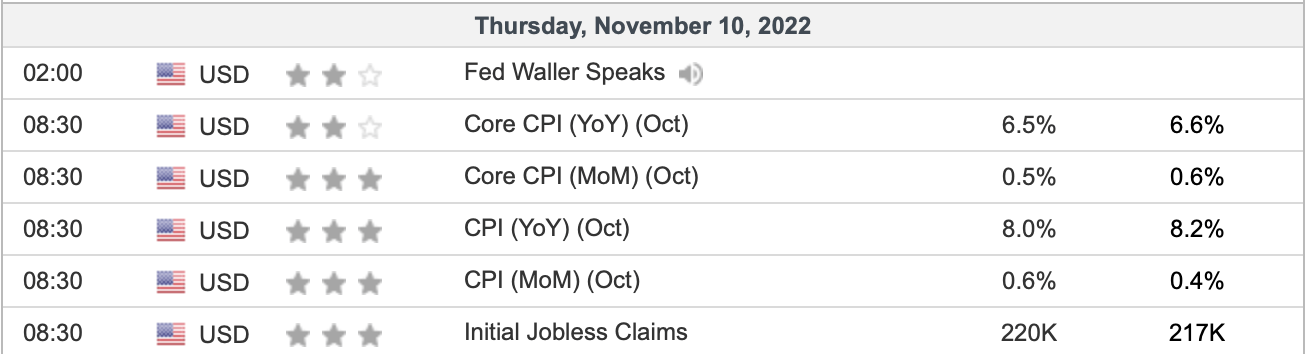
CPI report (Investing.com )
Hotter Inflation – Bearish for Markets
The first scenario is that we may see hotter-than-expected inflation. A CPI reading of 8.1%-8.3% or higher would illustrate that inflation remains more persistent than anticipated and could continue to linger at abnormally high levels as we advance. This scenario also would imply that the market is not responding as favorably as we hoped to the Fed’s “medicine” (higher rates and other tightening measures). This dynamic may illustrate that the Fed is not doing enough to control inflation and that we may need to see a tighter monetary stance for longer. This scenario also would increase the probability of a fifth 75 basis point hike at the next FOMC meeting, pushing the SPX to break below the critical support range at 3,700. Once initial support gets breached, we may see a retest of the 3,600-3,500 support zone and possibly open a new down leg to new lows (3,400-2,800) in this bear market.
Cooler Inflation – Bullish for Markets
On the other hand, we could see the CPI come in at 8% or lower for October. The goldilocks number is around the 7.5-7.9% range. If we see a drop in the CPI on Thursday, it should be considered a breakthrough moment. With the CPI down, inflation is heading lower, and the Fed knows what it’s doing. Therefore, we would not need another 75 basis point move at the December FOMC meeting, and 50 basis points should be enough. Moreover, with inflation moving lower, we should see optimism return, as there would be less potential for future rate increases. Therefore, a lower-than-anticipated inflation reading should spark a positive reaction in the stock market, propelling the SPX above the 3,900 resistance level and possibly forcing the primary index into the 4,000-4,200 zone next.
The Likely Outcome
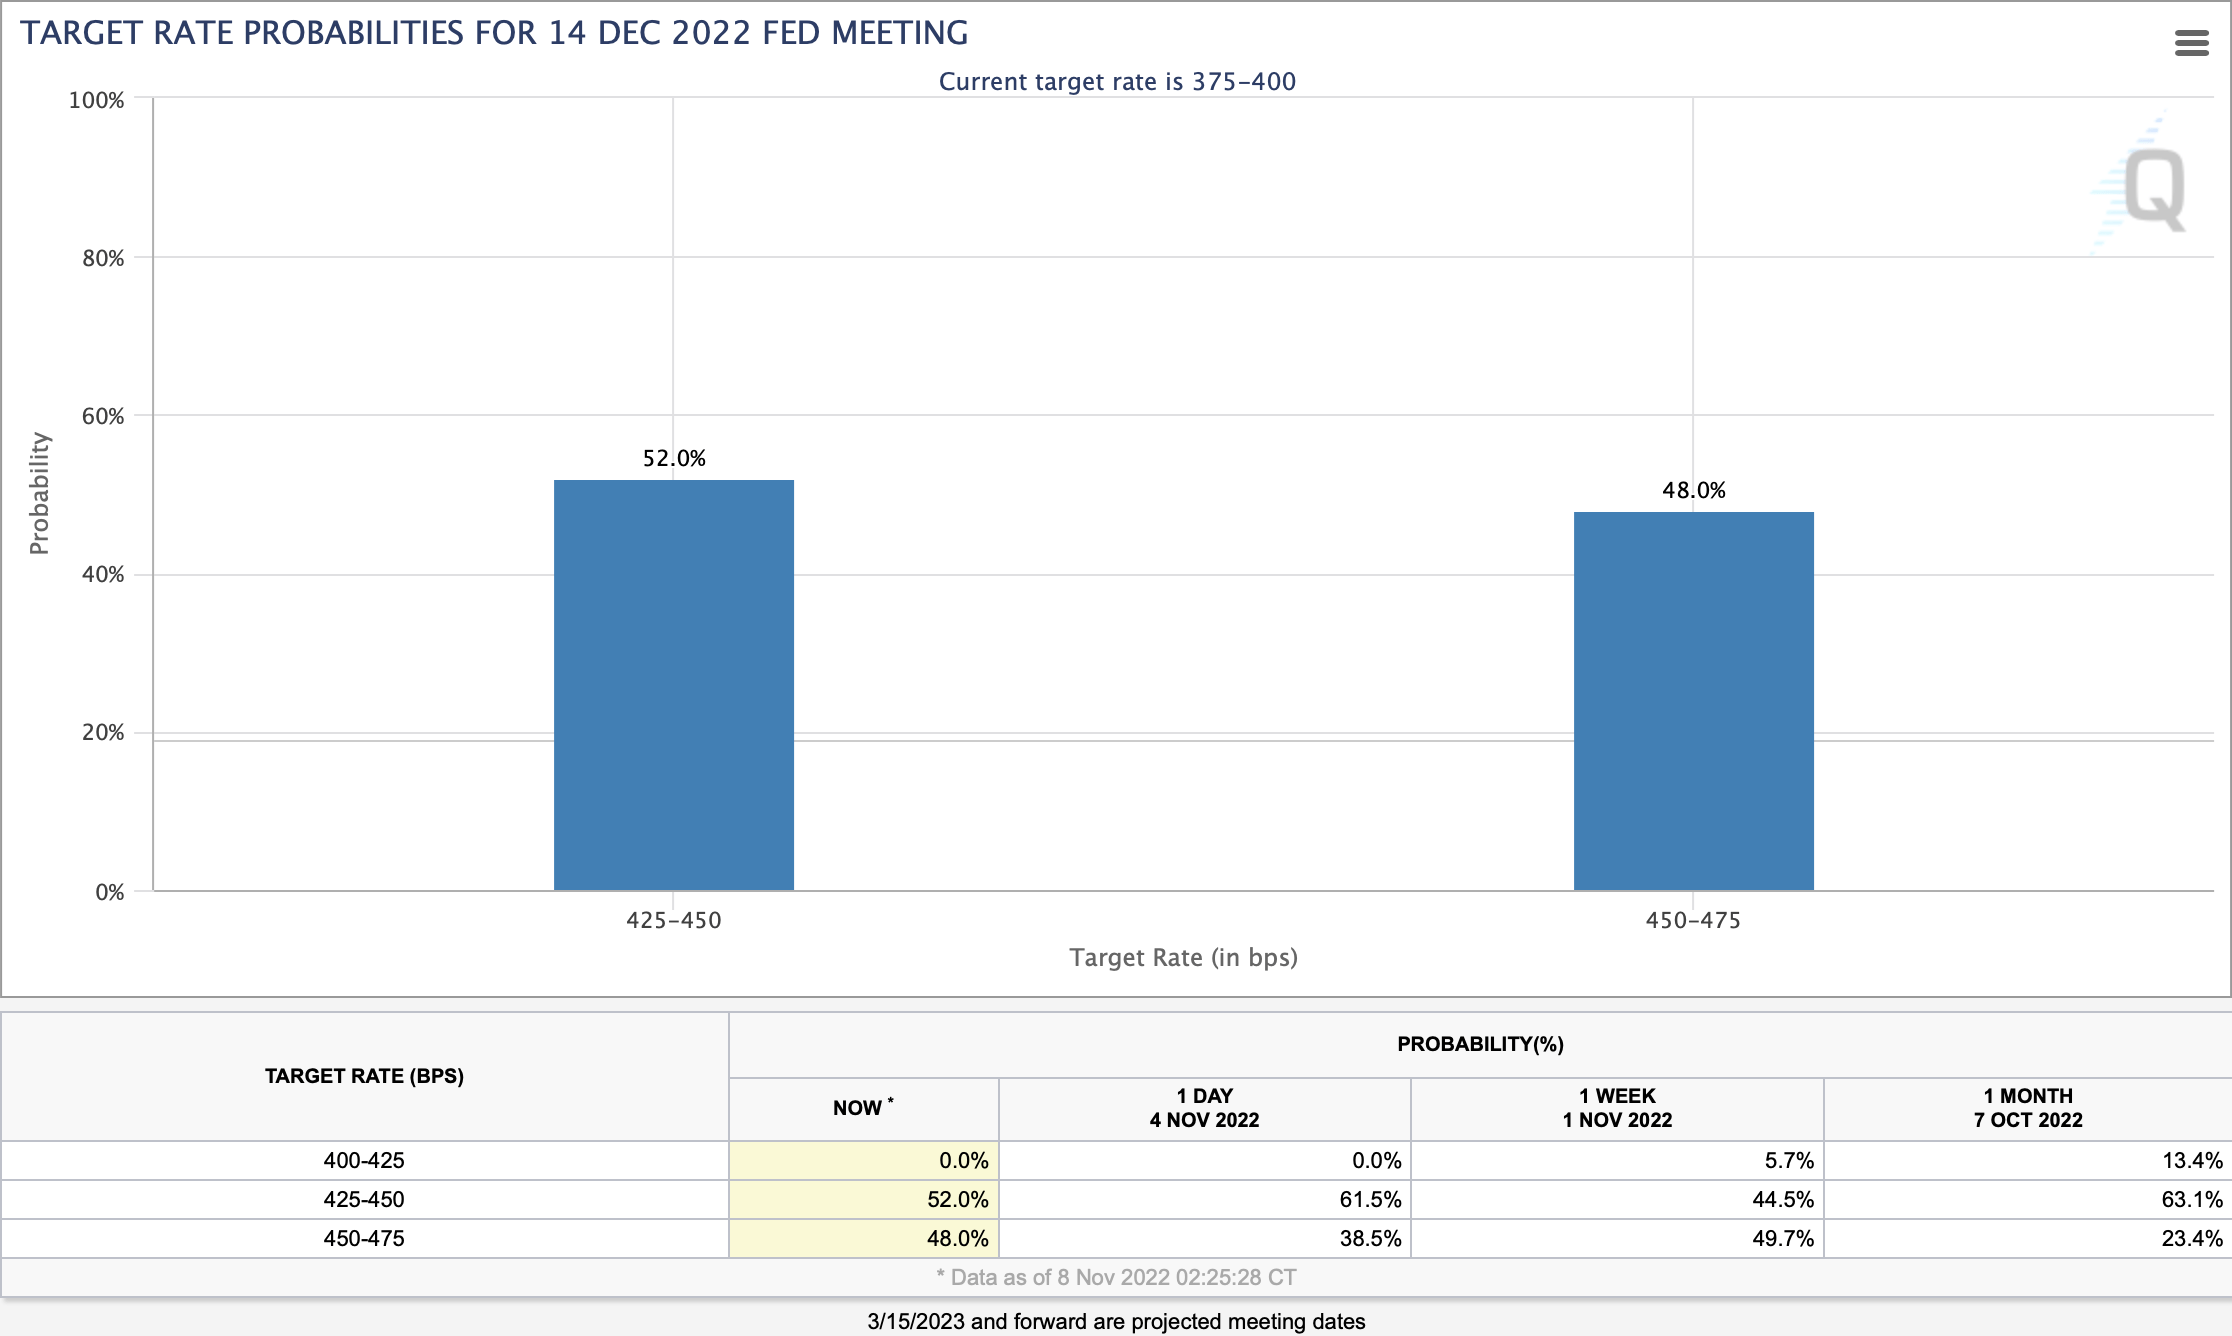
Rate probabilities (CMEGroup.com )
Currently, the probabilities for a 50 basis point hike vs. a 75 basis point increase are nearly 50/50. However, this dynamic should change once the inflation data comes out Thursday. While there’s a chance for a lower CPI reading, probability-wise, the reading may come in at about 8.1%, possibly higher. Therefore, the likelihood of another 75 basis point increase in December may rise. This phenomenon will likely produce an adverse reaction for stocks, and we may see the S&P 500 and other significant averages head south again soon. My bear market bottom buy-in target-range remains around the 2,800-3,200 level in the SPX.
How “Cheap” Are Stocks?
Shiller P/E Ratio

Shiller PE (multpl.com)
According to the Shiller P/E ratio, despite the sharp downtick, stocks still are not very cheap historically. Earnings have begun to decline, and the Shiller P/E ratio should continue compressing. We may see compression continue, bringing the SPX’s Shiller P/E ratio down to 20-24, roughly a 15-30% decline from current levels. What does this mean for stocks? Stocks could correct further, and while another 30% drop seems improbable, a slide to the 3,200-2,800 SPX target range would equate to around a 15-26% drop from current levels.
Be the first to comment