blackred
By George Valantasis
During a time of acute monetary policy tightening throughout much of the western world, major Asian central banks have remained relatively more accommodative. In China, the People’s Bank of China cut its key five-year prime loan rate last week1 after cutting it only a few months ago in May.
In addition to the looser monetary policy, growth forecasts in the region appear to be strong. The International Monetary Fund is forecasting GDP growth in the Asia Pacific region to be 4.9% in 2022 and 5.1% in 2023.2 For market participants interested in this region due to the aforementioned macroeconomic tailwinds, a dividend growth strategy such as the S&P Pan Asia Dividend Aristocrats® may be worth considering.
A Focus on Dividends and Quality
To qualify for the index, companies must have followed a managed dividends policy of increasing dividends for at least seven consecutive years (with a one-year constant dividend growth buffer). Companies must also have positive earnings and a dividend payout ratio between 0% and 100%. To avoid dividend traps, stocks with an indicated annualized dividend (IAD) yield above 10% are excluded from the index. The S&P Dividend Aristocrats methodology provides a ballast for investors since the ability to consistently grow dividends every year through different economic environments can be an indication of financial strength and discipline.
Lastly, companies that pass these filters are ranked by their IAD yield, with the top 100 stocks selected. The weighting caps are 5% for single stocks, 30% for countries and 30% for sectors.
Examining Country Exposure
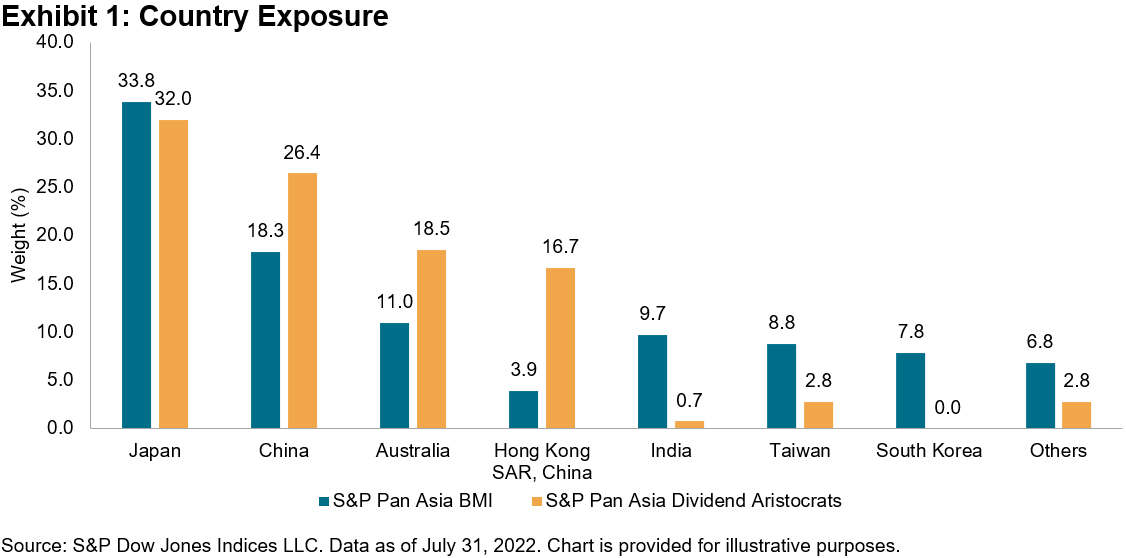
Exhibit 1 shows the country weights for the S&P Pan Asia Dividend Aristocrats versus the S&P Pan Asia BMI. Compared with the S&P Pan Asia BMI, the S&P Pan Asia Dividend Aristocrats had a substantial overweight to China (particularly Hong Kong) and Australia and a slight underweight to Japan. These three countries accounted for over 93% of the weight in the S&P Pan Asia Dividend Aristocrats.
Country exposure (S&P Dow Jones Indices LLC)
Yield Advantage
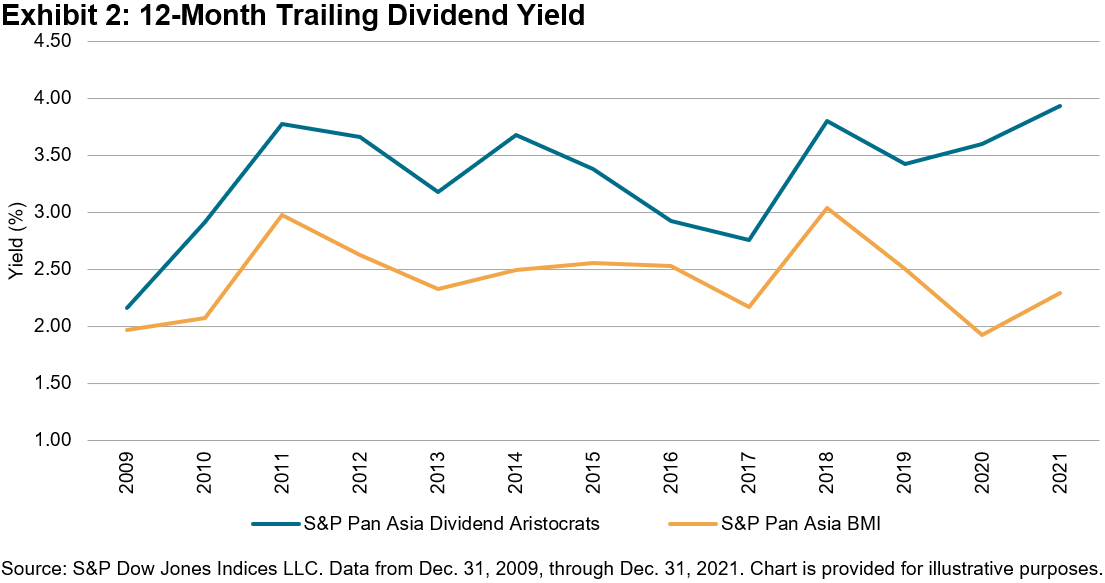
Looking at Exhibit 2, the S&P Pan Asia Dividend Aristocrats has shown considerable yield enhancement over the S&P Pan Asia BMI. Over the full period, the S&P Pan Asia Dividend Aristocrats averaged a 3.32% 12-month trailing dividend yield versus 2.42% for the S&P Pan Asia BMI.
Recently, the yield pick-up has been more pronounced. The difference in yield in 2020 and 2021 was 1.68% and 1.64%, respectively, compared with only 0.9% over the full period.
TTM dividend yield (S&P Dow Jones Indices LLC)
Fundamental Ratios
Exhibit 3 shows common valuation ratios for the S&P Pan Asia Dividend Aristocrats versus the S&P Pan Asia BMI. The S&P Pan Asia Dividend Aristocrats trades at a substantial discount versus its benchmark, with an average discount across the four metrics of 34%. Importantly, the S&P Pan Asia Dividend Aristocrats trades at a forward one-year price-to-earnings (P/E) ratio of 9.86 and price-to-cash flow (P/CF) ratio of 7.69, equating to a 22% and 50% discount, respectively.
Fundamental valuation ratios (S&P Dow Jones Indices LLC)
Performance
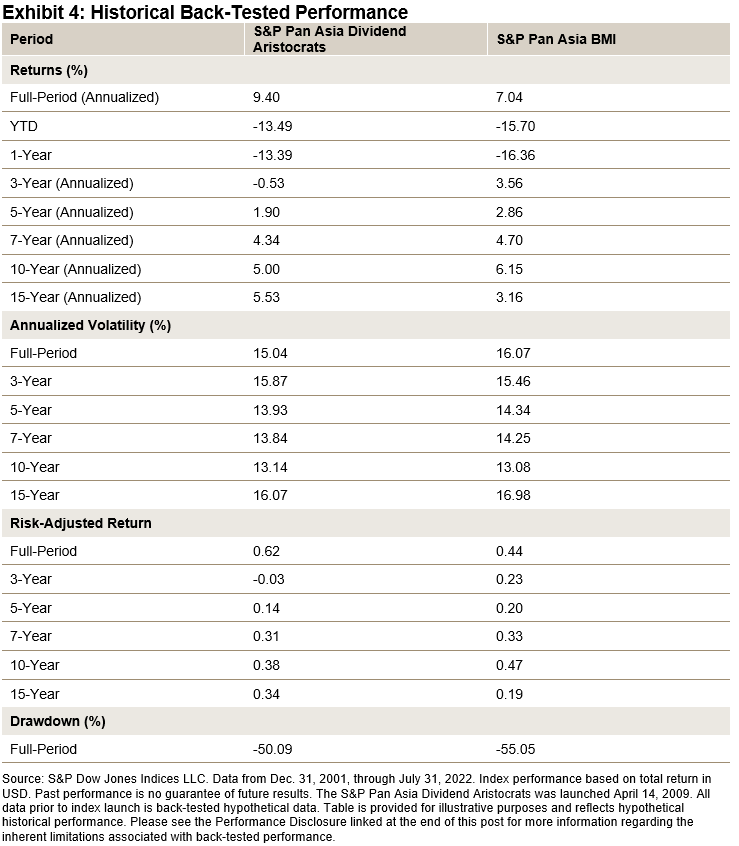
Exhibit 4 displays the strong full-period performance of the S&P Pan Asia Dividend Aristocrats compared with the S&P Pan Asia BMI. Since December 2001, the S&P Pan Asia Dividend Aristocrats has generated a 9.40% annualized return versus 7.04% for the benchmark, while exhibiting less volatility.
Over a short-term horizon, the S&P Pan Asia Dividend Aristocrats also demonstrated relative outperformance over its benchmark. YTD, the index was down 13.49% versus a decline of 15.70% for the benchmark.
In general, the S&P Pan Asia Dividend Aristocrats generated lower volatility in most time periods measured and registered a nearly 5% improvement in maximum drawdown versus the benchmark.
Historical performance (S&P Dow Jones Indices LLC)
With its dividend yield enhancement, modest valuation and attractive long-term risk-adjusted returns, the Pan Asia Dividend Aristocrats could provide a potential opportunity for market participants seeking exposure to the Pan Asia region.
1 See Chinese Banks Cut Rates to Spur Economic Growth
2 See Regional Economic Outlook: Asia and Pacific
Disclosure: Copyright © 2022 S&P Dow Jones Indices LLC, a division of S&P Global. All rights reserved. This material is reproduced with the prior written consent of S&P DJI. For more information on S&P DJI please visit www.spdji.com. For full terms of use and disclosures please visit Terms of Use.
Editor’s Note: The summary bullets for this article were chosen by Seeking Alpha editors.


Be the first to comment