

shapecharge/E+ via Getty Images
A Look Back at 2022
2022 was a painful year for equity investors and speculators alike. The major U.S. stock indices all declined, with the Nasdaq losing ~33% and the S&P falling by ~18%, while the Dow Jones Industrial Average lost “only” ~7%. International and emerging market equity investors weren’t spared, either, with the MSCI All Country World index of developed and emerging market equities down almost 20% in 2022 (the worst decline since 2008). London’s FTSE 100, which consists largely of energy, mining, and pharmaceutical companies, was a rare bright spot, increasing slightly in pounds sterling. According to Tommy Stubbington and Adam Samson, writing in the Financial Times, the market value of companies traded across all global stock exchanges dropped approximately $25 trillion in 2022.
The best-performing major asset class in 2022 was commodities, which advanced 16% even as all other major asset classes (except cash) produced negative returns. REITs produced the worst return (excluding cryptocurrencies, which we do not consider to be a major asset class), declining by 25%. Bond investors were pummeled as well, with the U.S. 10-year government bond yield starting 2022 at approximately 1.5% but ending the year at 3.9%. (Bond prices move inversely with interest rates.) The Bloomberg multiverse index, which tracks global government and corporate debt, declined almost 16% ($9.6 trillion in market value).
Source: JP Morgan 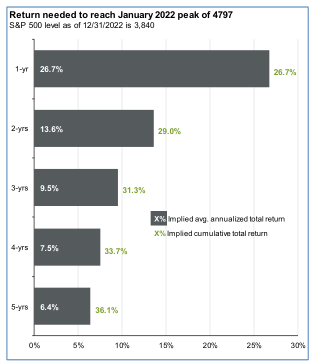
Equity performance started off poorly in 2022, and the situation only got worse. According to Caitlin McCabe, writing in the Wall Street Journal, the S&P 500 finished 2022 with only one record close, the DJIA with two record closes, and the Nasdaq with none (for the first time since 2014). McCabe notes that “droughts of record closes can often last for years . . . . [I]n 2008, for example, as the global financial crisis roiled markets, all three major U.S. indices finished the year with no record closes. It took until 2013 for at least one of the indexes to notch a record close again. After the burst of the dot-com bubble in 2000, major U.S. indexes similarly did not see records for years after that.”
Only 2 of the 11 S&P 500 sectors gained value in 2022, with energy advancing 65% and utilities increasing by a meager 1.6%. Notably, 4 sectors declined by over 25%! Since the February 2020 stock market peak, energy shares have advanced 86.6%, dramatically outperforming all other sectors. (The next-best performer was health care, which advanced 37%, and the worst performer was communication services, which declined by 15% even as the S&P 500 increased by 19%.) However, investors eager to jump on the energy bandwagon should recall that energy shares have been a perennial underperformer over longer periods, returning a modest 72% versus 234% for the S&P 500 over the past 10 years.
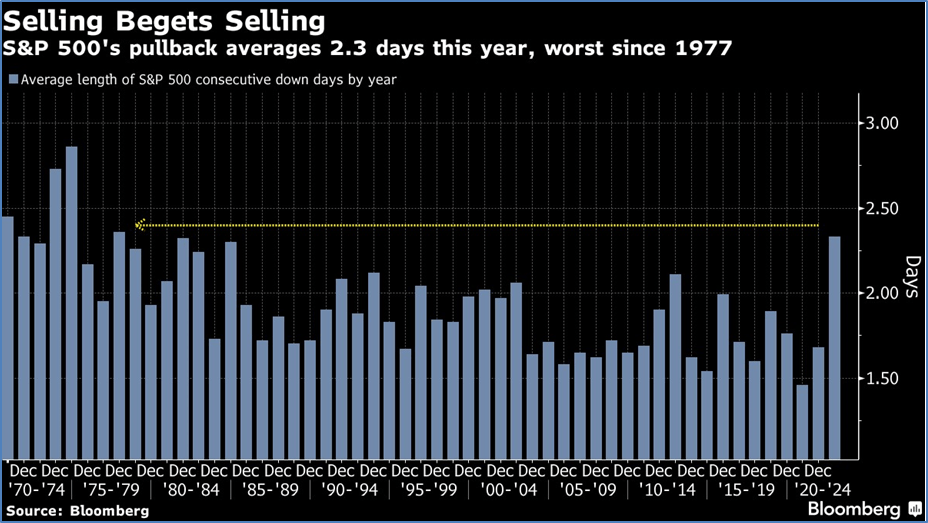
Interestingly, 2022’s decline has been rather muted compared with previous bear markets when looking at total returns (or lack thereof). The bear market is certainly not over, but the 25% peak-to-trough decline seen (thus far) pales in comparison with previous bear markets, which have posted declines averaging 41%, according to JP Morgan. What has been particularly painful from an investing standpoint, however, has been the average length of S&P 500 consecutive down days in a row: at 2.3 days, the average duration of declines has been the worst since 1977—which, combined with three separate bounces of 10% or more, has played with the psyches of professional and amateur investors alike. According to Lu Wang of Bloomberg, in recent months day traders have net sold almost $100 billion of single stocks (unwinding 15% of what they accumulated over the prior 3 years), and Bank of America reports that money managers’ cash holdings rose to 6.1% in the fall, the highest level since the 9/11 attacks.
Reasons for Optimism
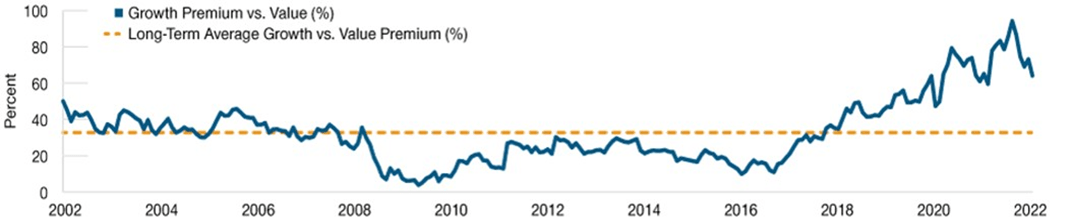
We look forward to better days ahead for our value-oriented style of investing (purchasing intrinsically undervalued stocks of high-quality businesses that have a catalyst for capital appreciation), but we are less optimistic about whether the approach that worked for investors over the past decade (purchasing growth regardless of valuation) will regain its mojo. In our view, the days of “free money,” in the form of ultralow interest rates, will be gone for quite some time. David Kelly of JP Morgan recently summed up the current investing climate well when predicting that “calmer waters should lie ahead for investors. Inflation is falling, the Fed is nearing the end of its tightening cycle, and much of the expected weakness in economic growth is already reflected in market valuations.” Our optimism about value shares reflects the continued valuation discrepancy between growth and value stocks. During 2022, value stocks outperformed growth stocks for the first time in 6 years (as measured by the S&P 500’s performance relative to the S&P 1500 Value), and we believe that continued outperformance is likely. Although the valuation gap between value and growth stocks did narrow during 2022, value stocks remain significantly cheaper than growth stocks.
Relative Premium of U.S. Growth vs. Value Over Past 20 years
Stocks are selling for reasonable valuations
Fortunately for equity investors, stocks are selling for significantly less than they did at the beginning of 2022. The S&P 500 ended 2021 selling for over 21x earnings but was trading for just 16.7x (fwd.) as of December 31, 2022—essentially at its 25-year average of 16.8x. Could the major indices go lower? Absolutely, but we believe that for many companies, stock prices have already bottomed and are now selling at very attractive prices. The major indices are still heavily weighted toward higher-multiple technology companies, and even after the dramatic selloff, technology shares (down 28% in 2022) are selling for more than their historical multiple of earnings (currently 20.2x vs. their 20-year average of 18.0x). We wouldn’t be surprised to see the major indices trade sideways for the next few years, but stocks that are outside the major indices or that have lower index weightings could shine.
Commodity prices are declining
While there were many reasons for the 2022 stock market swoon, a major factor in the decline was the dramatic increase in commodity prices. Almost all commodities, from oil to soybeans to lumber, experienced parabolic moves to the upside (helping cause inflation to spike). Fortunately, the laws of gravity are finally starting to apply to commodities, with many essential commodities down significantly from their 2022 highs—a clear positive for both businesses and consumers (and presumably, at some point, the stock market). The Bloomberg commodity index, which advanced 16%, was the only major asset class that could have earned investors a significant return in 2022, but historically it has been a horrible place to invest (producing an annualized return of −2.6% since 2008).
|
Commodity prices: Bloomberg commodity index constituents |
|||
|
Bloomberg Commodity Index |
|||
|
Constituents |
Current price level |
YTD change |
Change since 6/9/2022* |
|
Sub-indices |
|||
|
Energy $41.23 |
33.5% |
-33.5% |
|
|
WTI crude oil $80.26 |
6.5% |
-34.0% |
|
|
Natural gas $0.18 |
17.5% |
-52.4% |
|
|
Brent crude $487.22 |
38.9% |
-19.7% |
|
|
Low sulphur gas oil $309.39 |
77.9% |
-18.9% |
|
|
RBOB gasoline $472.34 |
45.7% |
-22.8% |
|
|
ULS diesel $4.54 |
25.5% |
-18.1% |
|
|
Grains $48.64 |
15.6% |
-13.5% |
|
|
Corn $13.66 |
20.5% |
-7.8% |
|
|
Soybeans $81.94 |
27.0% |
-14.7% |
|
|
Soybean meal $920.27 |
28.2% |
18.8% |
|
|
Wheat $39.02 |
-4.2% |
-29.2% |
|
|
Soybean oil $84.27 |
12.2% |
-24.5% |
|
|
HRW wheat $138.41 |
14.2% |
-17.2% |
|
|
Industrial metals $165.34 |
-4.4% |
-10.2% |
|
|
Copper $341.68 |
-15.3% |
-13.4% |
|
|
Aluminum $33.13 |
-16.8% |
-14.8% |
|
|
Zinc $96.86 |
-12.3% |
-18.0% |
|
|
Nickel $283.62 |
43.7% |
5.7% |
|
|
Precious metals $534.84 |
0.7% |
1.2% |
|
|
Gold $195.79 |
-2.7% |
-3.3% |
|
|
Silver $212.81 |
0.5% |
8.1% |
|
|
Softs $45.40 |
-5.4% |
-14.8% |
|
|
Sugar $103.23 |
9.9% |
4.8% |
|
|
Coffee $10.53 |
-23.4% |
-26.1% |
|
|
Cotton $30.44 |
-8.8% |
-31.5% |
|
|
Livestock $23.60 |
5.3% |
6.7% |
|
|
Live cattle $57.77 |
2.6% |
5.9% |
|
|
Lean hogs $4.38 |
10.8% |
7.1% |
|
The historical record supports a recovery
The historical record also provides some reasons for optimism. Consecutive down years in terms of performance are rather uncommon and generally occur only amidst major negative macro events. In fact, since 1928, only four initial downturns for the S&P 500 were followed by another down year, corresponding to the Great Depression, World War II, the 1970s energy crisis, and the bursting of the dot-com bubble. One word of caution: in every instance of consecutive down years, the second-year drop was worse than the first. Also, in three of the four cases (the energy crisis excluded), consecutive yearly losses lasted at least 3 years.
U.S. equity investors could be in for a strong 2023 as we enter what has historically been the best performing period of the election cycle for stock market returns, based on data from The Stock Trader’s Almanac. Since 1949, pre-election years have posted an average gain of 16.8%, a figure that rises to 20% after a midterm bear market (such as we saw in 2022). Notably, since 1939, the stock market has been down in the third year of a presidential term on only one occasion (DJIA down 2% in 2015), and over the past hundred years, the only severe loss occurred in 1931, during the Great Depression. What’s more, from the midterm low to the pre-election-year high, the DJIA has averaged a gain of 46.8% since 1941, with the NASDAQ advancing 68.2% on average since 1974. So, if history is any guide, 2023 might well be a significantly better year for stock market investors.
Where We Are Finding Value
We see small-cap companies as particularly attractive, and they have been hit hard during the selloff, with the S&P 600 (comprising smaller-capitalization companies) having declined 17% in 2022. Not only are such companies historically cheap, trading at just 12.7x expected earnings (below their 20-year average of 15.4x), but they are also far more insulated from the negative effects of a strong U.S. dollar than multinational companies, which sell more of their goods/services overseas. According to the Wall Street Journal, components of the S&P 600 generate just 20% of their sales abroad, versus 40% for the larger cap S&P 500.
Housing
After a pandemic-fueled run during which home prices increased 45% from January 2020 to June 2022, as measured by the S&P CoreLogic Case Shiller National Home Price Index, investors in U.S. housing were abruptly reminded that housing prices can indeed decrease. Higher 30-year mortgage rates, which started 2022 at ~3.27% and peaked (at least temporarily) at ~7.35%, have ended the days of frenetic bidding wars, long lines at open houses, and rapid home price appreciation.
Many competing dynamics will be driving the housing market for the foreseeable future. For example, a whole host of homeowners locked in 30-year fixed mortgages at historically low rates (according to the Wall Street Journal, almost 70% of households with mortgages are paying rates below 4%) and thus are unlikely to move in the near term, as current mortgage rates make purchasing a new home significantly more expensive than continuing to pay an existing mortgage. Likewise, existing homeowners who wish to sell their home may stubbornly wait for home prices to return to the “good old days” of months gone by. Ultimately, however, we think that U.S. housing will be cushioned from a destabilizing correction by the tremendous undersupply of homes nationwide, which could serve as a floor for housing prices. (Bloomberg Intelligence estimates a cumulative shortfall of about 2.9-4 million homes built from 2014 to 2022.)
These competing dynamics (among other factors) have prompted wildly varying predictions of where U.S. housing is heading in 2023: Nicole Friedman and Nick Timiraos report in the Wall Street Journal that KPMG LLP is calling for housing prices to drop 20% in 2023, Goldman Sachs is predicting a 7.5% drop, the National Association of Realtors is forecasting a 1.2% increase in existing home prices, and the Mortgage Bankers Association sees prices advancing by 0.7%. Our near-term crystal ball, however, is somewhat cloudy.
Could a Housing Market Correction Be a Repeat of 2008?
For multiple reasons, we do not expect weakness in the U.S. housing market to spill over into the economy as it did in 2008: the undersupply of housing, as already mentioned, should limit the magnitude of potential home price declines; banks’ underwriting standards for mortgage origination are significantly more robust than they were in the run-up to the global financial crisis; and U.S. homeowners have a much more sizeable equity cushion in their homes than they did in 2008. For example, according to Moody’s, negative homeowner equity in 1Q 2008 was ~10.3%, whereas CoreLogic estimates that in 3Q 2022 just 2.2% of properties were under water.
Some Final Thoughts
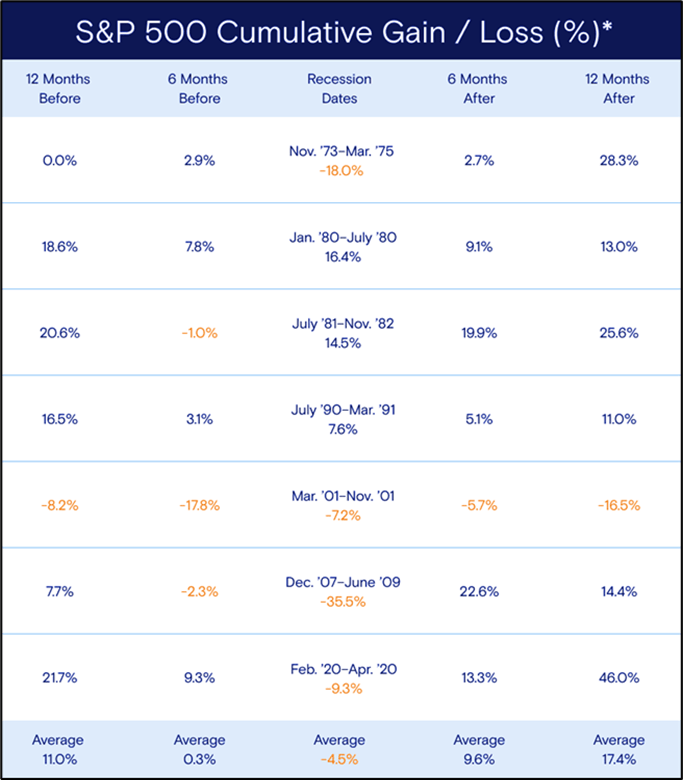
While the economic backdrop is bleak, featuring headwinds such as a war in Europe, a hawkish Federal Reserve, geopolitical tensions with China, dysfunction in Washington, and uncertainty about China’s COVID-19 reopening, reasons for optimism remain. We have found that during times of uncertainty, investing in high-quality companies that are selling at reasonable valuations, with catalysts for capital appreciation, has been a sound strategy. We see no reason this time should be any different. Although we don’t have a crystal ball to tell us when (or if) a recession will begin, or how long one might last, markets have historically delivered strong performance in the wake of (and often during) economic downturns—so we urge investors to stay the course.
S&P Performance Before, During and After Recessions
Best regards,
Mark A. Boyar | Jonathan I. Boyar
IMPORTANT DISCLAIMERPast performance is no guarantee of future results. Investing in equities and fixed income involves risk, including the possible loss of principal. The S&P 500 Index is included to allow you to compare your returns against an unmanaged capitalization-weighted index of 500 stocks designed to measure performance of the broad domestic economy through changes in the aggregate market value of the 500 stocks representing all major industries. The Russell 2000® Value Index measures the performance of the small-cap value segment of the U.S. equity universe. It includes those Russell 2000® companies with lower price-to-book ratios and lower forecasted growth values. The S&P 1500 Value Index measures value stocks using three factors, the ratios of book value, earnings, and sales to price, and the constituents are drawn from the S&P 500, S&P Midcap 400, and S&P SmallCap 600. The Dow Jones Industrial Average is a price-weighted average of 30 significant stocks traded on the New York Stock Exchange and the NASDAQ. The volatility of the abovereferenced indices may materially differ from that of your account(s), and the holdings in your account(s) may differ significantly from the securities that constitute the above-referenced indices. Your results are reported gross of fees. The collection of fees produces a compounding effect on the total rate of return net of management fees. As an example, the effect of investment management fees on the total value of a client’s portfolio assuming (a) quarterly fee assessment, (b) $1,000,000 investment, (c) portfolio return of 8% a year, and (d) 1.50% annual investment advisory fee would be $15,566 in the first year, with cumulative effects of $88,488 over five years and $209,051 over ten years. This material is intended as a broad overview of Boyar Asset Management’s philosophy and process and is subject to change without notice. Account holdings and characteristics may vary, since investment objectives, tax considerations, and other factors differ from account to account. |
Editor’s Note: The summary bullets for this article were chosen by Seeking Alpha editors.
Be the first to comment