

D-Keine/E+ via Getty Images
It’s been a challenging year for equities. The S&P 500/SPX (SP500) is down by almost 20% since the selling began, and the declines may be far from over. Inflation is much higher than expected, and the Fed needs to tighten more aggressively than markets want. Inflation is causing consumer sentiment to worsen, leading to weaker consumer spending. On the other side, inflation erodes corporate margins, leading to deteriorating profitability and slower growth. The Fed must act aggressively and will likely tighten considerably before the year ends.
As the economy slows, we will probably see an earnings recession by year-end or early 2023. Also, once government spending increases can’t keep up with consumer spending declines, we will likely see a general recession in early to mid-2023. The S&P 500 is likely in a bear market, and the bottom may be much lower than the lows we have seen. In my base case scenario, we may see the SPX bottom at around 3,400-3,200, but we may see a bottom materialize much lower in a more bearish case outcome.
The Economy’s Massive Inflation Problem
Did you see those CPI figures on Friday? How about the consumer expectations and sentiment?
CPI/Consumer data (Investing.com)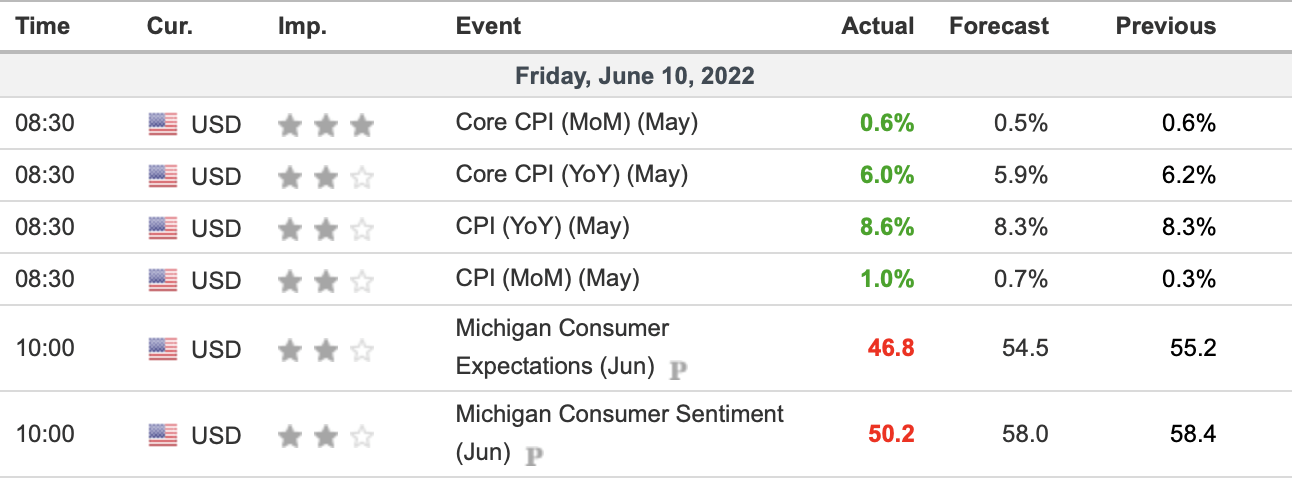
YoY CPI came in at a whopping 8.6% for May. This result is substantially higher than the 8.3% expected rise. Moreover, the 8.6% figure is significantly higher than the previous month’s 8.3% inflation reading. While some analysts anticipated that inflation would cool relatively to last month’s reading, we got a hotter than expected number. This dynamic implies that the Fed does not control the rising inflation environment, and we could continue seeing hotter-than-expected inflation persist for longer than many had anticipated.
On the other side of the equation, we see consumer expectations and sentiment weakening, illustrating that high inflation is continuing to strain the consumer. Persistent high inflation should continue worsening consumer spending and sentiment, leading to slower economic growth. Slower growth should lead to worsening profits for corporate America, and a drop in profits should lead to lower stock prices as we advance.
CPI Inflation
CPI (TradingEconomics.com)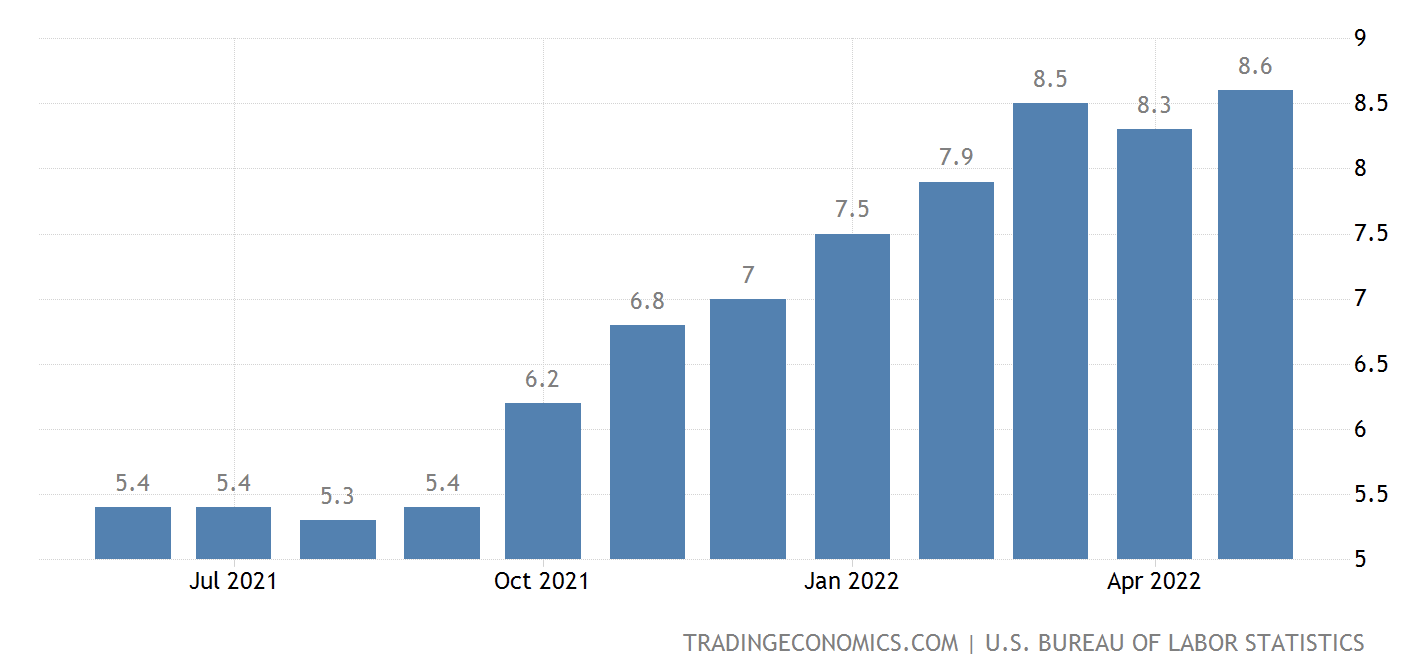
We’ve seen relatively high inflation for a while now, but inflation has rocketed since last fall. Now we are dealing with the highest inflation in around 40 years, and the Fed may not resolve the problem as swiftly as it wants. Also, we heard for a long time that inflation was transitory and would go away, but that is not true. So, I am very skeptical that the Fed will solve the inflation problem or engineer a “soft landing” as it wants. There is a higher probability that the Fed will continue raising interest rates to combat inflation, which will put the economy into a recession, probably by early next year.
The Fed – Hawkish Expectations Going Up
Fed funds rate (CMEGroup.com)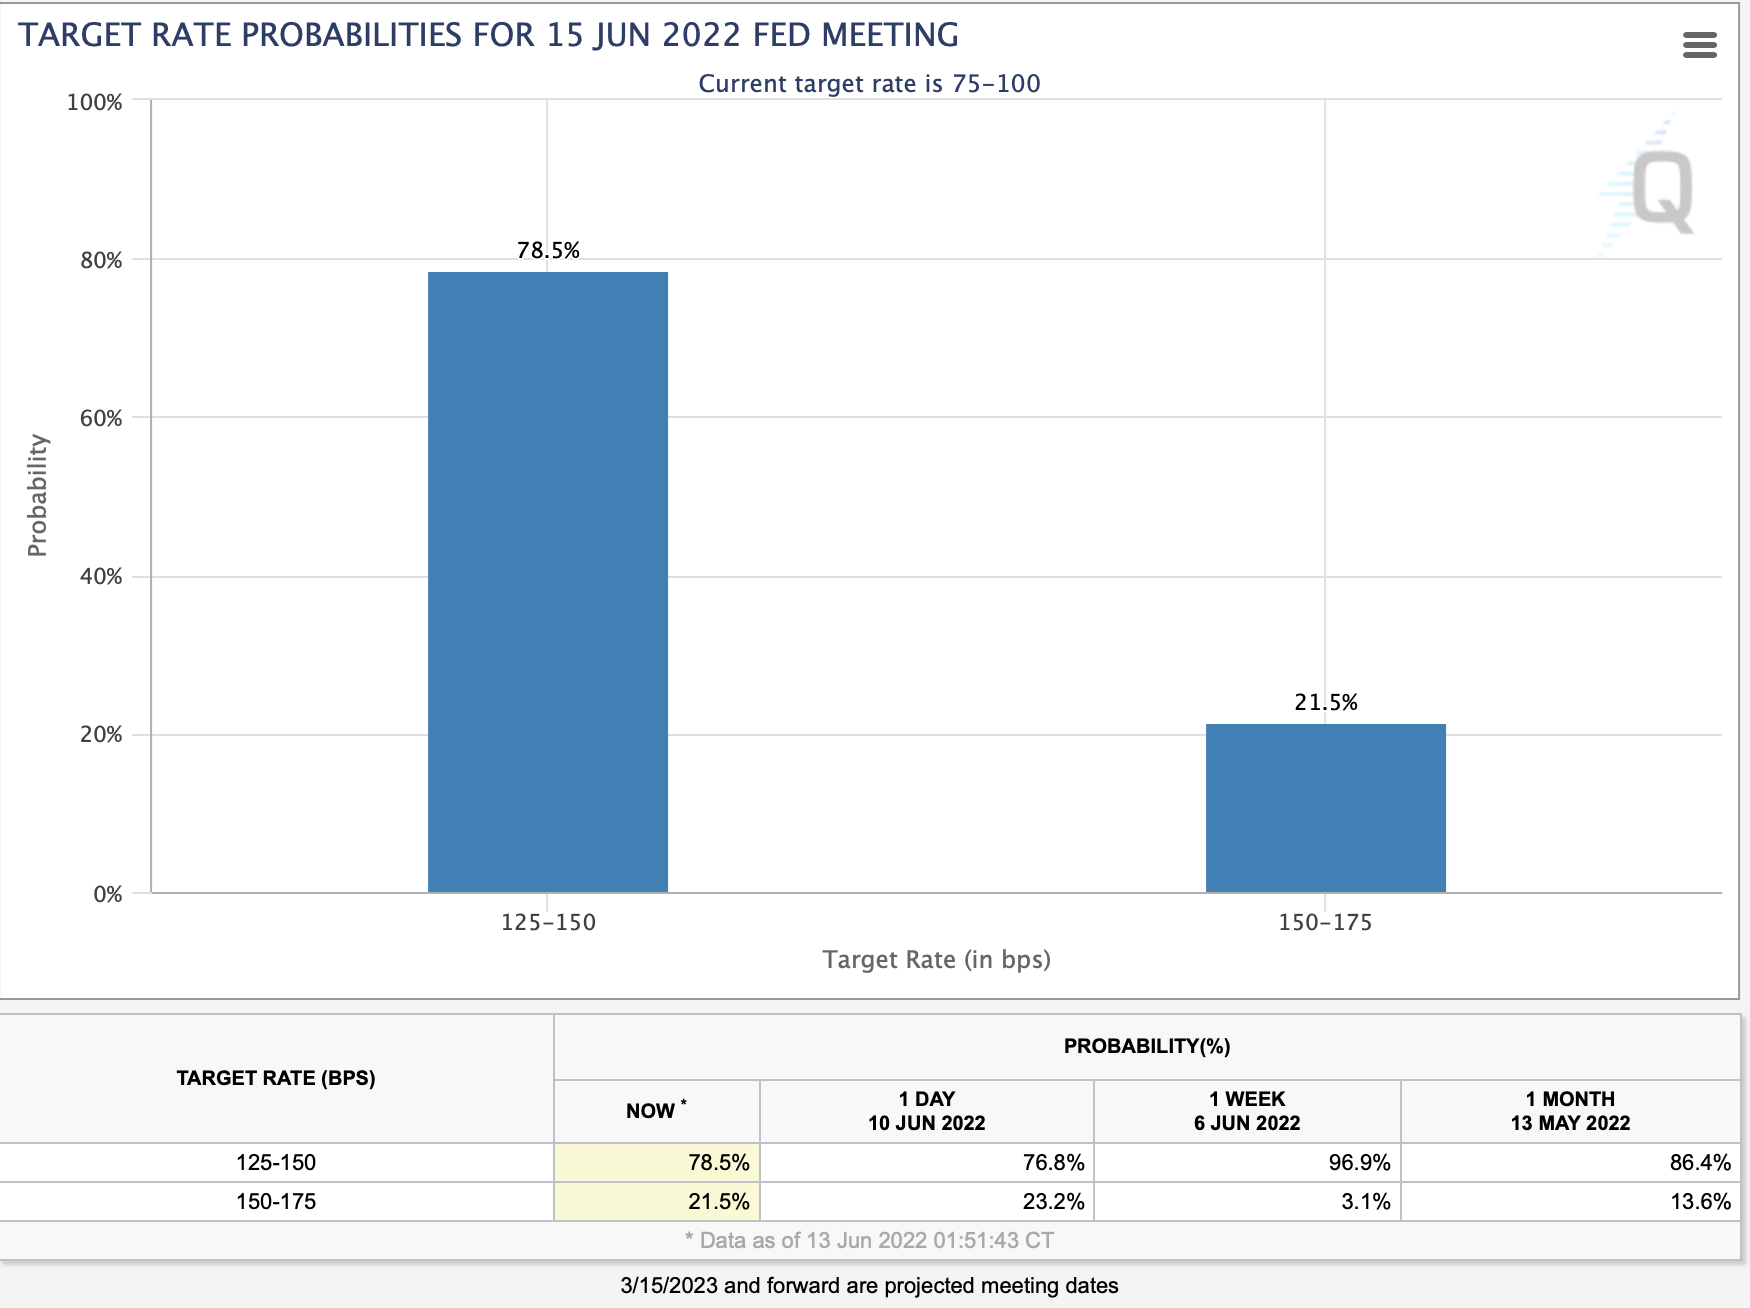
Before the recent CPI numbers, there was almost no chance for a 75 basis point hike on Wednesday. Well, now the probability is more than 20%. The market recognizes that the Fed needs to act more aggressively to cool inflation, and a more hawkish Fed is negative for stocks.
Fed funds rate (CMEGroup.com)
Looking further, we see that the market now expects the funds rate at about 3.25% to 4% by the end of this year. That’s remarkable given that the funds rate is only around 0.75-1%. Additionally, we see that expectations were for 2.5-3% one month ago. Therefore, probabilities for higher interest rates are rising rapidly, and we may see about 300 basis points in increases before 2022 ends. This rapid tightening has not been witnessed in a very long time. Due to the enormous debt burden in the financial system and the reliance on ultra-easy capital, the economy will likely slow significantly and could enter a recession due to the Fed’s tightening monetary stance.
If You Thought Consumer Inflation Was High…
PPI (bls.gov)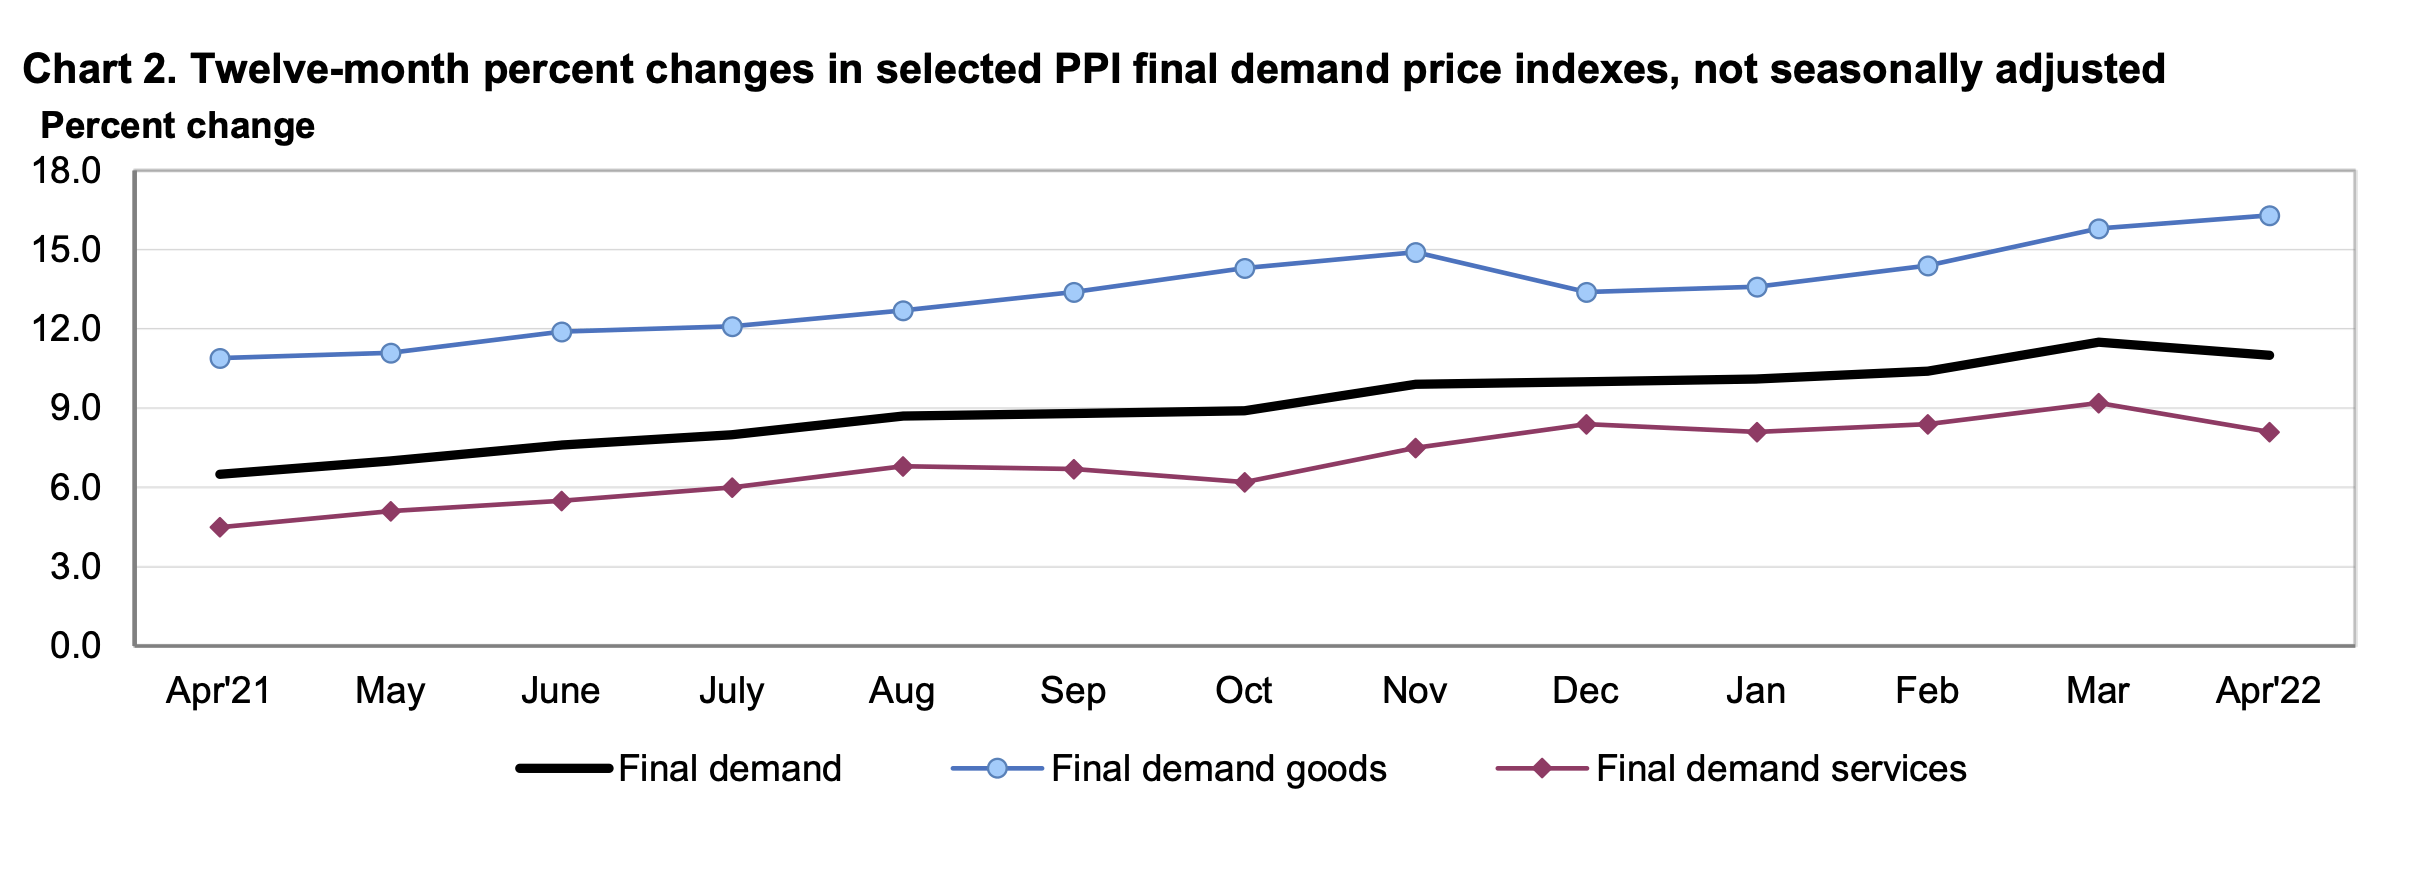
Producer inflation is surging here, with final demand-goods approaching 18% YoY. This dynamic implies that due to higher raw material costs, rising prices, and other inflationary elements, producers are paying 15-18% more now to produce products than they did one year ago. This phenomenon will likely put additional strain on corporate margins, leading to worsening profitability and lower EPS in the coming quarters. Therefore, we will probably see an earnings recession in late 2022/early 2023. Furthermore, once government spending cannot compensate for the decline in consumer spending, a general recession will likely arrive in early/mid-2023.
Unfortunately, Stocks Are Still Expensive
Shiller P/E (multpl.com)
Looking at the cyclically adjusted P/E ratio for the S&P 500, we’re around 30, still remarkably high by traditional standards. We are exiting the ultra-easy monetary environment. So, it is not easy to justify such lofty valuations for stocks. We only saw one top higher than the recent of about 38, and that was during the dot-com bubble. The historical median is about 17, roughly 40% lower than current levels. I am not saying that the stock market is destined to drop by another 40% from here, but we will very likely see lower levels before this bear market is done.
I use the cyclically adjusted P/E ratio because the current profitability rates are probably not sustainable. We went through a significant period of expansion fueled by the easiest monetary atmosphere in history. Now, the good times are essentially over, and we need to look at the possibility of a much tighter reality as we advance. Therefore, current P/E ratios and forward EPS projections are probably not sustainable for many firms.
P/E Ratios
P/E and yields (WSJ.com)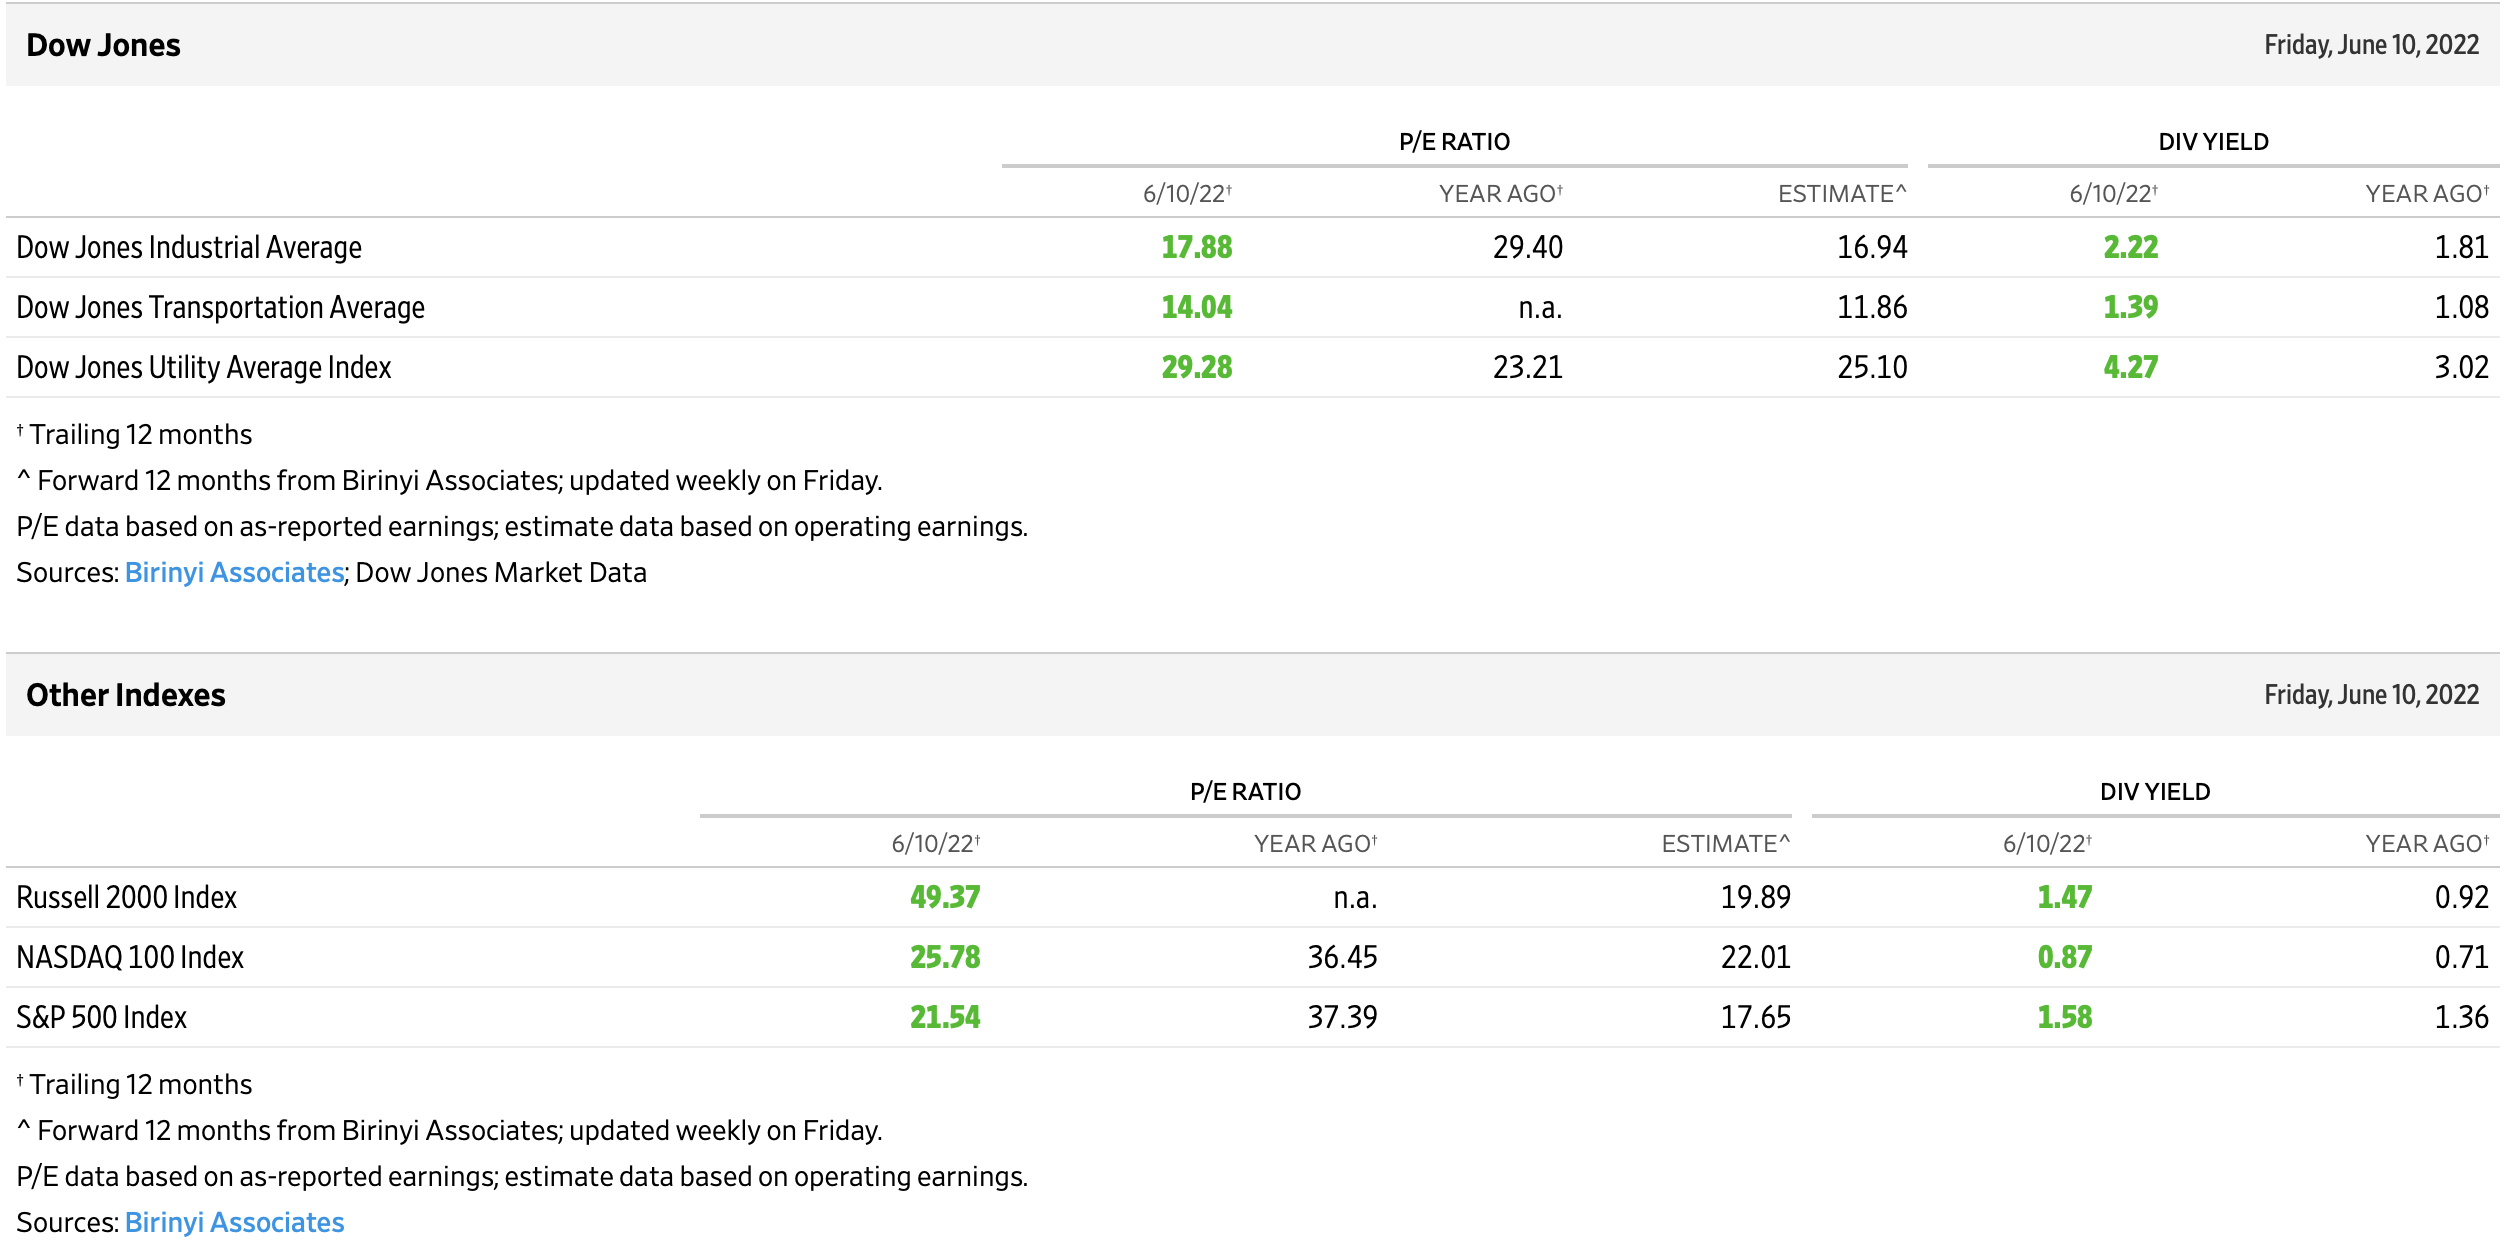
Current P/E ratios and forward projections don’t appear that bad at first glance. The current P/E for the S&P 500 is only around 21, much lower than the 37.4 P/E ratio we saw one year ago. While this valuation is still well above 16 (the historical mean), the SPX’s forward P/E ratio projection is only about 18. However, how will SPX earnings increase by about 16% YoY if we have a recession? The short answer is that they won’t. Instead, we will probably see an earnings decline next year. Therefore, the current forward P/E estimates are highly misleading, cannot be trusted, and the stock market is much more expensive than it seems.
Furthermore, under relatively normal conditions, we could expect to see growth and profitability bounce back relatively quickly after a slowdown phase. However, this time, due to all of the monetary excesses in recent years, the enormous debt loads, the high inflation, and other variables, an economic rebound may be much more difficult to kick start and sustain. Therefore, as markets are confronted with the new reality, we should see deeper selloffs as this bear market advances.
SPX 3-Year Chart
SPX (StockCharts.com)
The 3,400-3,200 area is a powerful support zone around which the SPX topped out before the coronavirus-induced declines began. Also, this support area successfully held up during the 2020 correction.
The SPX’s decline began right at the start of the year. The “correction” has been going on for nearly six months now. Moreover, the selloff threatens to transform into a bear market as we approach the 20% mark. The technical image remains quite bearish. We see a series of lower lows and lower highs, illustrating a clear downtrend. Also, we’ve been seeing worsening technical momentum, as defined by the lower highs in the RSI and other specialized gauges. Most importantly, we have not seen capitulation, panic selling, or any other hallmark signs of a technical bottom.
How Low Could The S&P 500 Go?
We may see one of several scenarios play out here. While a scenario that doesn’t push stock prices lower in the intermediate term is improbable, a short-term bullish outcome exists. However, even if the short-term bullish scenario occurs, it will likely be transitory and could be very short-lived. Nevertheless, the market could form a double bottom at the critical support level of around 3,800. Following the potential bottom, we could see a robust rally develop into and after the Fed meeting this week. While the rally could propel the SPX to around the 4,300-4,500 (higher-end range) level in the coming weeks, the selloff will probably resume.
Now, if the SPX fails to form a double bottom around the critical 3,800 support zone, the market will likely fall through and drop to new lows. The 3,800 level represents the psychologically important 20% correction/bear market transition mark. Therefore, if 3,800 gets breached, many stop-out orders should get triggered, and selling should intensify.
So far, we’ve seen two down waves in the recent selloff. The initial selloff brought the SPX down to the 4,100 zone, equating to a drop of about 15%. After a powerful countertrend rally, the second wave of the selloff took the SPX down from the 4,600 resistance level to the critical 3,800 support zone, roughly a 17% decline. We recently saw another countertrend rally to the 4,200 resistance level, and we may be in the third wave of the selloff now. Therefore, we could see a drop of approximately 20% from the 4,200 level. A drop of this magnitude would bring the SPX down to around the 3,400-3,200 support level next. In a more bearish case scenario, we may see the SPX decline back down to around the 2,000-2,400 zone.
Be the first to comment