

nevarpp
In today’s issue of the 1-Minute Market Report, I examine the market bounce since the October low, and highlight the areas of the market that are leading the way higher.
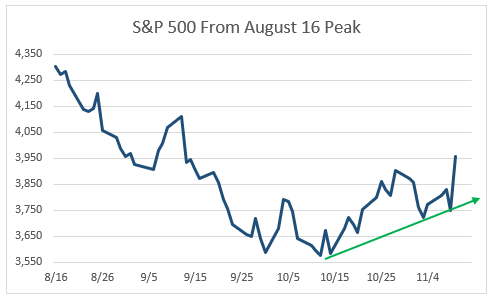
The bounce
This chart highlights the 10.6% bounce from the October 12 low point. This is the strongest rally we’ve seen since the 17% move from June 16 to August 16.
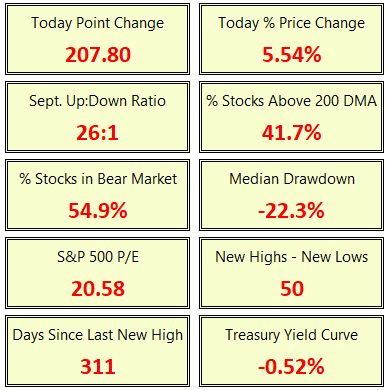
The Market Stats
Here is a look at the stats for Thursday, November 10, and year-to-date. On Thursday, for every stock that was down, there were 26 that were up. For the first time since August, there were more new highs than new lows.
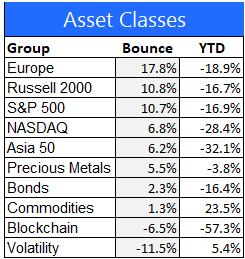
Major asset class performance
Here is a look at the performance of the major asset classes for Thursday and year-to-date. European stocks have gained the most since the October low, followed by the small-cap Russell 2000 and the large-cap S&P 500 index.
Commodities, blockchain, and volatility are struggling to get off the ground. Bonds and gold both show signs of upward momentum.
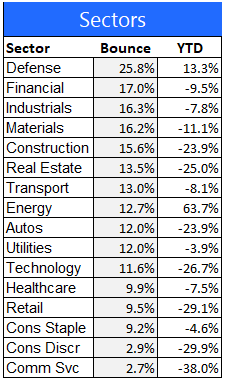
Equity sector performance
For this report, I use the expanded sectors as published by Zacks. They use 16 sectors rather than the standard 11. The defense contractors like Lockheed (LMT), Boeing (BA), and Raytheon (RTX) are leading the way higher, followed by financials, industrials, and materials.
Retailers, consumer stocks, and communication services are lagging behind.
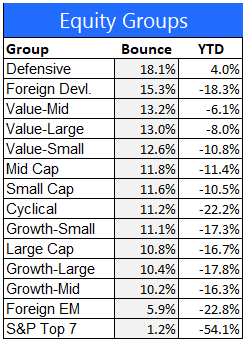
Equity group performance
For the groups, I separate the stocks in the S&P 1500 Composite Index by shared characteristics like growth, value, size, cyclical, defensive, and domestic vs. foreign.
Defensive names in healthcare, staples, and utilities are leading the way higher, along with Europe and value names.
The top 7 stocks by market cap (big tech names, like Apple (AAPL), Microsoft (MSFT), Alphabet (GOOG) (GOOGL)) enjoyed a strong up move today, but are still by far the worst-performing equity group year-to-date.
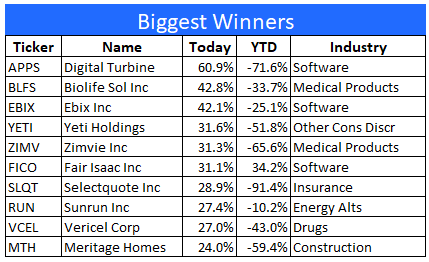
Thursday’s 10 best-performing stocks
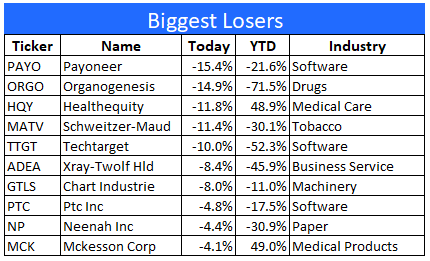
The 10 worst-performing stocks on Thursday
Final thoughts
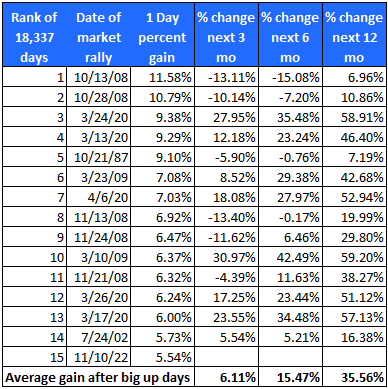
Today’s market rally was a big deal, historically and psychologically. Of the 18,300 trading days since 1950, today was the 15th biggest gainer. That puts it in the top one-tenth of 1%.
Investor confidence was boosted by the cooler-than-expected inflation report. At this point, it looks like the worst of this spike in prices is behind us. That takes some pressure off of the Fed, and allows them to slow the pace of rate hikes going forward.
When investors begin to anticipate that the next move in rates will be lower, I think it will be safe to say that the bottom of this bear market is in.
I’ll leave you with a list of the best 15 days in the market. See the last row for clues about what may lie ahead.
Are you looking for more high quality ideas? Consider joining The ZenInvestor Top 7, my Marketplace service. The Top 7 is a factor-based trading strategy. Its screening algorithm prioritizes reasonable price first, then the momentum, and finally projected earnings growth. The strategy produces 5-7 names, and rebalances every 4 weeks (13 times per year). The goal is to catch healthy companies that have gone through a rough period, and are now showing signs of making a strong comeback. Join now with a two-week free trial.
Editor’s Note: The summary bullets for this article were chosen by Seeking Alpha editors.
Be the first to comment