


da-kuk/E+ via Getty Images
iShares MSCI Thailand ETF (NYSEARCA:NYSEARCA:THD) is an exchange-traded fund invests in Thai equities. The fund carries an expense ratio of 0.57%, which is expensive but in line with other country-specific funds. Net assets under management were $310.2 million as of November 4, 2022, making it relatively popular for a fund that focuses on one, small regional equity market. The fund had 135 holdings as of November 3, 2022, with THD investing in accord with its chosen benchmark index, the MSCI Thailand IMI 25/50 Index.
I last covered THD in August 2021, when I thought the fund was overvalued. While THD has fallen since then, so has the S&P 500 U.S. equity index; -4.47% and -15.04%, respectively. Therefore, while I have been more correct in the past, since August 2021 THD has actually “out-performed” relative to the S&P 500’s larger decline. However, I did note that THD stood a chance of bouncing back in line with a post-COVID tourism bounce, and tourist arrivals have indeed risen into 2022 (although they are far off pre-COVID levels).
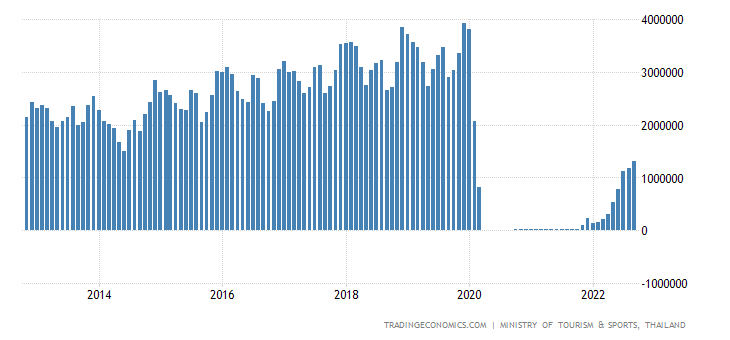
TradingEconomics.com
As the factsheet for THD’s benchmark does not provide financial data, we can instead make reference to the MSCI Thailand Index, which is MSCI’s uncapped version. The capped version, upon which THD’s portfolio is based, follows the 25/50 methodology in which no single equity position should exceed 25% of the portfolio, and the sum of the weights of equity positions over 5% should not together exceed 50%. While MSCI’s uncapped version is more concentrated, the weightings are not too dissimilar, and therefore we can use the associated financial data as a basis for valuing THD.
The MSCI Thailand Index’s most recent factsheet offers trailing and forward price/earnings ratios of 21.35x and 16.90x, respectively, with a price/book ratio of 2.00x. That implies a forward earnings yield of 5.92%, and a forward return on equity of 11.83% (which is quite low/unfavorable). Morningstar currently estimates a three- to five-year earnings growth trajectory for THD of 7.74%. Assuming THD’s return on equity drops from about 11.83% to about 10% over a six-year forecast horizon, my own earnings growth average comes to 6.47-9.57%, which is right around the Morningstar figure. Having said that, as per my basic model below, evidently most of this is front-loaded in year one, as projected by analysts (implicitly, given the wide differential between the trailing and forward price/earnings ratios).
Two other important factors are: the local risk-free rate, and the local country risk premium (which is to be considered in addition to the base equity risk premium). The local 10-year yield is 3.03% at the time of writing. The country risk premium for Thailand, estimated in January 2022 by Professor Damodaran of NYU, was 1.58%. The five-year historical beta for THD is 1.15x. So, you could compare Damodaran’s 1.58% to 15% of (that is, vis-à-vis THD’s 1.15x beta) a base equity risk premium of say 4.2-5.5% for mature markets. That would come to 0.63-0.83%. Therefore, the total equity risk premium should probably be in the region of 4.8% on the low end to about 7% on the high end. Adding in the local 10-year yield of 3.03% would take the range to about 7.8-10%, which is before any earnings growth assumptions.
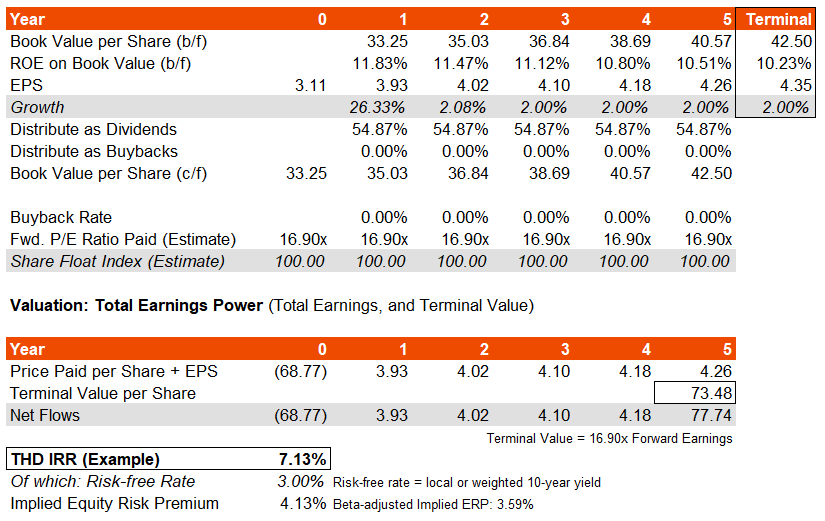
Author’s Calculations
The IRR comes to just over 7%, implying an equity risk premium of just over 4%, which is much less than our range above of 4.8-7% for Thailand. Therefore, markets are either assuming far stronger long-term earnings growth, or pricing Thai equities at a premium. If we assumed instead that returns on equity held constant over the time horizon above, our IRR would increase to 10.43%, implying a much healthier ERP of about 7.4%.
It is worth considering the earnings multiple too. For that, we have all the information except for a long-term nominal earnings growth estimate. For that, we could take a look at Thai core inflation as below (the year-over-year rate). Over time, this has fallen under 2% on average.
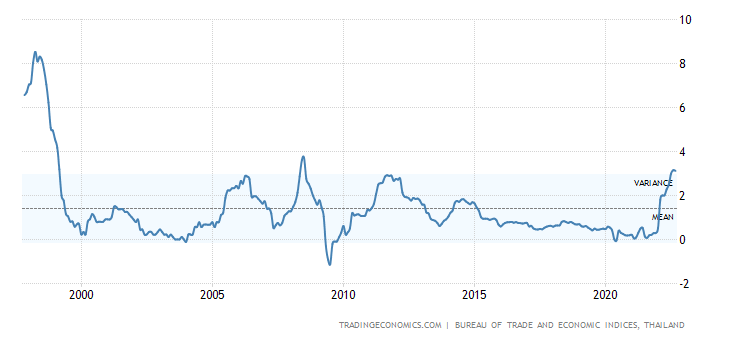
TradingEconomics.com
Assuming 2% growth to perpetuity, our growth-adjusted cost of equity would come to 7.8-10% minus 2%, or in other words, 5.8-8%. The inverse would be the implied earnings multiple, of 12.5-17.24x. That is a wide range, but in any case mostly below the current prevailing multiple of 16.90x. The midpoint of the range is 14.87x. Assuming that this is our terminal multiple, to be more conservative, my model would generate an expected IRR in the base case and steady-ROE case of 4.86% (ERP: 1.86%) and 8.08% (ERP: 5.08%), respectively.
On balance, I think Thai equities are not attractive on a constant-FX basis. That is because the headline IRR should be safely underneath 10% in the long run, and the risk is that THD gets repriced to the downside significantly, especially given the generally lacklustre tourism bounce-back and heavily front-loaded earnings growth which may result in later disappointment once the “long-Thailand” narrative (at least, in recent times, relative to broader equity indices) fades. Fading excitement could basically depress the earnings multiple in the long run, such that even if THD meets forecast earnings, it could still fall given the presently rich earnings multiple.
Another factor is the Thai baht. Firstly, on a Purchasing Power Parity basis, the Thai baht was possibly 12% undervalued in July 2022, making the USD/THB fair value closer to 33.50. The current exchange rate is 37.30, and hence the Thai baht could in theory appreciate 12%. However, conversely, the country’s tourism industry is apparently much less buoyant than before, and its current account has weakened as a result. The most recent rate for Thailand’s current account vs. domestic GDP was negative -2.2% in 2021, which was in line with similar deficits in 1997, 2005, 2012, and 2013.
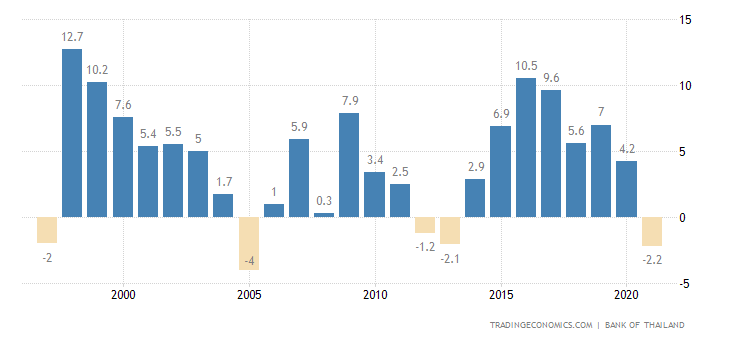
TradingEconomics.com
In those years (excluding pre-2000), USD/THB was trading at levels that were, in relation to the current rate: +7.6% (in 2005), -16.9% (in 2012), and -18.36% (in 2013). So, relative to more recent years of current account deficits, the Thai baht is potentially now undervalued. Another way of looking at it: the current account deficit is about as bad as it has been since 2013, and therefore you would imagine USD/THB would be at roughly the highest level since then, and that is indeed the case (see chart below).
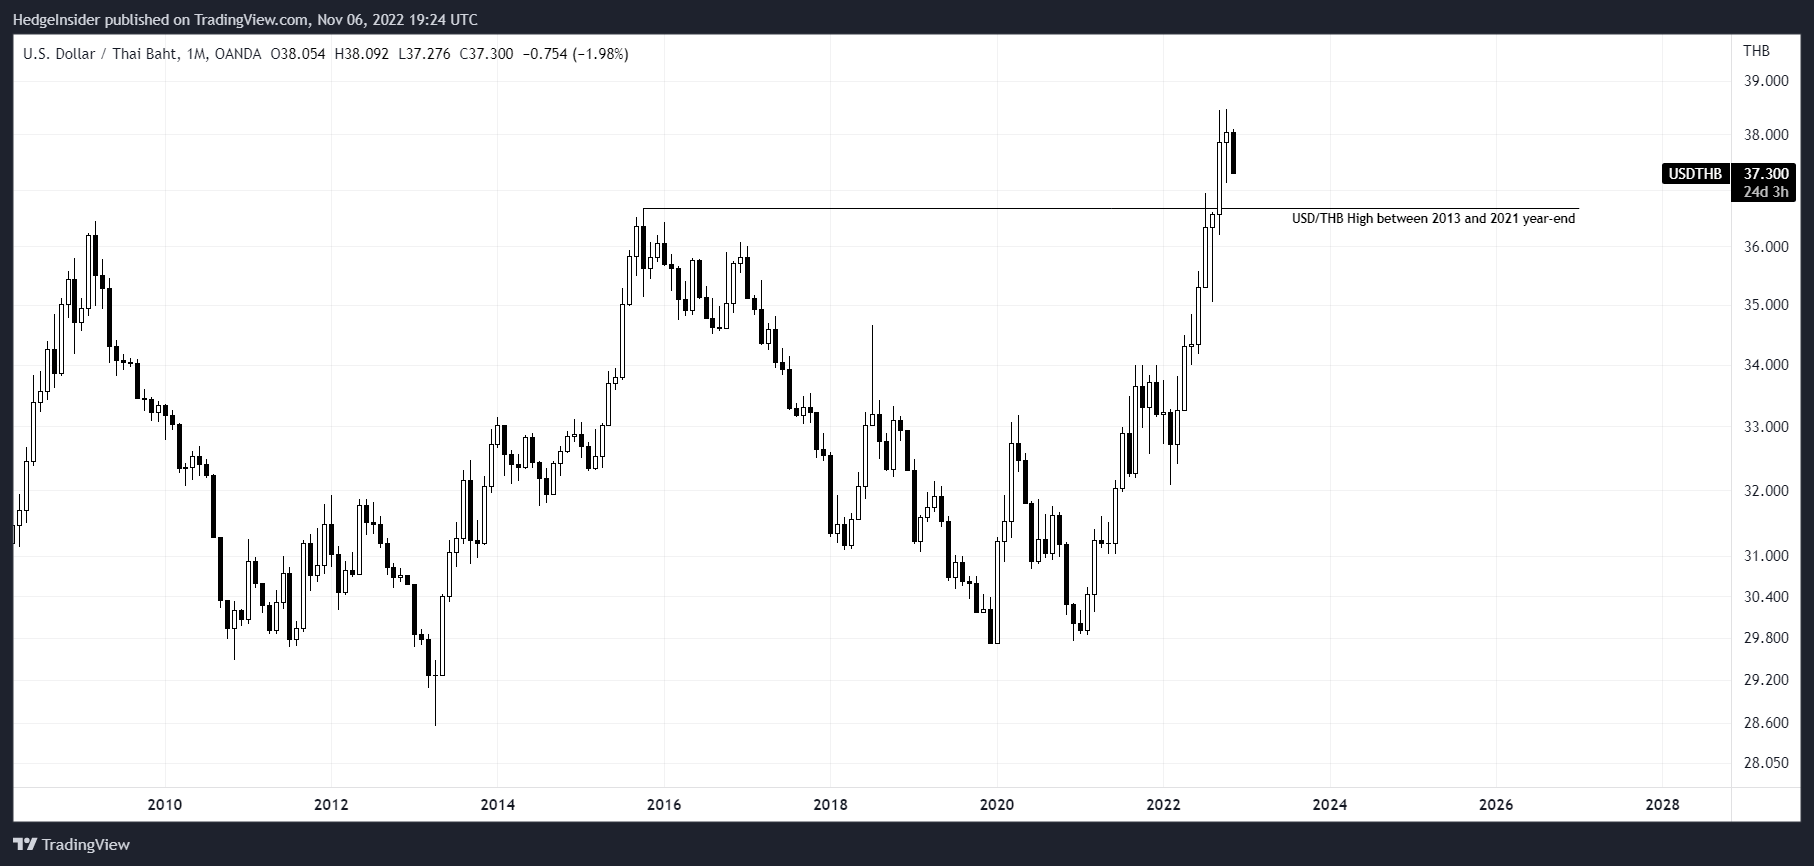
TradingView.com
Given The Economist’s PPP model indicating potential Thai baht under-valuation, it is more than possible that the baht has rightly sold off but is now indeed undervalued. This could reverse the current negative trend, which would be supportive for THD as its underlying holdings are denominated in Thai baht. Yet another factor is yield differentials; the current U.S. 10-year yield of over 4% exceeds the Thai equivalent of circa 3%. So, yields are not likely to support any carry trade. Nevertheless, yield differentials are not large enough to constitute an invalidation of any potential baht-reversal thesis, especially given that local Thai inflation is actually quite modest on a core basis.
Therefore, I see low FX risk for THD holders. Having said that, I would remain neutral, because while a modest FX reversal might actually support THD, it seems as though the underlying portfolio is not priced for high returns if one were to factor in all pertinent considerations including the country risk premium.
Be the first to comment