

PonyWang
Introduction
Earlier in the month, I had crafted an article on Microsoft’s stock (MSFT), exploring its dividend credentials. As part of that exercise, I compared MSFT to the top-10 tech stocks of the S&P500. Whilst MSFT’s overall dividend score came across as average, one stock, in particular, stood out, garnering a dividend score significantly higher than the rest of the pack; the stock in question is Texas Instruments Incorporated (NASDAQ:TXN), known for its expertise primarily in the analog space.
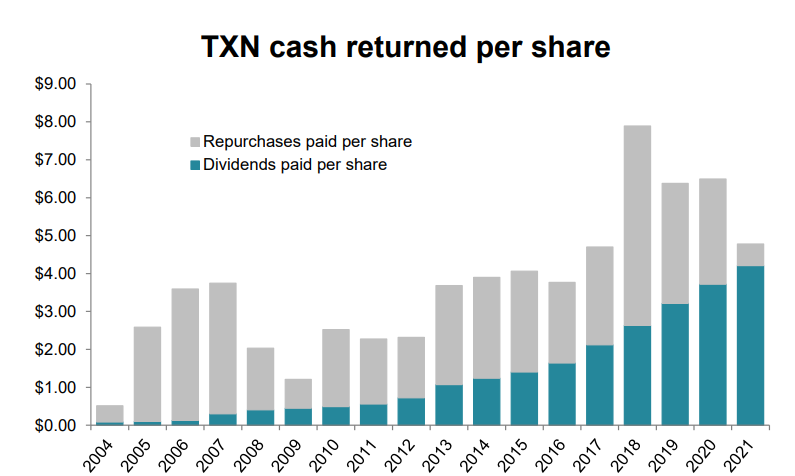
TXN’s distribution allure isn’t limited to its dividends alone; it also has a long track record of buying back shares, and its aggregate buyback spend since 2004 has wiped out close to 50% of the total shares outstanding. In effect total distributions (dividends plus buybacks) per share have grown at a healthy CAGR of 14% over the last 17 years.
Capital Management Presentation
It now appears that the broad semiconductor industry has commenced a down cycle; in fact, Gartner expects semiconductor-related revenue for FY23 to decline to $623bn annually from $639bn in FY22 (implying annual de-growth of 2.5%). In light of these unfavorable industry-wide conditions, TXN is unlikely to swim against the tide; indeed, consensus estimates for FY23 point to a 2% annual decline on the topline (Revenue of $19.79bn). It isn’t just a weak topline, cost pressures and potential operating leverage challenges will likely result in a greater percentage decline of 5.4% decline on the bottom line (EPS of $8.941). In light of these conditions, could TXN’s distributions be at risk?
How Effectively Can TXN Cover Its Distributions in FY23?
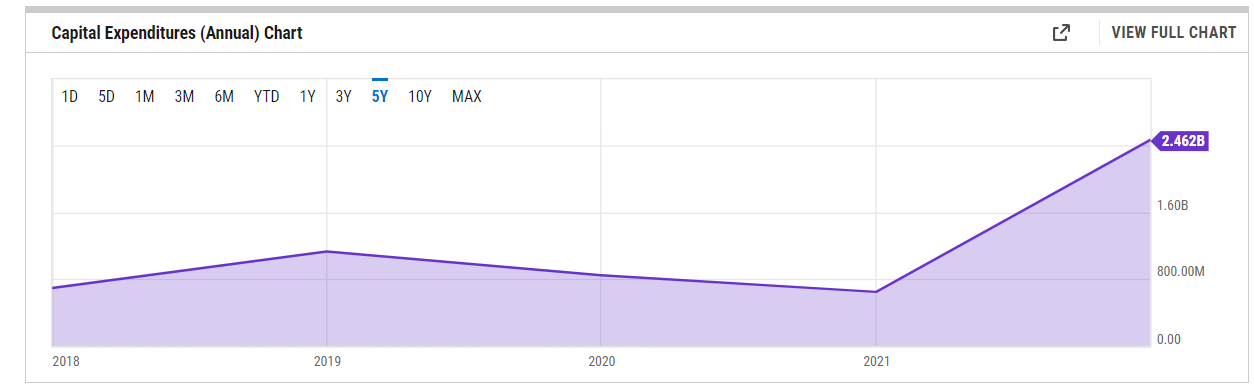
In recent periods, TXN’s CAPEX outlay has scaled up quite significantly; just for some context, over the last five years it has averaged $1.15b n per year, but last year alone, the outlay came in at $2.46bn.
YCharts
Even though we’re looking at weak dynamics in the semi-industry, TXN’s CAPEX outlay is unlikely to plateau or decline, and will in fact take up a larger component of the operating cash flows that the company generates; this could prove to be very rewarding as a significant chunk of the CAPEX plans for 2022-2025 will likely be directed towards ramping up 300-millimeter wafers.
Capital Management Presentation
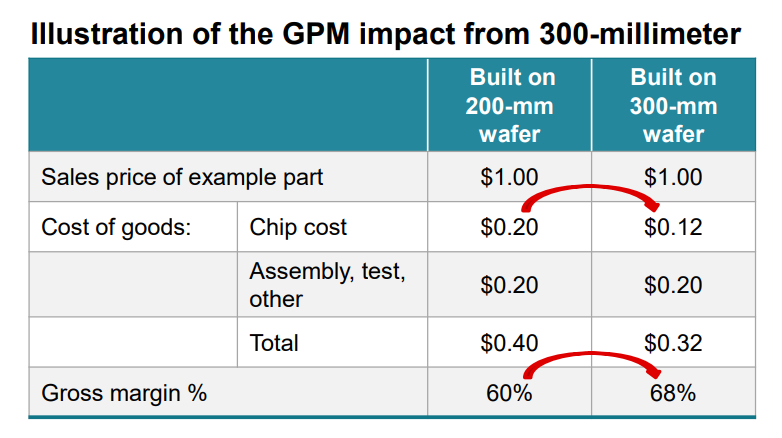
Most competitors of TXN focus on 200-millimeter wafers where an unpackaged chip costs 40% more ($0.2 vs $0.12); This eventually translates to a Gross margin differential of 800bps. Notice how TXN’s GMs have been showing a marked improvement in recent years.
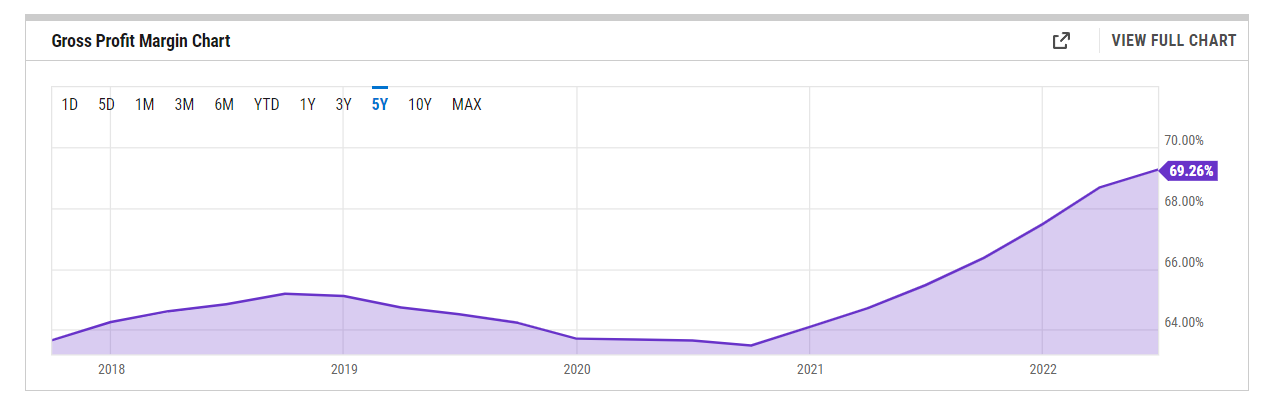
YCharts
Ceteris paribus, a greater CAPEX thrust towards 300millimeter wafers should continue to abet the GM improvement. All in all, TXN management expects CAPEX spend between 2022-2025 to come in at a much higher threshold of $3.5bn per year.
Now, over the last five years, TXN’s operating cash flows have typically covered its CAPEX outlay by around 7x. However, in recent periods, this has come down significantly and most recently stood at a little over 3x.
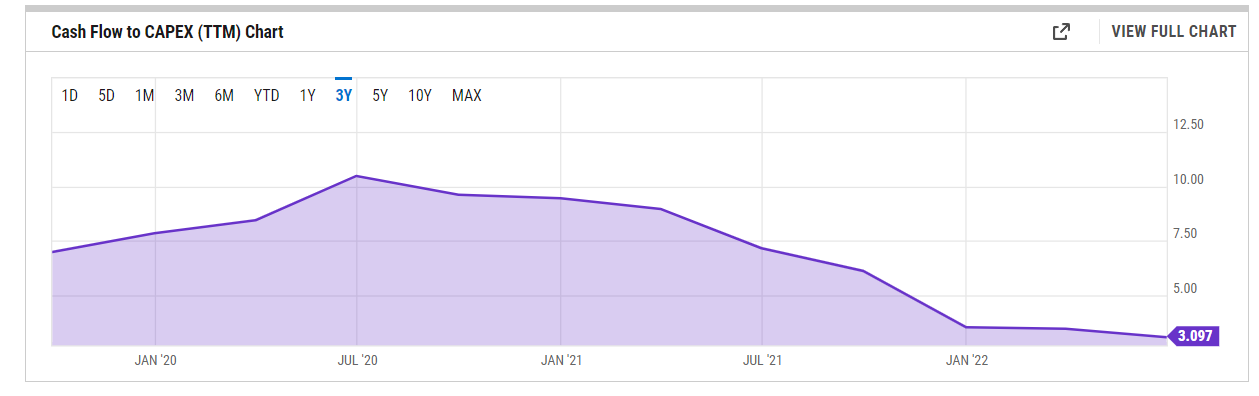
YCharts
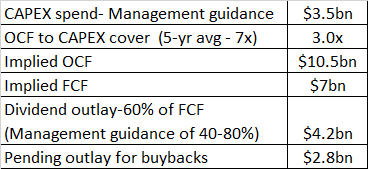
Rather than using the 5-year average of 7x, if one were to be conservative and assume a cash flow (Operating) to CAPEX figure in line with recent periods (3x), we’re looking at an implied free cash flow (FCF) figure of roughly $7bn (operating cash flow of $10.5bn) for FY23.
TXN’s policy on its dividends has been to distribute anything between 40-80% of its FCF. This would imply a dividend outflow range of $2.8bn to $5.6bn per annum. I believe a 40% distribution figure ($2.8bn) would be too conservative as it would be well below how much they paid out as dividends in FY21 ($3.9bn) and TXN wouldn’t want to renege on its long history of growing its dividends (16 years). Whereas, if we were to take the mid-point, which is 60% distributions, you’re looking at an annual dividend outlay of $4.2bn which looks more realistic. This would still leave TXN with around $2.8bn to fulfill its buyback ambitions as well. At the end of FY21, the company had a $10bn (no expiration) buyback program, and as of H1-22, they’d only deployed around $1.77bn of that warchest.
YCharts, TXN filings and transcripts, Author’s calculations
To sum up, despite a potential slowdown in revenue and earnings and a spike in CAPEX, I don’t believe TXN’s distribution angle is likely to dim, and it should have enough in its tank to grow both the dividend and the buyback spend per annum in FY23.
Closing Thoughts- Valuations and Technical Analysis
As far as TXN’s technical and valuation narratives are concerned, there isn’t an awful lot to get excited about; if anything, developments on the weekly chart suggest some caution ahead.
Considering an FY23 EPS figure of $8.941 (implying an annual de-growth of 5.4%), you’re looking at a forward P/E multiple of roughly 19x, which would put it more or less in line with the mid-point of the stock’s 5-year P/E range of 16.6x-21.4x; not expensive, but certainly not cheap either.
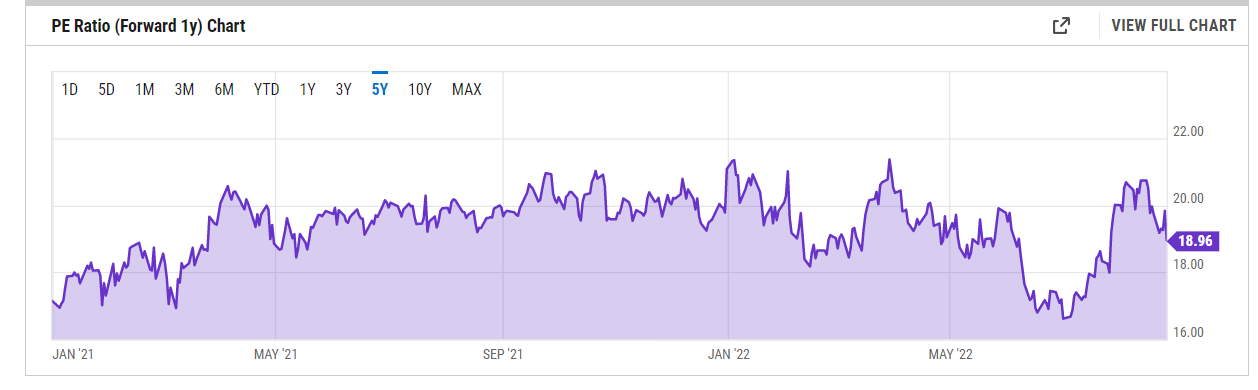
YCharts
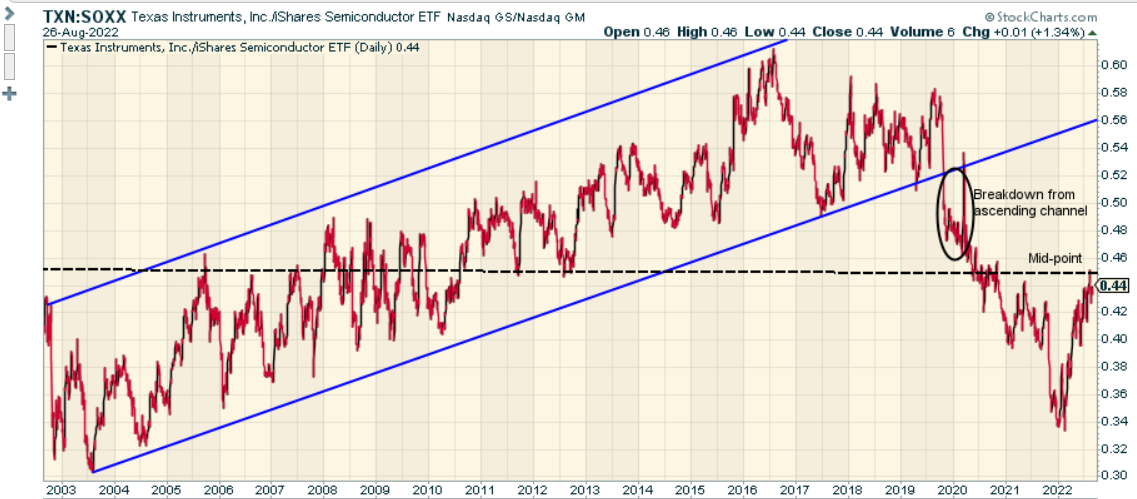
Then, if you’re looking for attractive mean-reversion opportunities within the prominent semiconductor stocks, I don’t believe TXN would come across as a compelling bet. I’m basing this premise on the relative strength ratio of TXN’s stock and a portfolio of the 30 largest US-listed semi-conductor stocks, as represented by the iShares Semiconductor ETF (SOXX).
We can see that until 2020, Texas Instruments had been gaining prominence amongst its major semi-peers in the shape of an ascending channel; however, there was a breakdown from this channel in 2020 with the ratio following a descending trajectory until the start of this year; in recent months we’ve seen a strong up move (implying some rotation into TXN) but that ratio is now trading around the mid-point and neither looks overbought or oversold.
Stockcharts
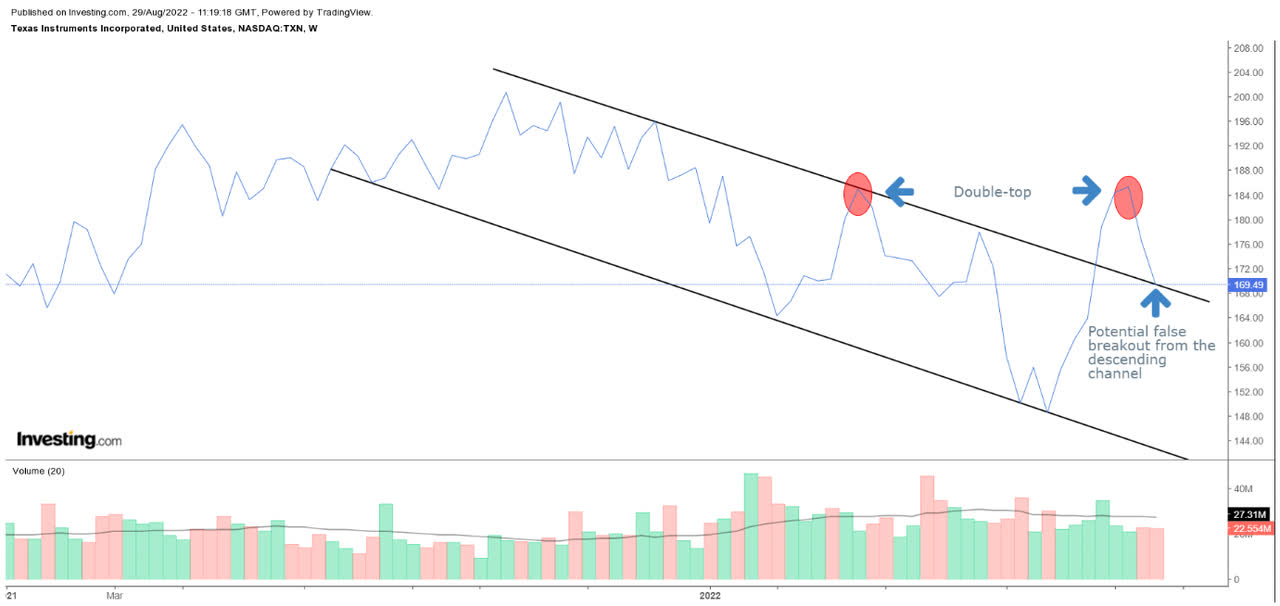
Finally, we come to the Texas Instrument Stock’s standalone weekly chart. After flattening out in the last quarter of 2021, the price action had taken the form of a descending channel, until mid-July when we saw a breakout of this channel. However, unfortunately, we witnessed a bearish double-top formation in early August, and since then we’ve seen another bout of correction with the price set to fall back into its old descending channel (implying a false breakout).
Investing
To conclude, whilst the distribution angle is unlikely to turn sour, TXN’s valuations, its fairly flat rotational quotient (within the semiconductor space), and its recent technical imprints prompt me to be a little cautious about the stock.
Be the first to comment