

Scott Olson
Thesis
Tesla, Inc. (NASDAQ:TSLA) released its 2022 Q3 earnings report (“ER”) on Oct 19, 2022. And, by this time, many Seeking Alpha authors have dissected its Q3 results, and I believe TSLA investors have fully digested it already. So, I won’t further add onto the discussion. Here, I just wanted to point out an observation from the option market as you can see from the chart below. Its implied volatility (“IV”) peaked around 75% right before the Q3 ER – rightfully so. After all, Elon Musk has taught the market to expect some surprises during the ER (more on this in the next section).
However, the IV then quickly dropped afterward and, currently, its IV is only in on the level of ~55%. And, as you can see (from the dotted redline), it is near the lowest level in a year. It is actually even lower than its historical volatility in the past 30 days (about 63% shown by the blue line) by a good bit.
The way I see it, the market has quickly forgotten about the Musk lesson and most likely will relearn it in Q4. And the thesis of this article is to show how investors could exploit the market’s underestimation of its IV.
Source: IVolatility.com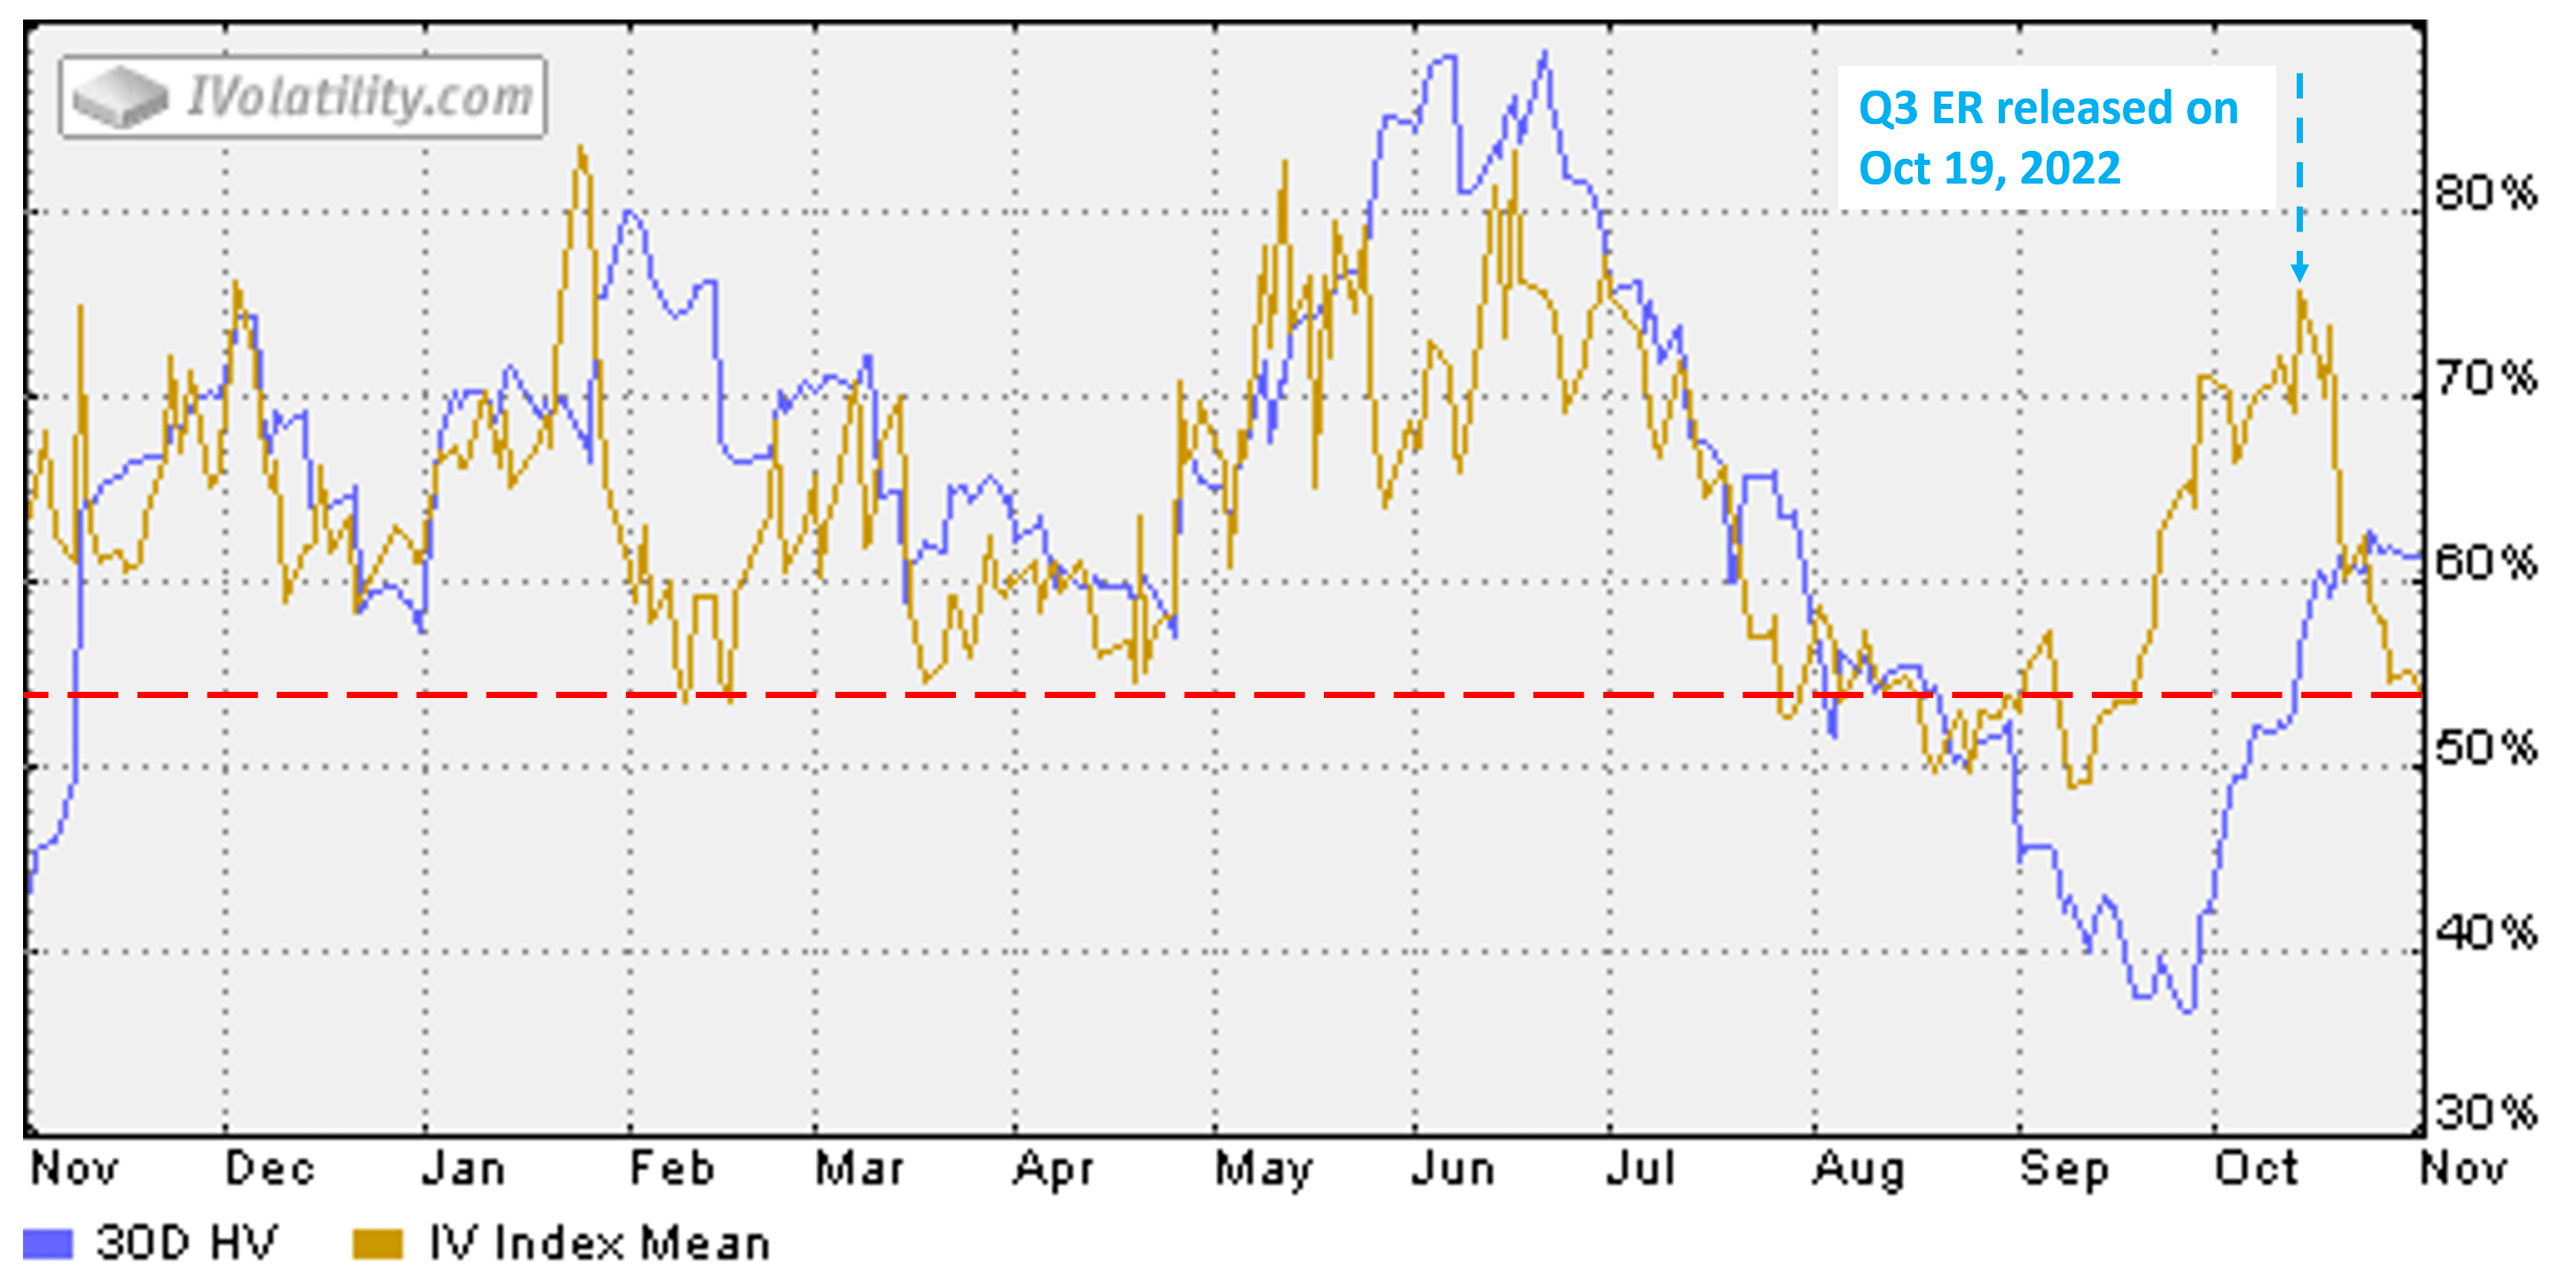
Q4 option play
Given the above analysis, investors could consider an option play, with an expiry date shortly after the Q4 ER to benefit from the mismatch between the volatility created by the ER and the current low IV. TSLA’s 2022 Q4 report date is estimated to be on Jan 24, 2023. The Consensus EPS Forecast is $1.3. Compared to last year’s EPS of $0.85 during the same quarter, the consensus estimates project an EPS growth rate of 52.9% YOY.
And as you can see from the following chart, its Feb 17, 2023 put option with a $225 strike price is now trading around $25.7 (which translates into 11.4% of $225). So, if you write such a put and the stock price rises above $225 on Feb 17, then the put option expires worthless and you would be able to make 11.4% in 108 days, translating into about 38.6% return when annualized. It is not a bad return for a short-term trade, and it has a good possibility of materialization given the above EPS consensus.
On the other hand, if the stock price dips below $225 on Feb 17, 223, and the put is exercised, then you would effectively buy TSLA shares at ~$200 ($199.3 to be more exact, which comes from $225 strike price minus $25.7 premium). And next, you will see that a ~$200 price is an entry point for long-term holding too.
Source: IVolatility.com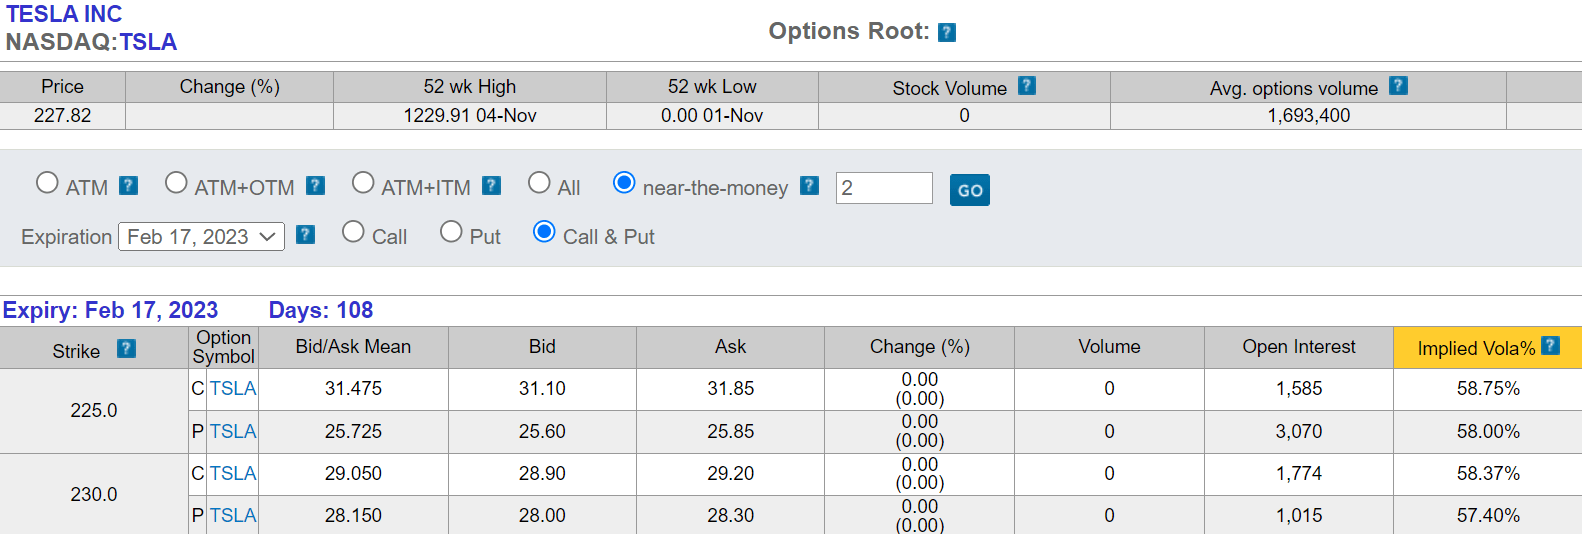
But in either case, an option play offers the opportunity to exploit the mispricing in volatility and also share prices. While in contrast, directly owning the shares only lets you exploit the mispricing in share prices. And again, in TSLA’s case here, my argument is that the market currently underestimates its volatility severely.
Eyeballing the chart below probably would provide a good sense already. The chart below shows that TSLA stock prices routinely fluctuate above 20% on a weekly or even daily basis, especially during the weeks around the ER. Take the most recent ER as an example. The stock prices plunged from more than $300 to about $200 shortly before the ER due to the negative outlook. Then following the week of its 2022 Q3 ER on Oct 19, the stock prices rose from a bottom of $198 to a peak of $233, a 17.7% fluctuation.
Yet the market is now assuming a 55% IV, near its 52-week low. To contextualize such mispricing in a different way, TSLA’s fluctuations are easily 10x more than the average daily fluctuations of QQQ (which only exceeds 2% rarely), yet TSLA’s current IV is only about 1.7x higher than QQQ’s current IV (about ~31% for near-the-money put options with the same expiration date).
Source: Author based on Yahoo! data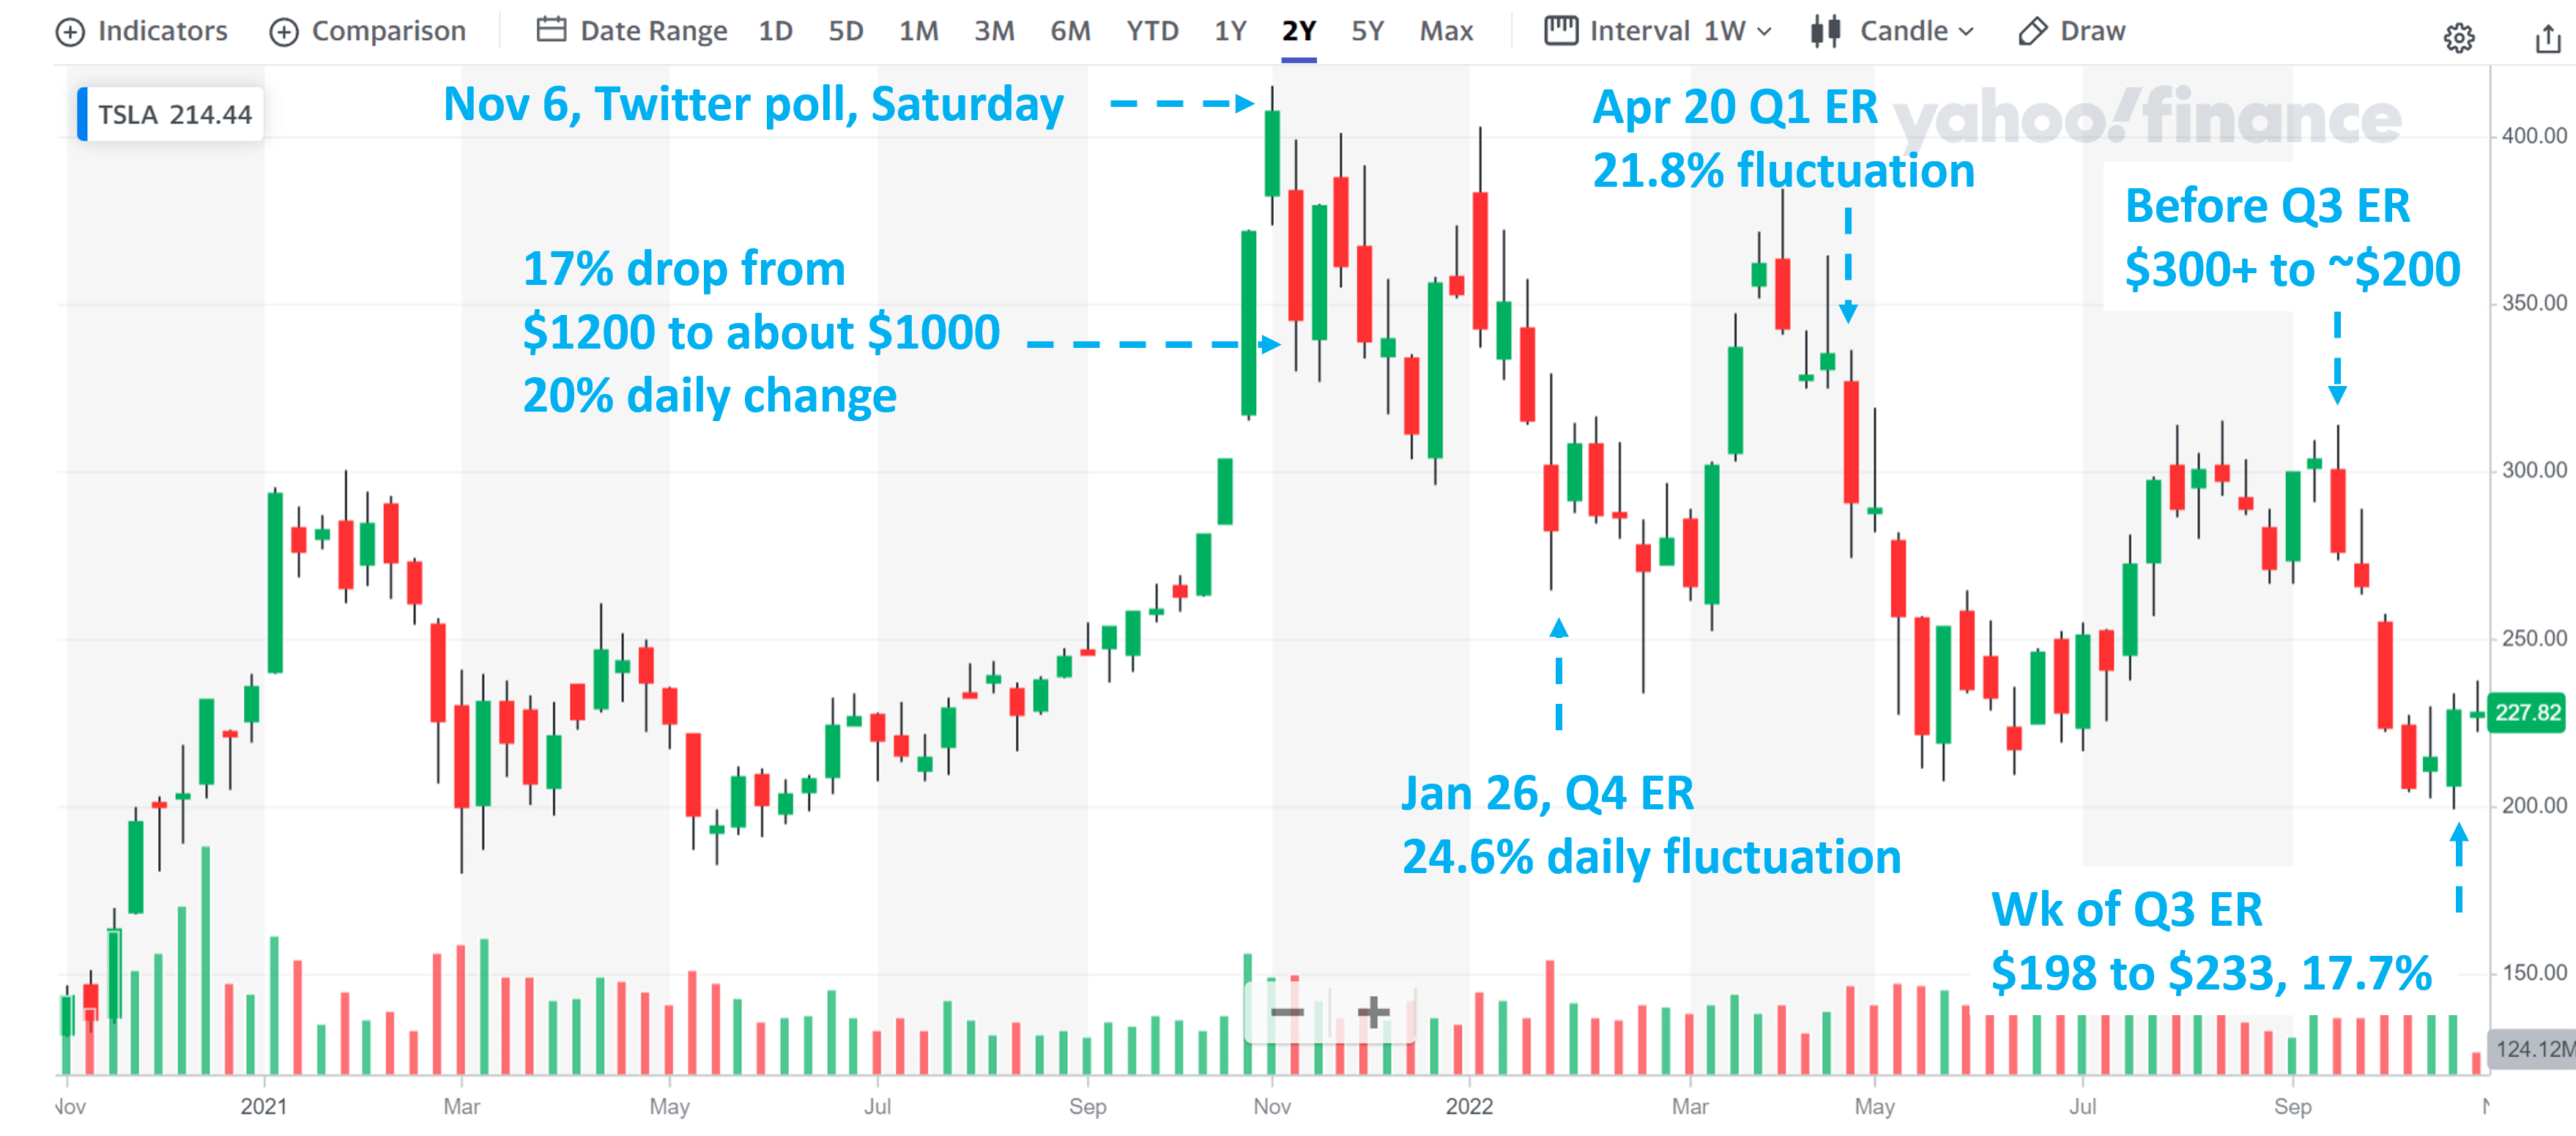
Implications for long-term holding
Finally, let’s explore the Implications for long-term holding in the case the option is exercised. As aforementioned, in this case, the option writer would effectively buy TSLA shares at a share price of ~$200. And the next table shows my projections for its valuation multiples in a few years at a $200 entry price. The key assumptions made in this projection are:
- variable cost equals $42,000 per vehicle
- operating expenses equal 13% of total sales
- an average vehicle sale price of $66,000
- its annual vehicle production and delivery growth rates maintain at 40% CAGR till 2026
Based on these projections, at an entry price of $200, the P/S multiple would be about 7.5x in FY1 and shrink to only 2.7x in 2026 (to provide a reference point, the S&P 500 is trading at a 2.3x P/S ratio now). And its FY1 EV/EBITDA would be about 31x and again shrink to only 11.6x in 2026. To put things under perspective, leading institutions such as Bank of America (BAC) to believe a company with TSLA’s growth potential is worth ~13x EV/Sales and ~55x EV/EBITDA multiples.
Source: Author based on Yahoo! data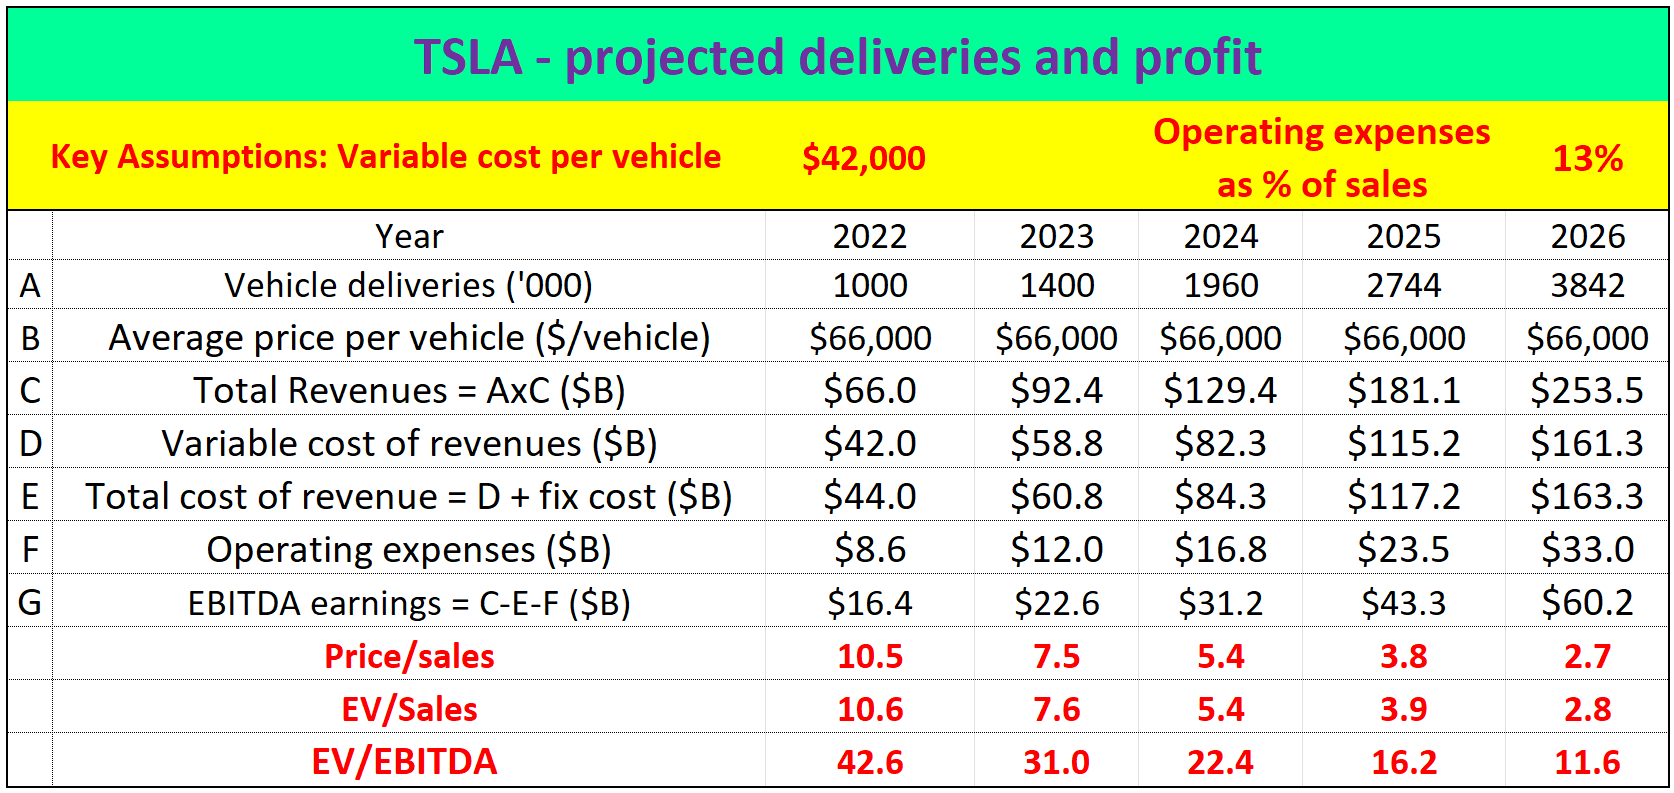
Risks and final thoughts
And finally, risks. TSLA faces several risks in the near term, as pointed out in its Q3 ER. These range from global supply chain disruptions, raw material costs, the COVID situation (especially in China), et al. As mentioned upfront, other SA articles have already discussed them, and I won’t further add on. Here, I will just emphasize the risks associated with writing put options here. At least, in theory, there is a risk that the TSLA stock price drops to zero at (or before) the expiry date. In this case, you would still have to buy at $225 per share, resulting in a ~$200 loss per share.
Also, all the return potential estimates (both short-term and long-term) are based on the assumption that you write COVERED options. If you write uncovered (aka naked) options, then your risk/return profile would change depending on the specific terms of trades (like the margin rates et al).
To conclude, it seems to me that the market only remembered the Musk lesson during the ER. Then it quickly forgot it and most likely will relearn it in Q4 2022. To wit, TSLA’s options are currently trading with IV only around ~55%, not only near the lowest level in a year but even lower than its historical volatility in the past 30 days. Yet, I see no reason why the ACTUAL volatility of the stock would subside. If there is a change in its actual volatility, it should be in the up direction the way I see things given the macroeconomic and geopolitical uncertainties unfolding.
Such mispricing of its volatility has provided an opportunity that could be attractive both for swing traders and also long-term holders. In the case of expiration, a put option expiring right after Q4 ER would provide an 11.4% return in ~100 days (~39% annualized). And in the case of exercising, it would provide the shares at ~$200, an attractive entry price with valuation multiples at only a fraction of consensus expectations.
Be the first to comment