

Theo Wargo
The investment thesis
The Tesla (NASDAQ:TSLA) thesis, to a large degree, is an Elon Musk thesis. The man and the company are inseparable. TSLA bears and bulls disagree more fiercely on Elon Musk than anything else. In the comment section of my own TSLA articles alone, the bears’ portrait of him ranged from only a PR expert all the way to a conman. On the other hand, bulls praised him as an all-around exceptional entrepreneur (a serious one too), or even a visionary.
It is difficult for individual investors to evaluate key management team members due to the lack of resources and access. However, in my experience, this is a blessing in disguise. If you read the book (entitled The Education of a Value Investor) by Guy Spier, who has certainly met more CEOs than most individual investors like myself, the book actually devoted a chapter explaining why he intentionally avoids meeting CEOs in his investment decisions. CEOs, at least the few that I happened to have interacted with, all have highly charismatic and confident personalities. Meeting with them can often lead to a more misleading, rather than informative, picture of their business.
Therefore, in my view, it is much better to rely on financial metrics to form an objective assessment. Of course, this approach has its limitations. Personnel evaluation is such a multifaceted task, and the financial numbers can only help with certain aspects. For example, financial data wouldn’t be able to say too much about a person’s innovation ability or vision. But it can provide pretty accurate measurements of a person’s ability in terms of capital allocation and execution, which is the focus of this article.
TSLA investors all know that Musk’s compensation entirely comes from stock awards. And these awards are conditional upon him leading the company to meet a series of measurable metrics in 12 tranches (including revenue, EBITDA, market capitalization metrics, et al). So far, Musk has met 11 of the 12 tranches. As such, I found it hard to argue against his execution ability despite the many project delays bears often cite against him. For complicated projects, overtime and over-budget are really the norms, not the exception in my experience.
Although I find the 12 trenches (revenue, EBITDA, market cap, et al) are more oriented towards growth. In the remainder of this article, I’d like to examine Musk’s execution ability measured more by profitability metrics such as return on invested capital. And the main takeaways are twofold:
- First, the data suggest that he is doing a good job by profitability metrics too.
- And second, TSLA investors should suggest the board add such profitability measures in addition to growth metrics to his future equity awards.
Musk’s execution ability measured by profitability metrics
As just mentioned, Musk has met 11 of the 12 tranches thanks to the spectacular growth of TSLA over the past, largely attributed to his execution prowess in my view. Moreover, in recent years, his execution capability has also been reflected in boosts of profitability too as you can see from the following chart. TSLA turned free cash positive in 2019 and currently it’s generating about $6.9B of free cash after all its CAPEX commitments. In the meantime, key profitability metrics such as ROE (return on equity) and ROIC (return on invested capital) have also climbed. To wit, ROE climbed from about 0% in 2019 to the current level of 31.2% and ROIC to about 25.6%. To put things into perspective, the ROE of the overall economy is about 19% currently. So TSLA’s ROE is about 64% higher than the overall economy in relative terms.
CEOs have a couple of knobs to turn to boost profitability. Some of the knobs are good and some are less so. Next, we will see that Musk has been turning the good knobs.
Source: author and Seeking Alpha data.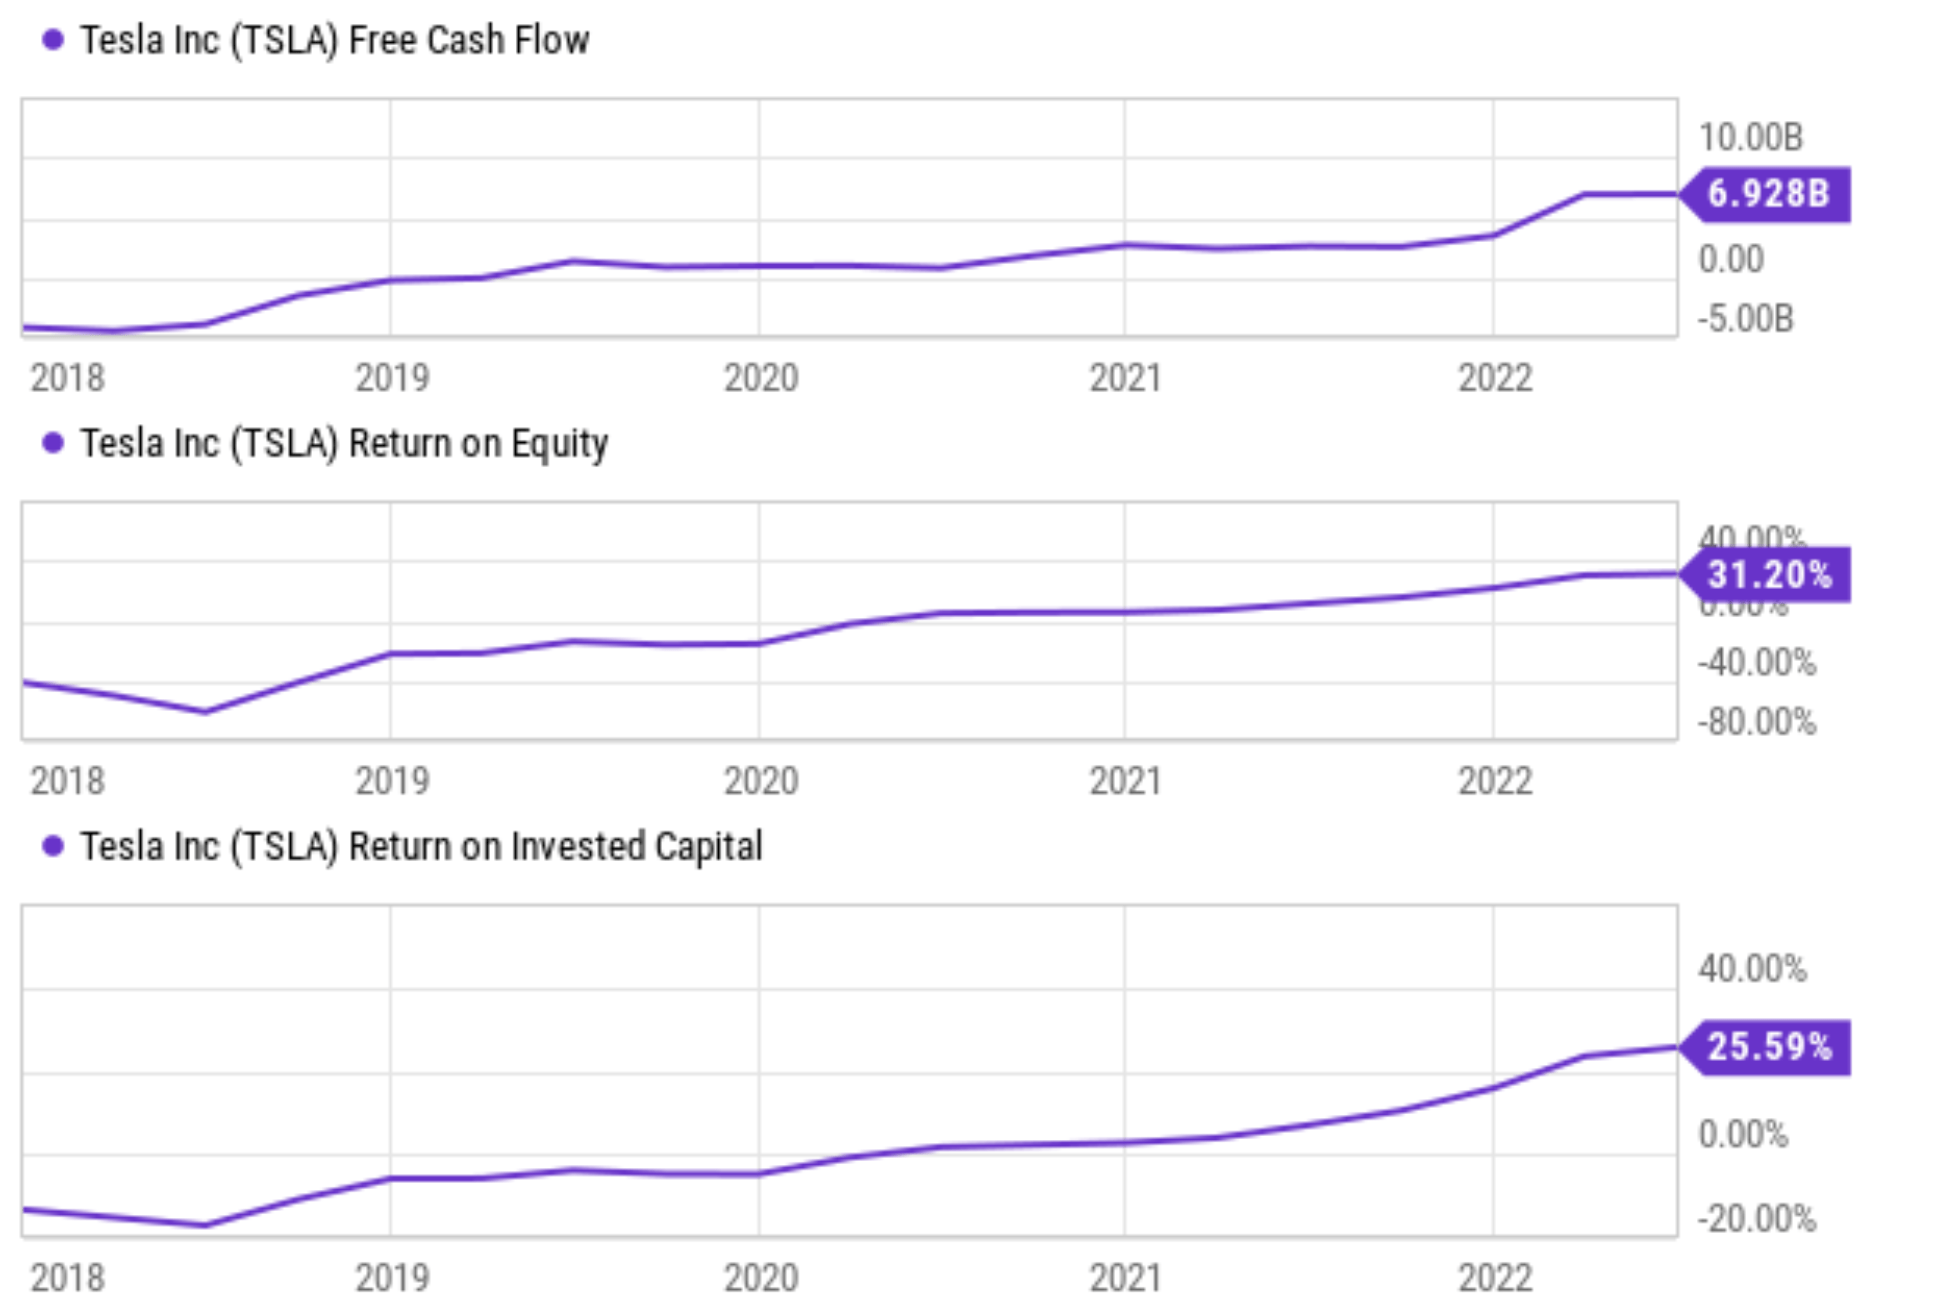
The knobs that Musk has been turning
Under the DuPont framework, management has 3 knobs to turn to drive up ROE: profit margin (“PM”), asset turnover ratio (“ATR”), and leverage. Through simple math, we can show that ROE is just the product of these three things, i.e.,
ROE = PM x ATR x leverage.
Among these three knobs, PM could be a double-edged sword. Investors tend to like higher PM. But outrageously high PM tends to invite competition and other unwanted attention, and hence is often unsustainable. ATR is a good knob; it reflects the company’s know-how and accumulation of experiences. And finally, leverage is generally a bad knob to turn, especially beyond a certain threshold.
Based on the above discussions, the following three charts show how Musk has been turning these knobs at TSLA over the past few years. The top panel of the first chart shows the PM knob and the bottom panel the ATR knob (also known as asset utilization). As seen, the PM stabilized for TSLA around 2019 and has improved to the current ~14.2% level. On average, the PM for the overall economy fluctuates around 10%, and currently, it hovers around 11.6%. So TSLA’s current 14.2% PM is competitive for sure, but nowhere near an unsustainable level.
The next panel shows the ATR driver. As the name suggests, it measures how efficiently the management has been utilizing its assets. As seen, TSLA’s ATR has been consistently improving. It started a bit above 0.4x five years ago. And it has steadily improved to about 0.8x in 2019~2020. Then note that the pandemics and lockdowns caused its ATR to dip a bit during 2020 to be slightly below 0.8x. Then it recovered and further improved to the current level of 1.08x. To put things into perspective, the ATRs for Ford (F) and General Motors (GM) are around 0.55x, only about half of TSLA’s.
Source: author and Seeking Alpha data.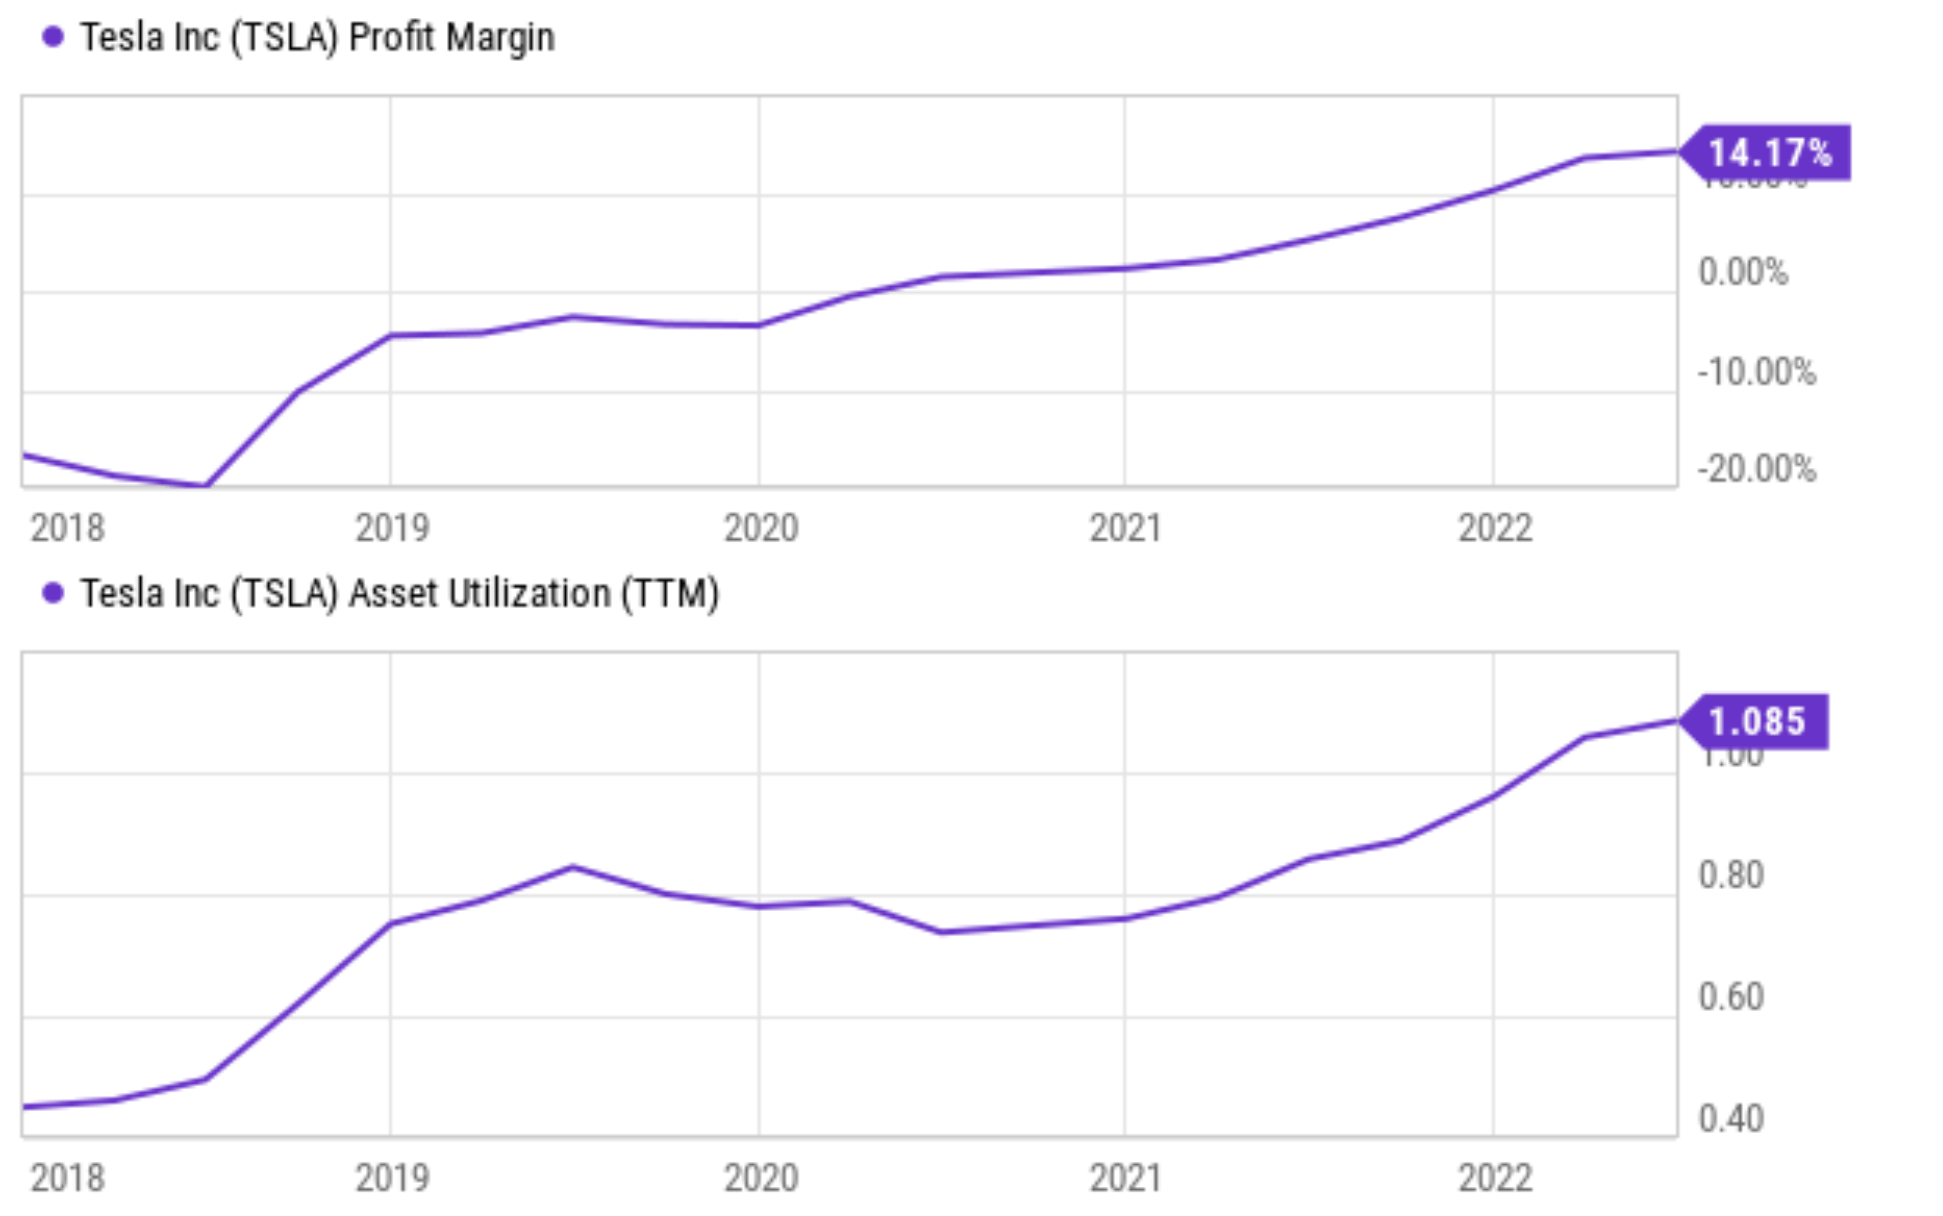
The next chart shows the leverage knob. One thing about Musk that the bears cannot deny is that he has mastered the art of working with the capital market. The company has issued a total of $23.8B of new equity between 2015 and 2021 cumulatively, often at very favorable stock prices. While the debt was never too high, it peaked at around $12.4B at a time when its market cap exceeded $1T. And it has been reduced to a mere $5.34B since then.
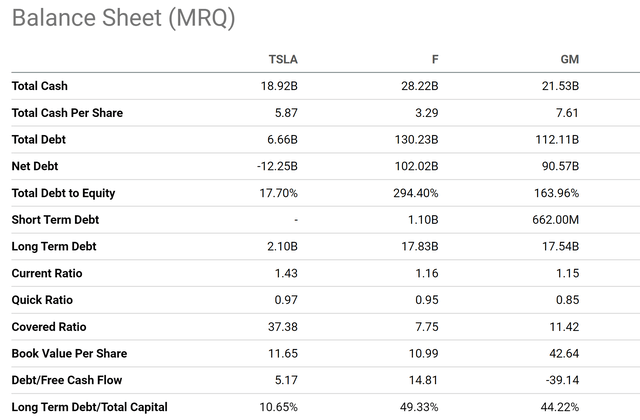
As a result, TSLA’s leverage has dramatically decreased over the past few years. It was above 6x in 2018 and is now only 1.88x. To put things into perspective, the next chart compares its capital structures against F and GM. As seen, its leverage is less than 1/4 of either F or GM. Its Long Term Debt/Total Capital ratio of 10.65% is almost 1/5 of F’s 49.33% and 1/4 of GM’s 44.22%. It could repay all its debt in 5.17x years with its current free cash flow, while it would take F almost 15 years to do so.
Source: author and Seeking Alpha data. Source: author and Seeking Alpha data.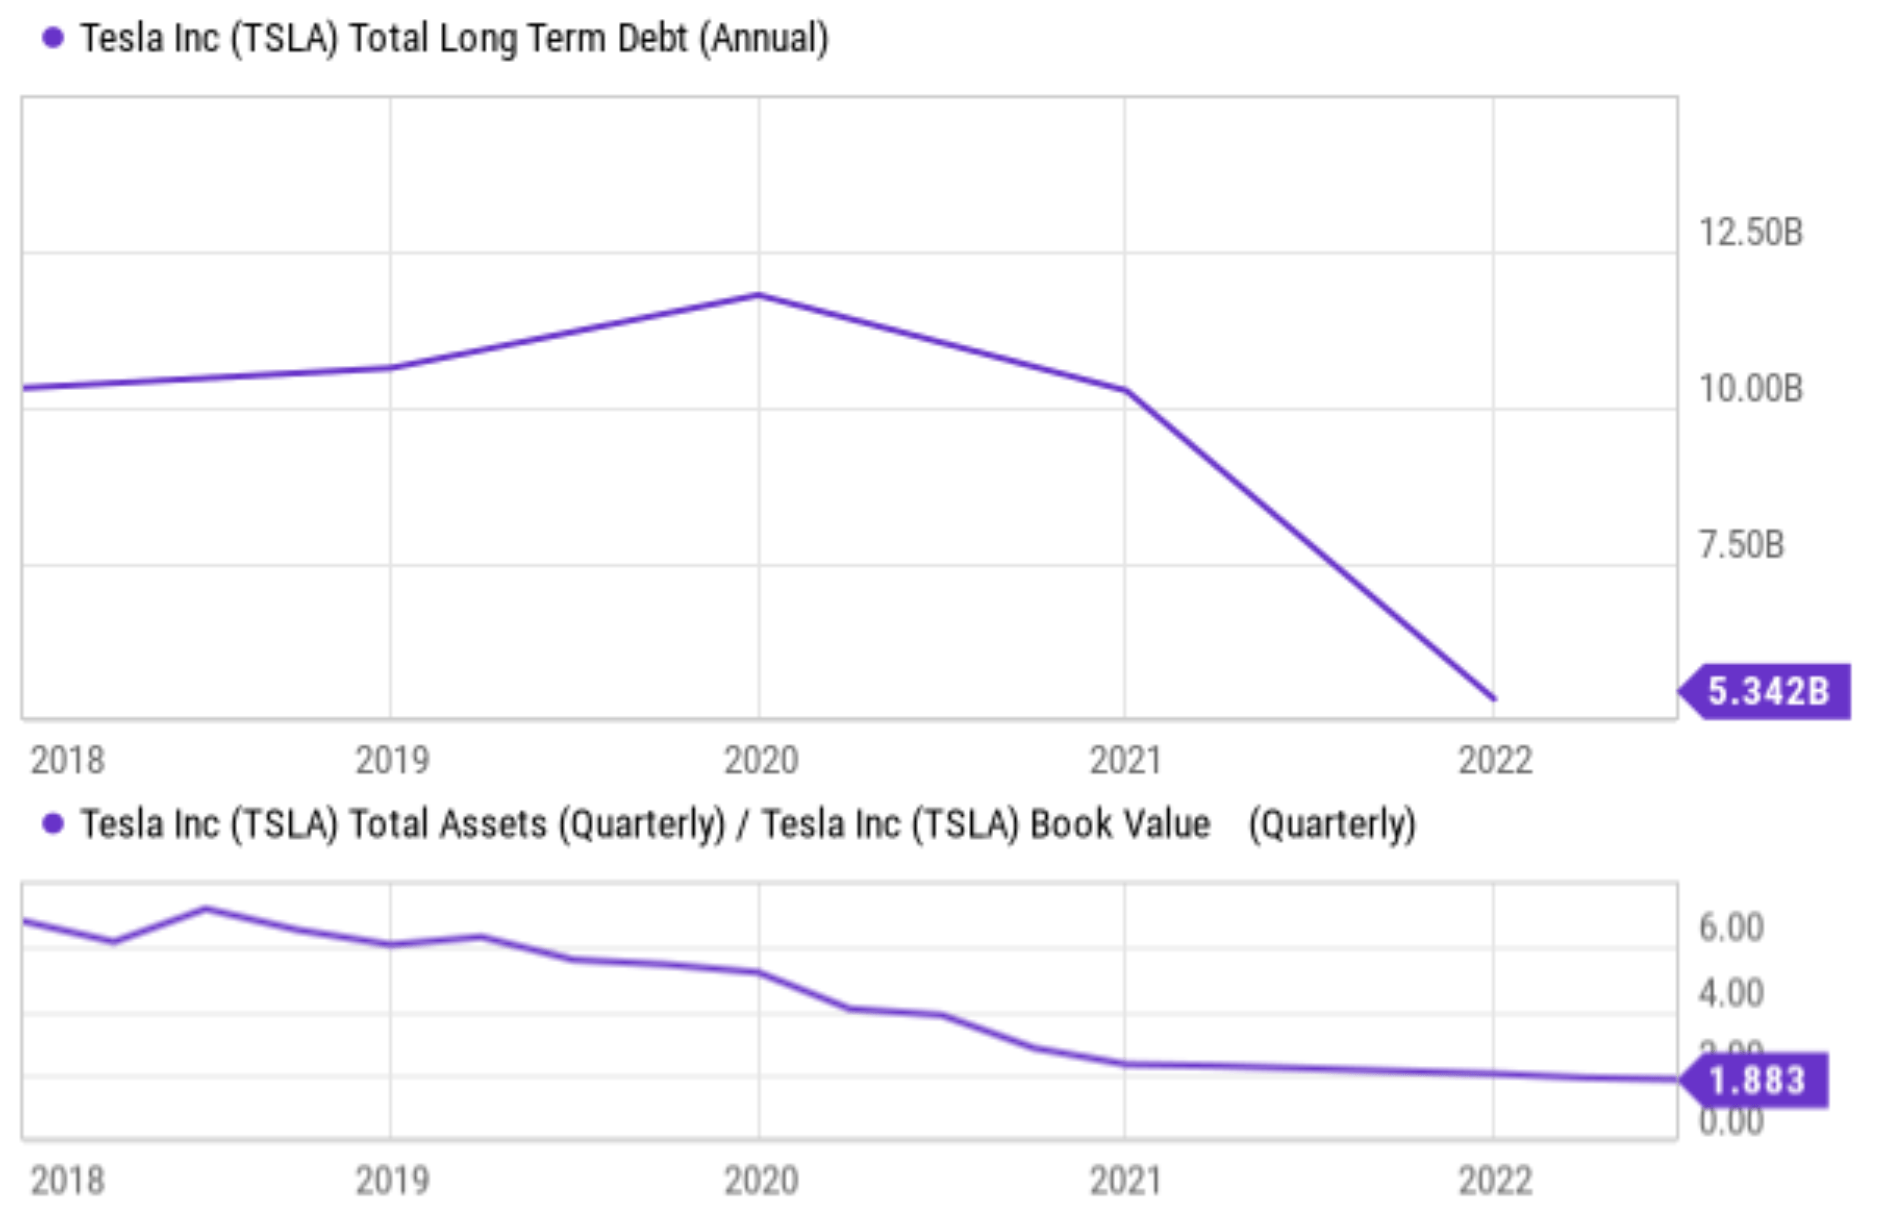
Risks and final thoughts
There are certainly risks associated with TSLA. Since this article is more focused on Musk, I will point out a few key risks that are more closely tied to the man rather than the overall business. No matter how much the bears dislike Musk, if he leaves TSLA, it would be a heavy blow to TSLA’s brand image and also market valuation in my mind. Also, his departure would be very likely to trigger the departure of other key employees. Musk owns more than 20% of the company’s stock and he uses it as collateral for personal loans. Combined with his colorful personality, this situation could cause large volatility risks as investors have experienced multiple times already. As a recent example, back in Nov 2021, his Twitter poll about whether he should reduce his holdings or not caused a 17% fluctuation in TSLA stock price in a day.
All told, Elon Musk is a highly effective CEO and a positive catalyst for the Tesla thesis the way I see it. And again, the way I see it is more anchored in an objective review of the financial metrics. He not only met 11 of the 12 tranches, which are admittedly more growth-oriented, but when evaluated against profitability-oriented metrics, he has also been delivering solid progress in recent years. Profitability metrics such as ROIC and ROE showed substantial improvement. And more importantly, these improvements are achieved by dialing up the good knobs (such as profit margin and asset utilization) and dialing down the bad knob of leverage.
Be the first to comment