


Justin Sullivan
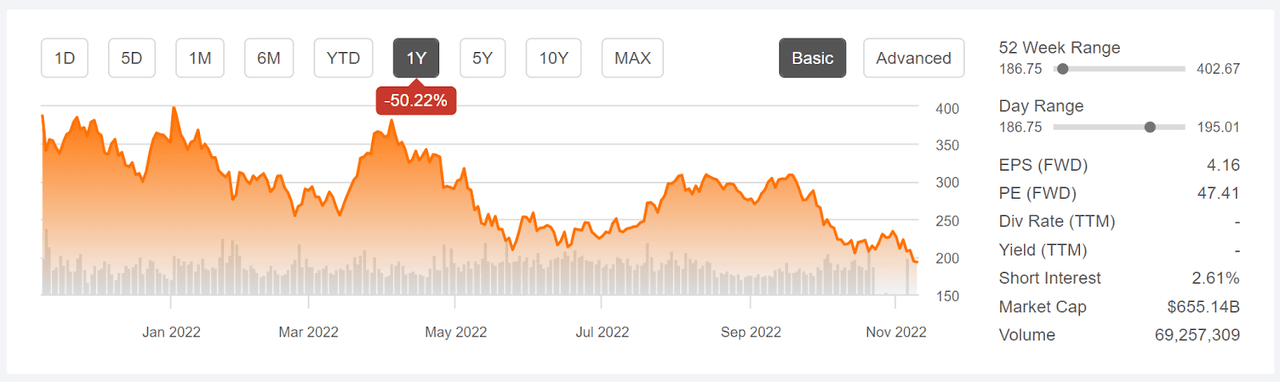
Shares of Tesla (NASDAQ:TSLA) have fallen by 15% from the closing price on October 31st and are down 51.6% from the 12-month high closing price of $399.93 on January 3rd. The shares are currently trading at 12-month lows. The drop in the share price since the end of October is largely attributable to declining vehicle sales in China for October, with the company cutting the prices of the Model 3 and Model Y by 9% to maintain demand. The market response to the China news was probably exacerbated by growing concerns after TSLA’s revenue miss for Q3 (reported on October 19th).
Seeking Alpha
12-Month price history and basic statistics for TSLA above.
Tesla’s valuation depends on continued rapid growth in revenues and earnings. This fact makes the share value quite sensitive to changes in interest rates. The theoretical value of a stock is the net present value of future earnings. The further into the future that these earnings are expected, the larger the compounded impact of increasing the discount rate, which depends on current interest rates. Rising interest rates are one of the factors driving TSLA down.
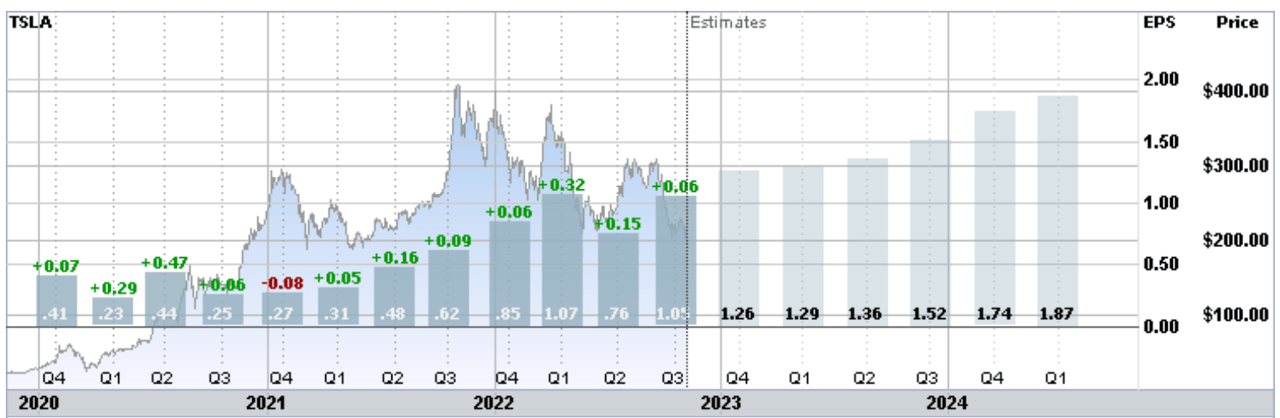
The prevailing view among Wall Street analysts is that TSLA can maintain recent years’ incredibly rapid growth rates. The consensus for the rate of EPS growth over the next 3 to 5 years is 31.6% per year. If the company fails to deliver earnings in line with this outlook, the share valuation is likely to decline.
ETrade
Trailing (3 years) and estimated future quarterly EPS for TSLA. Green (red) values are amounts by which EPS beat (missed) the consensus expected EPS above.
Tesla has generated growth rates that amply demonstrate the company’s exceptionalism. TSLA’s YoY revenue growth rate is 59.8%, as compared to 4.5% for Toyota (TM), 6.6% for Mercedes-Benz Group (OTCPK:MBGAF), 12.4% for General Motors (GM), and 12.7% for Ford (F). TSLA also has gross profit margins that are higher than those of these competing firms. Given the massive difference in scale of production, TSLA’s higher profit margins are impressive. The question for investors is whether the current share valuation makes sense, given that this valuation is sensitive to interest rates and depends on maintaining heroic growth rates.
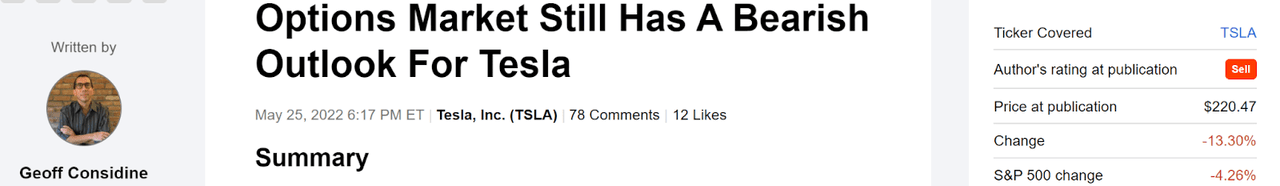
I last wrote about TSLA on May 25, 2022, about 5 ½ months ago, and I maintained a sell rating on the shares. At that time, the Wall Street consensus rating on TSLA was a buy and the consensus 12-month price target was almost 50% above the share price. One red flag from the analyst outlooks was the extremely high dispersion among the individual price targets. Research has shown that the consensus price target is a meaningful predictor only when the spread in individual price targets is quite low. In fact, a consensus price target that implies a high return is actually a bearish indicator when the spread in the individual price targets is high. The valuation, then as now, was a concern and required incredible growth rates to be justified. I also noted that rising interest rates put downward pressure on the shares. I also looked at the market-implied outlook, a probabilistic price forecast that represents the consensus view from the options market. The market-implied outlook to mid-January of 2023 was substantially bearish. In the 5 ½ months since this post, TSLA has returned -13.3% vs. -4.26% for the S&P 500 (not including dividends).
Seeking Alpha
Previous analysis of TSLA and subsequent performance vs. the S&P 500 above.
For readers who are unfamiliar with the market-implied outlook, a brief explanation is needed. The price of an option on a stock is largely determined by the market’s consensus estimate of the probability that the stock price will rise above (call option) or fall below (put option) a specific level (the option strike price) between now and when the option expires. By analyzing the prices of call and put options at a range of strike prices, all with the same expiration date, it is possible to calculate a probabilistic price forecast that reconciles the options prices. This is the market-implied outlook. For a deeper explanation and background, I recommend this monograph published by the CFA Institute.
With TSLA trading at 12-month lows, I have calculated updated market-implied outlooks and I have compared these with the Wall Street consensus outlook in revisiting my rating.
Wall Street Consensus Outlook for TSLA
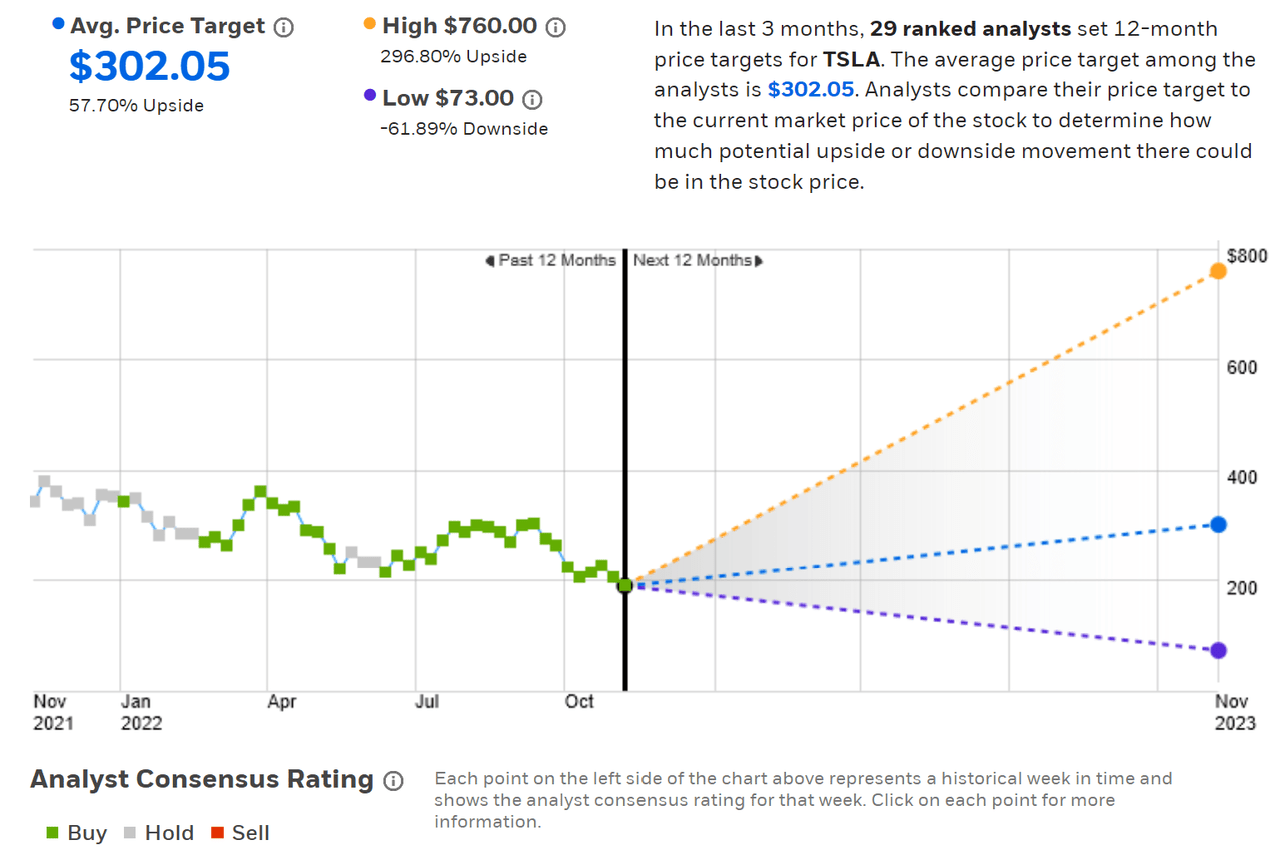
ETrade calculates the Wall Street consensus outlook for TSLA using price targets and ratings from 29 ranked analysts who have published their views over the past 3 months. The consensus rating is a buy and the consensus 12-month price targets is 57.7% above the current share price. As in my post from May, there is an enormous spread among the individual price targets. As a rule of thumb, I discount the consensus price target when the ratio of the highest to lowest price target is greater than 2. In this case, the ratio is 10.4 ($760 / $73).
ETrade
Wall Street analyst consensus rating and 12-month price target for TSLA above.
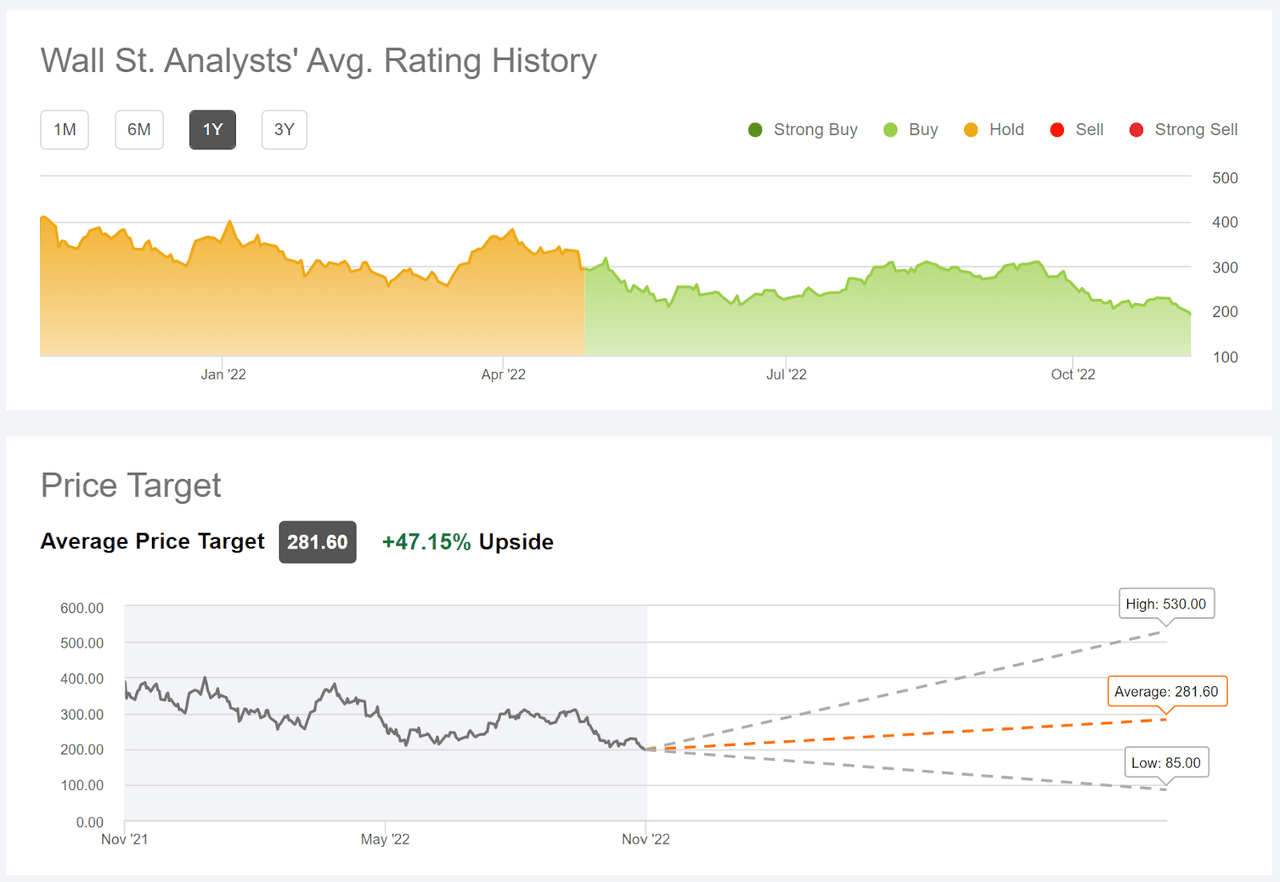
Seeking Alpha’s version of the Wall Street consensus outlook is calculated using the views of 35 analysts who have published ratings and price targets within the last 90 days. The consensus rating is a buy and the consensus 12-month price target is 47.2% above the current share price. I don’t put much weight on this number, however, because of the very large spread among the individual price targets.
Seeking Alpha
Wall Street analyst consensus rating and 12-month price target for TSLA above.
In the current results, as in my previous posts on TSLA in May of 2022 and in April of 2021, the spread among the individual analyst price targets is extremely high. This, in turn, suggests that the consensus outlook is unlikely to have predictive value. The consensus price target that is about 50% above the current share price, along with the large spread in individual price targets, may actually be a bearish indicator.
Market-Implied Outlook for TSLA
I have calculated the market-implied outlook for TSLA for the 2.4-month period from now until January 20, 2023 and for the 7.2-month period from now until June 16, 2023, using the prices of call and put options that expire on these dates. I selected these two expiration dates to provide a view through the end of 2022 and to the middle of 2023. In addition, options with expiration dates in January and June tend to be highly traded, increasing the confidence in the representativeness of the market-implied outlook.
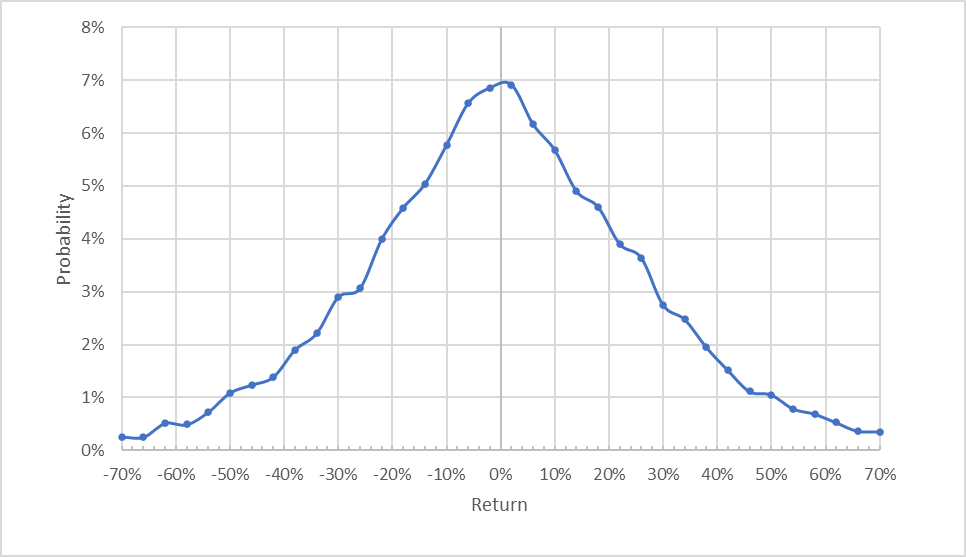
The standard presentation of the market-implied outlook is a probability distribution of price return, with probability on the vertical axis and return on the horizontal.
Geoff Considine
Market-implied price return probabilities for TSLA for the 2.4-month period from now until January 20, 2023, above.
The market-implied outlook to mid-January of 2023 is very symmetric, with probabilities of positive returns that are very close to those for negative returns of the same magnitude. The expected volatility calculated from this outlook is 62% (annualized). For comparison, ETrade calculates a 59% implied volatility for the January options.
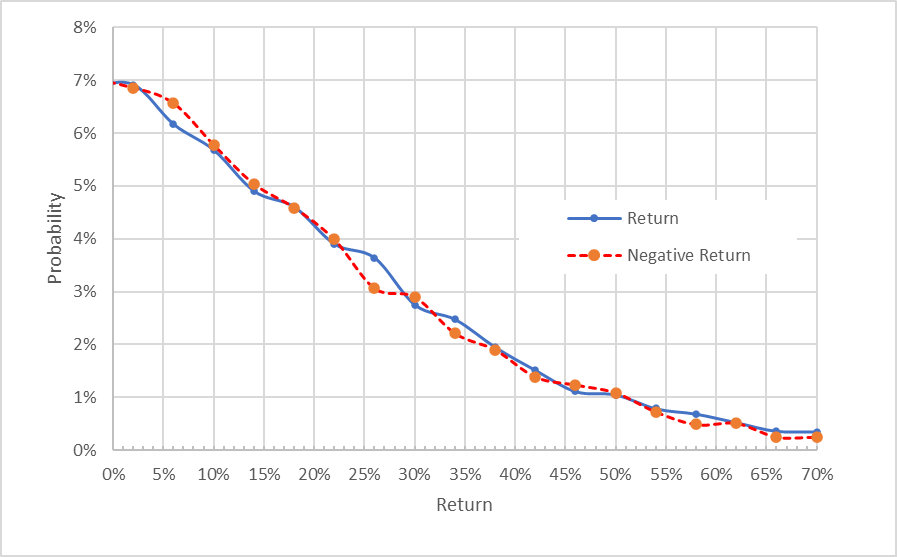
To make it easier to compare the relative probabilities of positive and negative returns, I rotate the negative return side of the distribution about the vertical axis (see chart below).
Geoff Considine
Market-implied price return probabilities for TSLA for the 2.4-month period from now until January 20, 2023. The negative return side of the distribution has been rotated about the vertical axis above.
This view shows just how closely the probabilities of positive and negative returns match up, across the entire range of possible outcomes (the solid blue line and the dashed red line are basically on top of one another). These results indicate a neutral outlook for the next 2.4 months.
Theory indicates that the market-implied outlook is expected to have a negative bias because investors, in aggregate, are risk averse and thus tend to pay more than fair value for downside protection. There is no way to measure the magnitude of this bias, or whether it is even present, however. The expectation of a negative bias shifts what would otherwise look like a neutral outlook to a slightly bullish view.
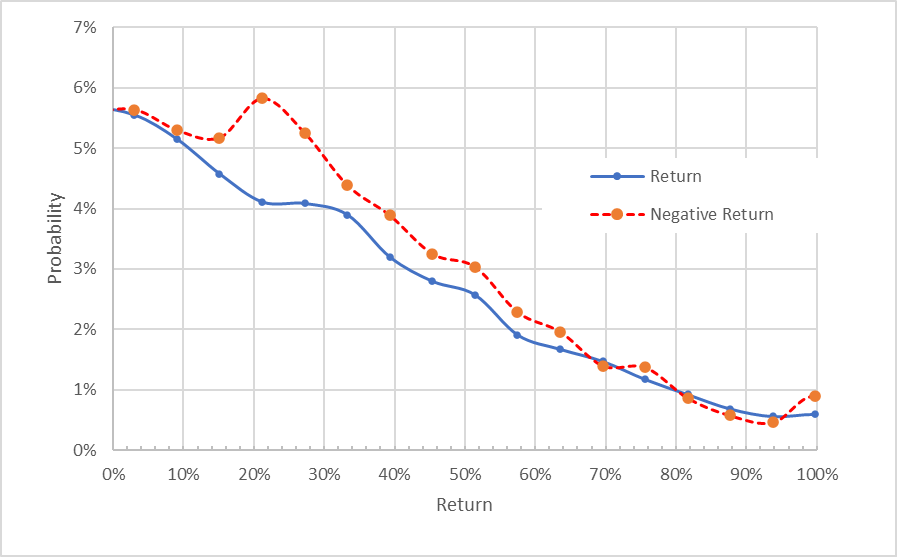
The market-implied outlook for the 7.2-month period from now until June 16, 2023 has probabilities of negative returns that are consistently higher than those for positive returns, across a wide range of possible outcomes (the dashed red line is consistently above the solid blue line over the left ⅔ of the chart below). The maximum probability corresponds to a price return of -21%. Even with consideration of a potential negative bias, I interpret this outlook as bearish. The expected volatility calculated from this distribution is 63% (annualized).
Geoff Considine
Market-implied price return probabilities for TSLA for the 7.2-month period from now until June 16, 2023. The negative return side of the distribution has been rotated about the vertical axis above.
The market-implied outlook for TSLA is very slightly bullish to mid-January of 2023, but bearish from now until mid-June of 2023. This suggests that TSLA may have gotten a bit oversold in the current sell-off, so a bounce in the next couple of months would not be a surprise. Over the longer-term, however, the outlook is somewhat bearish. In my analysis in late May, the 7.9-month outlook to January 20, 2023 was much more bearish than the current 7.2-month outlook to June of 2023. The expected volatility calculated in late May, 74%, was notably higher than the current estimation for expected volatility. The current outlook to the middle of 2023 is bearish, with high volatility, but the probability of large declines in the share price is lower than it was in late May.
Summary
Tesla has generated exceptional revenue growth in recent years, justifying a substantial premium on the share price as compared to other auto manufacturers and many successful tech companies, as well. That said, the value of a share of TSLA should be quite sensitive to prevailing interest rates as well as any shortfalls in the growth trajectory. With substantial gains in interest rates in 2022, along with concerns about slowing sales growth in China and Q3’s revenue miss, how does one evaluate TSLA? The Wall Street consensus outlook is of limited value because there is such a high level of disagreement between the analysts who follow the company. The consensus rating is a buy and the consensus 12-month price target implies a gain of around 50% from current levels, but I have little confidence in the usefulness of these metrics. If anything, the high consensus price target with high dispersion in the individual price targets is a somewhat bearish indicator. The market-implied outlook for TSLA is slightly bullish to mid-January of 2023 but moderately bearish to the middle of 2023. I am maintaining my sell rating on TSLA, although there is decent potential for some price recovery through the end of this year.
Be the first to comment