

anilakkus/iStock via Getty Images
In this article, we will trace backwards to Tesla’s (NASDAQ:TSLA) pre-stock-split bearish price target of $176 while examining why an initial recent bullish pattern may have failed and look at whether this latest low might be the last piece in that bearish third wave puzzle.
The last article I wrote on Tesla outlined how there was a potential bullish wave pattern in play, the only caveat was that in order to maintain that bullish pattern, the stock needed to stay above $208; the thing is, it didn’t.
Also noted from the last article was that although in a potentially bullish structure, Tesla may want to complete its third wave to $176 before creating a three wave pattern north, that scenario has now seen a heightened probability with this latest lower low.
Fast forward to last week and investors didn’t have the appetite to carry the stock price higher with a mixed reaction to earnings rendering the bull pattern a fail in brutal fashion.
Murmurings of Elon Musk having to sell more stock to finance the Twitter (TWTR) takeover didn’t help either but sometimes we must respect that a financial market wants to do what it wants to do and perhaps we are seeing that now.
Moving to the charts, we can briefly again examine the original bearish pattern from the original topping at $1,242. A drop to $709 creating the wave one and a wave two including a bullish candle paving the way for the break below $709 itself topping out just under $1,200.
Tesla monthly (C Trader)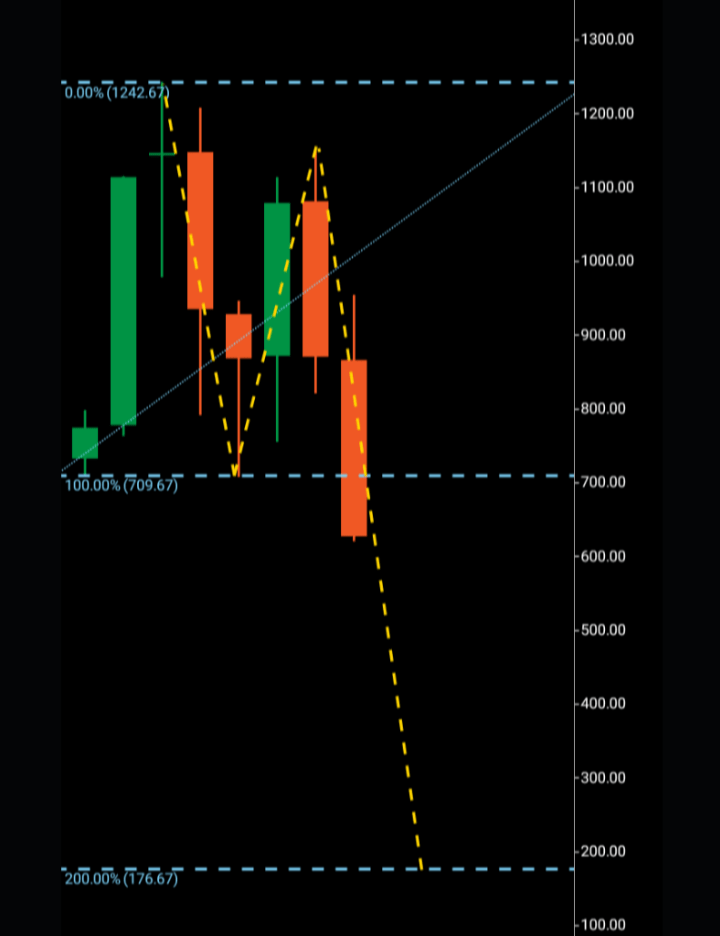
After examining monthly charts, I like to then move to the weekly to garner more information about the internals of the macro structure. It is from the weekly chart that came a potential bullish pattern should Tesla have stayed above $208. With this latest break lower, we are forced to sift through the weekly chart again looking for any confluence with $176 or even a technical number where this equity may be headed next.
$208 was not a Fibonacci level and financial markets do like Fibonacci levels, especially in bearish scenarios, a financial market may not always replicate its wave one like its bullish counterparts, which generally will complete by numerically copying its wave one before making a decision on its next direction. Bearish waves sometimes bottom at Fibonacci 161 levels and in this case $208 was both below the Fibonacci 161 and 200 and did not represent a technical level at all.
If we move to the weekly chart below, we can see retracing backwards some time, we are able to find the original bearish wave pattern. What had been translated into the wave one as $414-$324 and the wave two topping out just below the $400 region. We can also see that the two first significant Fibonacci levels have been bypassed and it is to the 261 that we must look to with $180 as its target.
Tesla weekly (C Trader)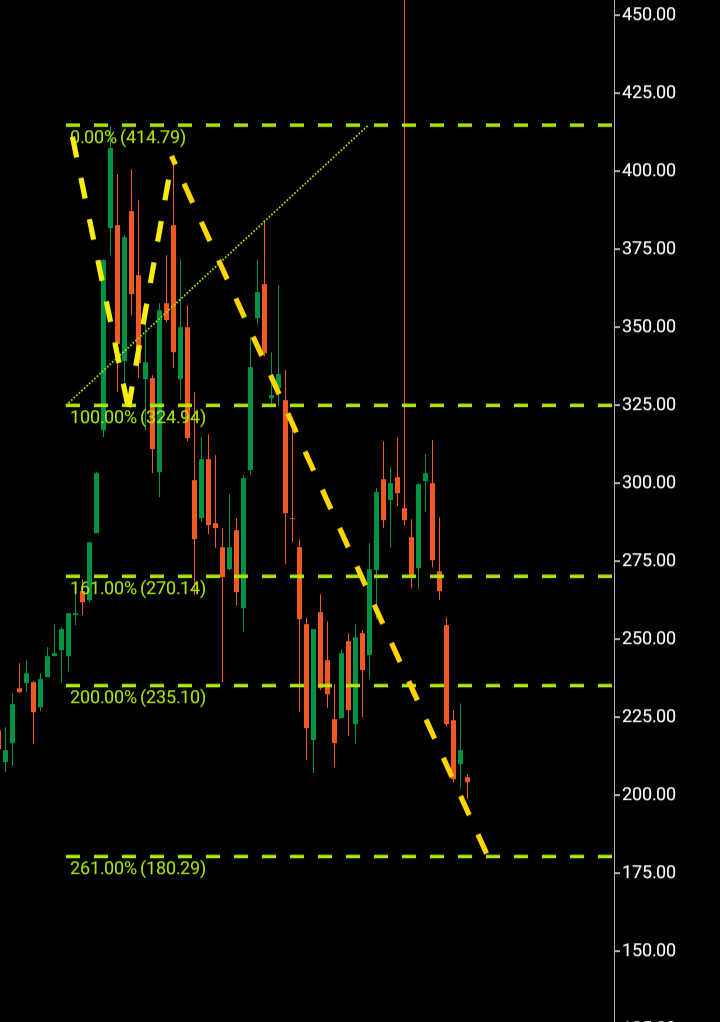
To summarize, it is only if Tesla reaches the $176-$180 price region and shows signs of turning around that we can look to issue a buy rating. For the moment, as the stock is nearing that level, I am recommending hold as within the next 30-90 days we could have the final piece of this puzzle.
About the Three Wave Theory
The three wave theory was designed to be able to identify exact probable price action of a financial instrument. A financial market cannot navigate its way significantly higher or lower without making waves. Waves are essentially a mismatch between buyers and sellers and print a picture of a probable direction and target for a financial instrument. When waves one and two have been formed, it is the point of higher high/lower low that gives the technical indication of the future direction. A wave one will continue from a low to a high point before it finds significant enough rejection to then form the wave two. When a third wave breaks into a higher high/lower low, the only probable numerical target bearing available on a financial chart is the equivalent of the wave one low to high point. It is highly probable that the wave three will look to numerically replicate wave one before it makes its future directional decision. It may continue past its third wave target but it is only the wave one evidence that a price was able to continue before rejection that is available to look to as a probable target for a third wave.
Be the first to comment