

IvelinRadkov/iStock via Getty Images
Thesis
During its Q2 earnings release (“ER”), Tesla, Inc. (NASDAQ:TSLA) reported a total delivery of 254,695 cars worldwide in the Mar-to-June quarter. The results are above the 201,250 deliveries from a year ago (by about 21%). However, it narrowly missed a consensus expectation of 261,181 vehicle deliveries (by about 2.5%). The consensus expectation was an average of analyst estimates compiled by Bloomberg.
To me, what is of fundamental importance is to see if the delivery results fit to Wright’s Law and see the underlying trend. Once examined this way, TSLA is actually showing cost reduction according to the law in both Q1 and Q2 2022 despite the challenges. Both Q1 and Q2 are unique for TSLA, as its Shanghai factory was shut down for extended periods of time. And as you will see next, its production cost still decreased on a per vehicle basis despite the challenges at a 10% rate, within the range of Wright’s Law.
Looking ahead, I see its factories are resuming capacity. Furthermore, there are signs that raw material costs are decreasing. These catalysts can help it further reduce production costs and converge to the law even faster.
Wright’s law
Theodore Paul Wright was a prominent aeronautical engineer. And Wright’s Law refers to his observation (hence it is really not a “law” in the legal or physical science sense) that for every doubling of airplane cumulative production, the labor requirement was reduced by 10-15% on a per-unit basis. The law was then shown miraculously predictive for a wide range of products beyond airplanes, ranging from semiconductor chips, battery cells, and automobile production – which leads me to the main topic for today. As detailed in my earlier article:
Specific to the auto industry, the following chart shows how the Wright’s Law applies for Ford’s Model T between 1909-1923. And as you can see, the relationship between production cost and cumulative units is precisely predicted by Wright’s Law, which says the relationship should be a straight line on a log-log plot. And if you measure the slope of this line in the chart, you would see that it is about 15%. This means that traditional auto industry has enjoyed a 15% cost reduction per cumulative production doubling – near the upper limit of Wright’s law.
Now, let’s see if how/if TSLA’s data fit this law next.
Source: ARK invest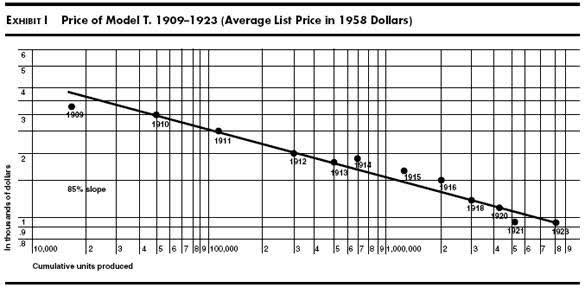
TSLA Q2: Wright’s law continues
The chart below shows how the law applies to TSLA. It’s kind of a busy chat with quite a bit of information content. So let me start with a few basics. The vertical axis shows TSLA’s cumulative average unit cost (i.e., its cumulative cost of production divided by its cumulative number of vehicles delivered) since it started to deliver vehicles in 2013. The horizontal axis shows the cumulative number of vehicles delivered. And the plot is on a log-log scale. So firstly, you see an overall decreasing trend – which is a good starting point. But the relationship is not a straight line, i.e., not an ideal fit for Wright’s Law (at least not so far).
However, if you break up the data points into groups considering that TSLA is still in its early stage and has gone through several major changes, the data began to make more sense. In my mind, at its current stage, every addition of a giga-factory is a major change and could impact how the law applies.
The orange line shows Wright’s law fit to a 10% cost reduction using its delivery data between 2017 and 2025, and you can see it is a decent fit for those years. Then the green line shows Wright’s law fit to a 10% cost reduction again using its delivery data since 2017, and again it is a good fit, too. As you can visually see, the orange line and the green light are almost parallel to each other, suggesting a similar slope and hence cost reduction rates (which happened to be 10%).
Now let’s focus on the 2022 Q1 and Q2 data points, as highlighted in the green box. As you can see, those two data points fell quite close to the green line, signaling the continuation of Wright’s Law. Due to the use of a log-log scale, the details are hard to see. So, here let me quote the numbers directly. The cumulative average unit cost is $53,720 up to 2021. And if the cumulative average unit cost were to follow the law in 2022 Q1 and Q2, then unit cost (in this hypothetical scenario) should have been $52,712 and $51,982, respectively, given the additional deliveries. And the actual unit costs are $52,451 and $52,224, respectively – within half of a percent difference from the predictions.
And looking forward, there are some near-term factors, particularly production ramp-up and commodity cost declines, to further catalyze the cost reduction, as detailed below.
Source: author based on Seeking Alpha data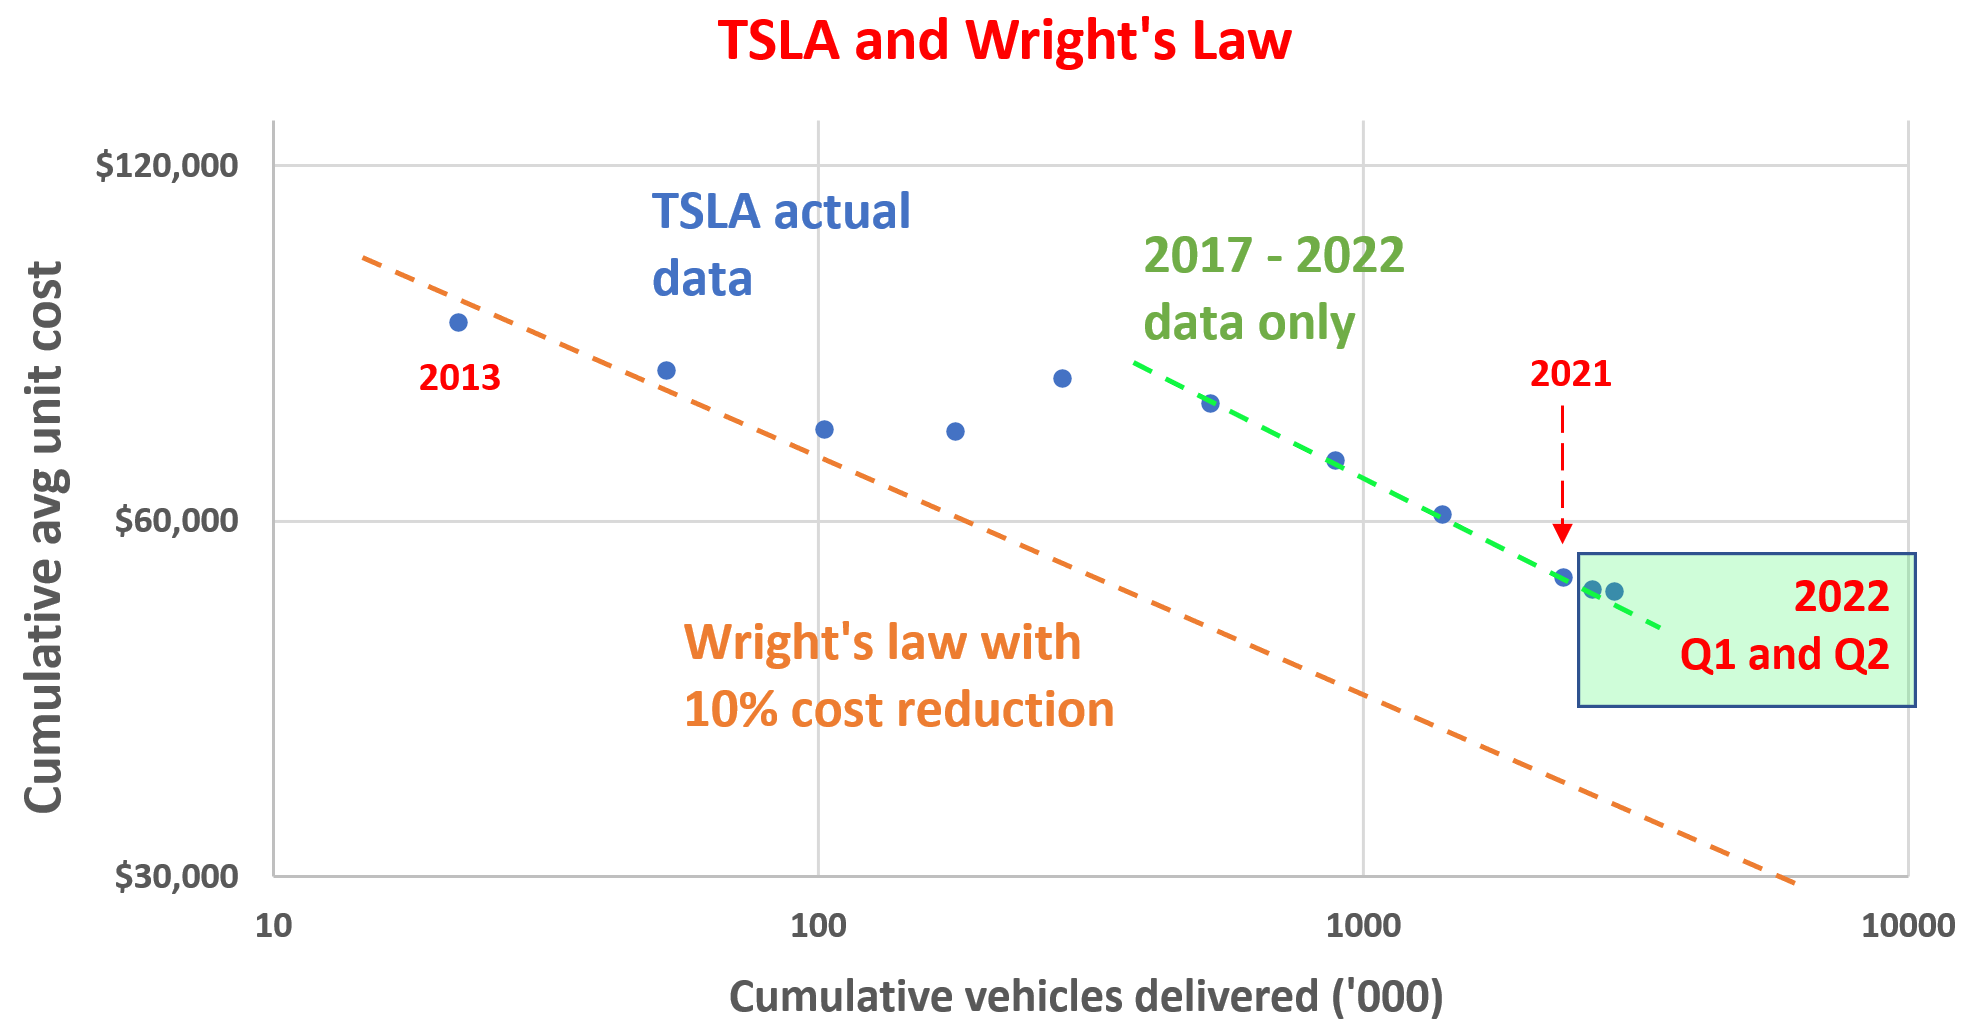
Business outlook – capacity ramp up
Despite some setbacks (e.g., issues with 4680 cells), its Giga factories are ramping up. As commented by Elon Musk during the Q2 ER (abridged and emphases added by me):
So, also making good progress with production ramp with Berlin. We achieved an important milestone of 1,000 cars a week in June. And we are expecting…our Giga Texas to exceed the 1,000 vehicle per week milestone, hopefully in the next few months. To be clear, we are currently making the cars with the 2170 cells and Drew Baglino will address some of the 4680 questions later in this call. But it is worth emphasizing that we have enough 2170 cells to satisfy all vehicle production for the remainder of the year.
The Fremont Factory made a record number of vehicles in Q2. Its production was relatively stable and reliably produces 100k Model S/Model X and 550k Model 3/Model Y. Shanghai factor is designed to produce more than 750k Model 3/Model Y, and recent equipment upgrades should help it reach the full capacity.
TSLA Q2 ER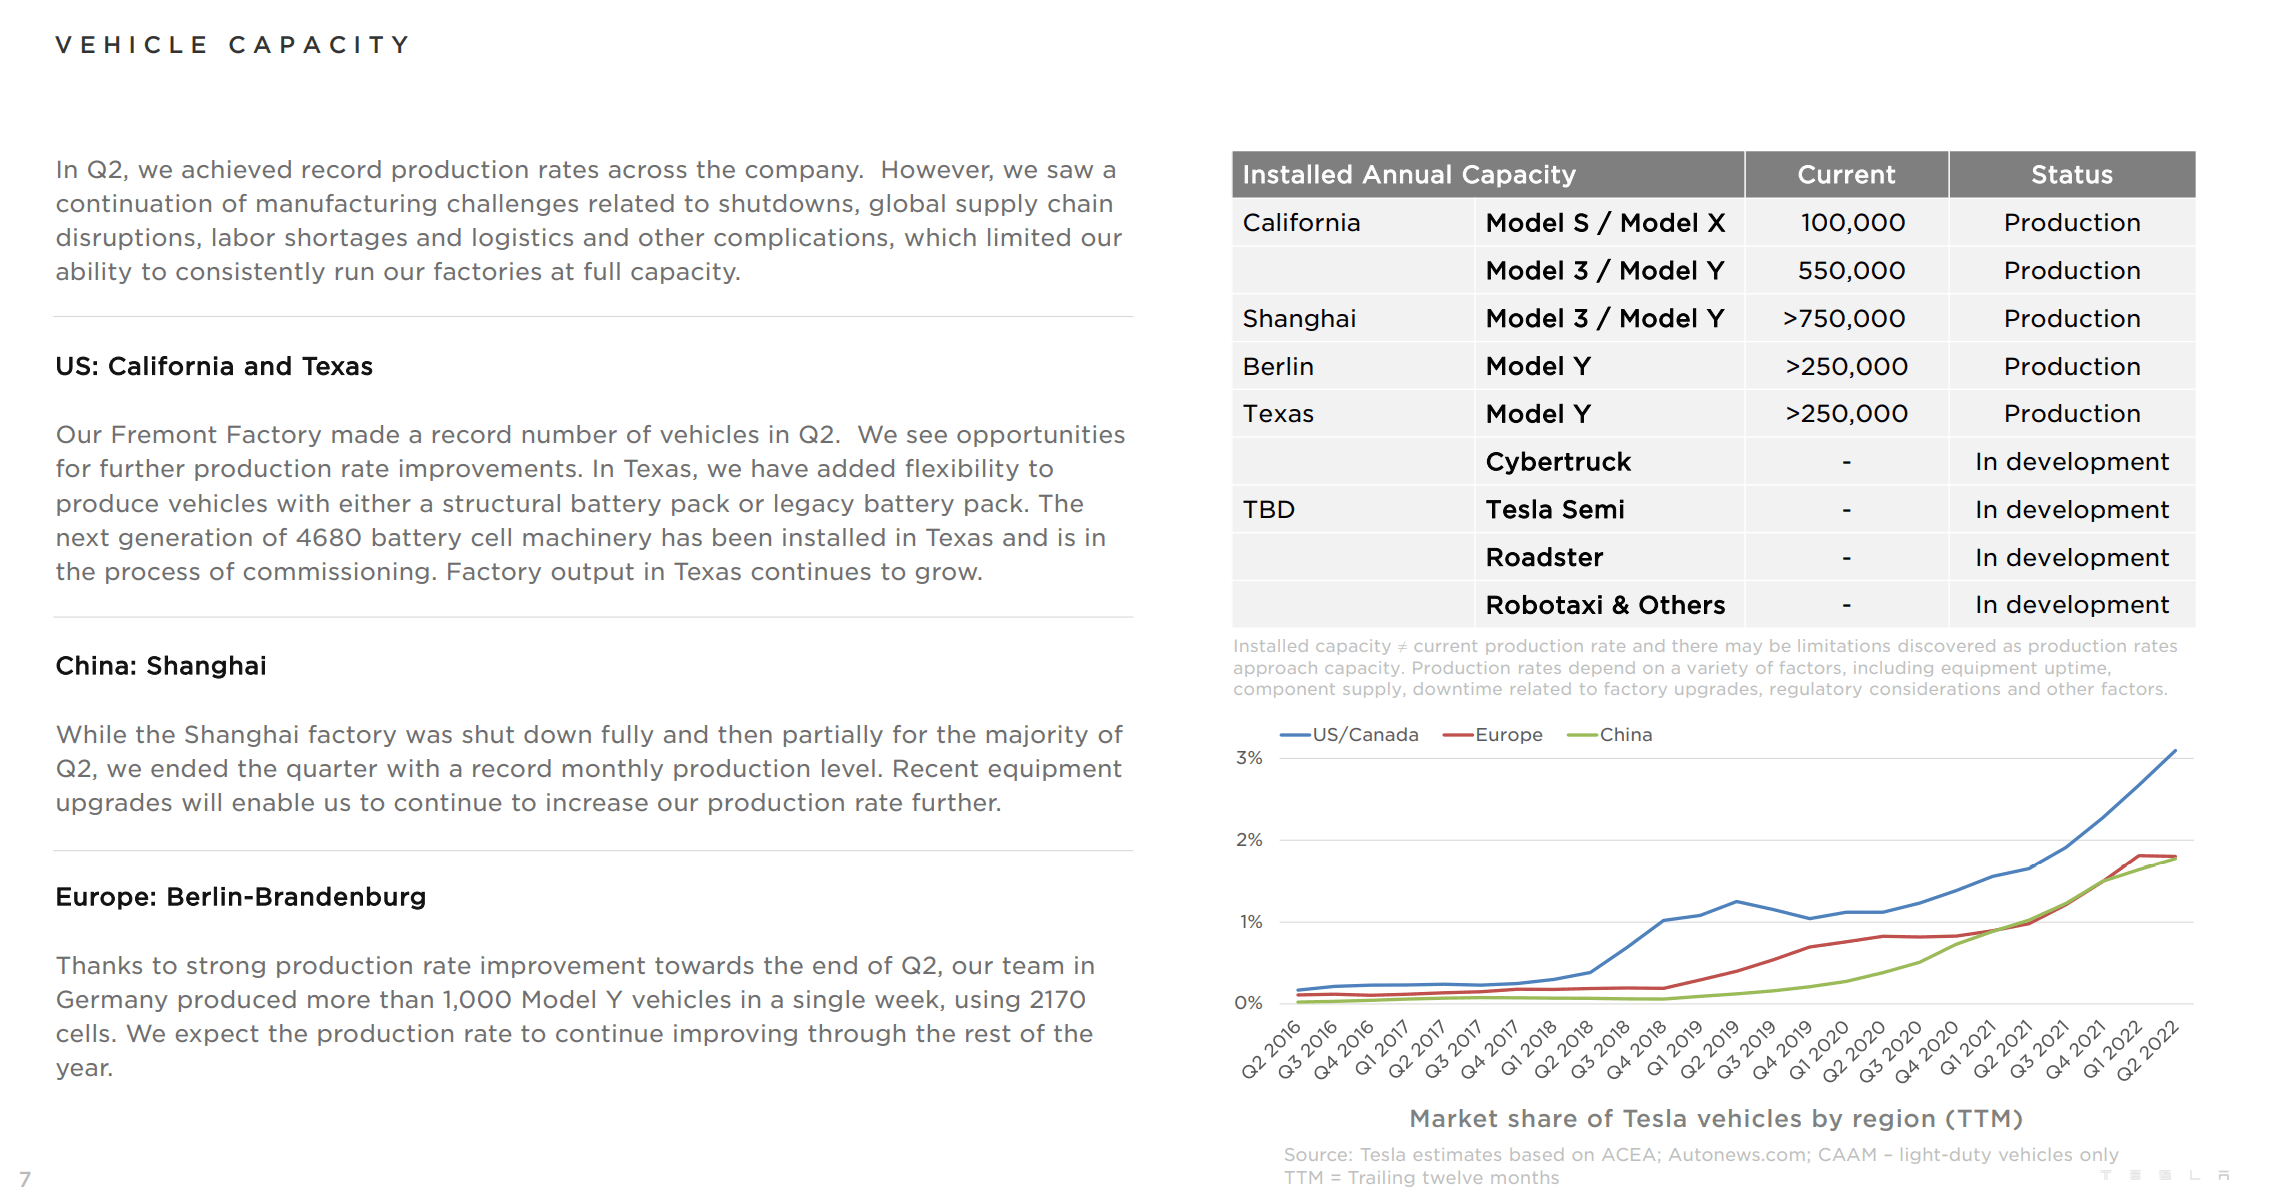
Business outlook – commodity prices
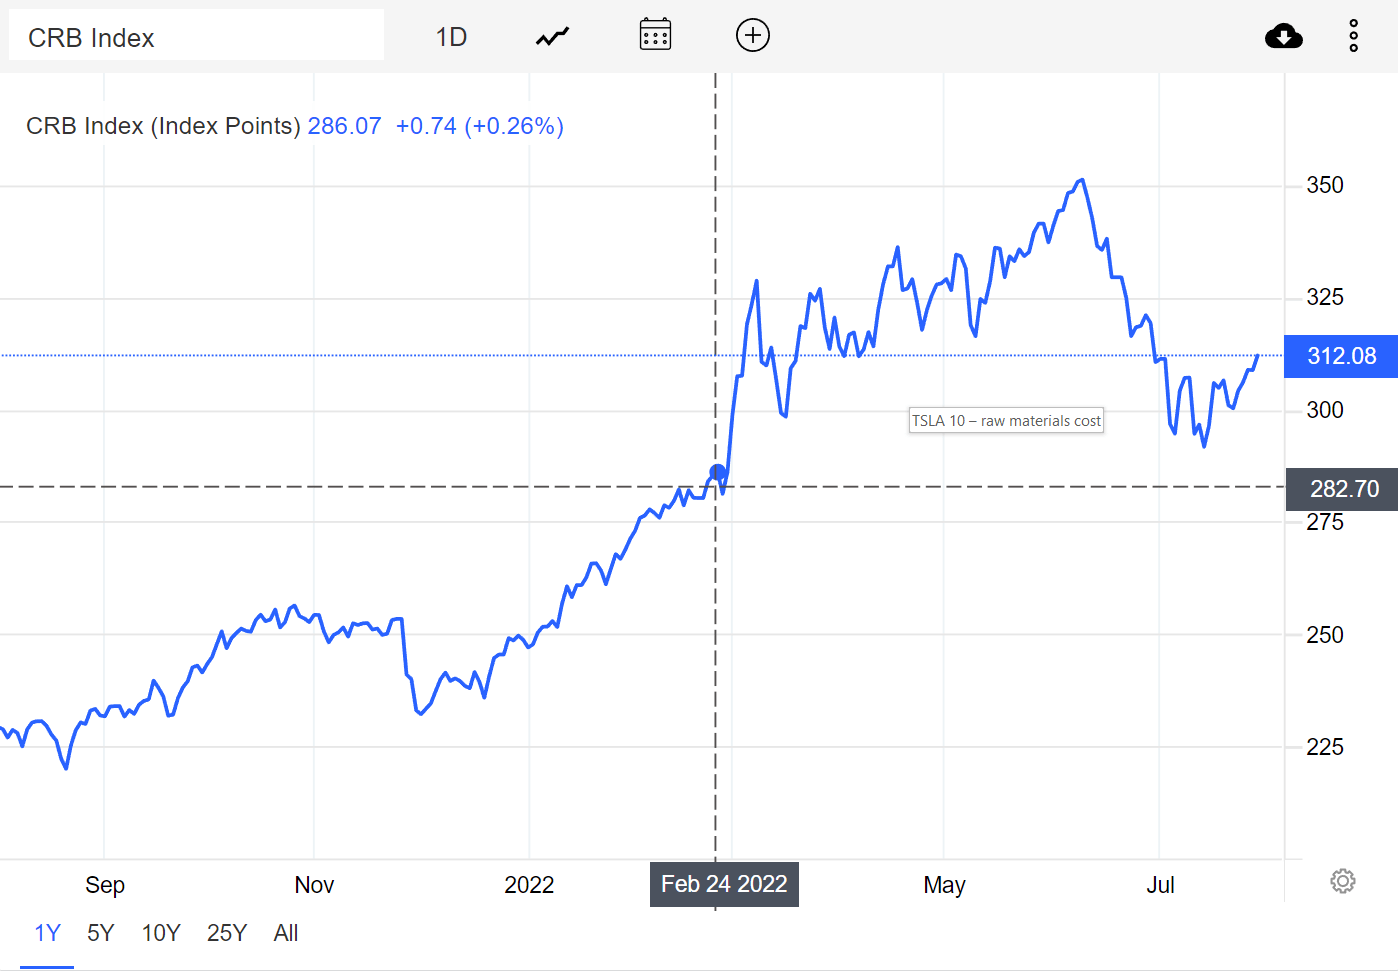
Also, there are signs that commodity prices are falling. In several Tweets posted on July 28, Musk mentioned that “inflation might be trending down” and “more Tesla commodity prices are trending down than up.” This year, the prices of commodities (especially materials critical for EV battery cells such as nickel, cobalt, palladium, lithium, etc.) have risen sharply. The commodity index was about 282 at the time the invasion of Ukraine broke out (February 24). The index surged to a peak of 350 shortly afterward. These interruptions have caused substantial cost inflation for TSLA.
And now, the commodity index has come down to the current level of 312, about 10% off its peak, which should help TSLA to better control production costs going forward.
Elon Musk Twitter Source: CRB index from tradingeconomics.com
Final thoughts on TSLA and risks
TSLA’s Q2 results, when interpreted in a more fundamental way, are not bad at all in my view. It is true that its deliveries missed consensus estimates narrowly. However, it is still delivering a healthy number of vehicles AND reducing unit costs at the same despite tremendous challenges under a very unique quarter. Its cumulative average unit cost continues declining in Q1 and Q2 2022 at a 10% rate, within the range of Wright’s Law. And looking forward, production ramp-up and commodity cost declines can further accelerate its cost reduction.
There are some risks in the near term, too. The global supply chain disruptions can persist longer, and Musk referred it to as a “kind of supply chain hell.” The China lock-down remains uncertain, and TSLA had to sell some of its Bitcoin holdings to prepare the liquidity just in case. Details of these risks are in the following comments provided by Elon Musk during the Q2 ER (abridged and emphases added by me):
Supply chain: I do want to emphasize this was obviously subject to force majeure, things outside of our control. The past few years have been quite a few force majeures and it’s been kind of supply chain hell for several years.
Cash position: … it should be mentioned that the reason we sold a bunch of our Bitcoin holdings was that we were uncertain as to when the COVID lockdowns in China would alleviate. So it was important for us to maximize our cash position, given the uncertainty of the COVID lockdowns in China.
Be the first to comment