

VCG/Getty Images News
Thesis
My past articles on Tesla (NASDAQ:TSLA) have been focusing on its nonlinear growth potential in the long term. As investors are on the edge of their seats, anxiously waiting for its earnings report on July 20, I want to switch the focus to the near term in this article.
If history is of any guidance, Elon Musk will surprise the investors in some way this round too. It is difficult enough to anticipate what the surprises will be (though I will take a stab at it in the next section). The major surprise may come from the China front. Tesla’s Giga Shanghai plant has been recovering since the lockdown during Q1. Depending on the market views on the degree of the recovery, it could trigger a large price movement. Furthermore, according to the China Passenger Car Association’s (CPCA) most recent data, the total TSLA volume amounted to 32,165 units for May. Still not on par with its best days, but it is only 4% less than a year ago. At the same time, global shipping data also shows signs that the supply chain disruptions are easing.
Even if the surprises are correctly anticipated, it is only the beginning. It’s even harder to predict how the market responds to such surprises, which brings me to some actionable ideas. To me, the market never seems to learn its Musk lesson and habitually underestimates its price volatility, creating an opportunity for using option investors either for hedging or for profiting. The options market’s implied volatility for TSLA is about 60% to 63% for options expiring in Jan 2023. To put things into perspective, the implied volatility for the NASDAQ 100 index (represented by QQQ) is about 30%. So the market views TSLA volatility to be only about 2x above the NASDAQ 100 index. But in reality, TSLA stock prices easily fluctuated more than 10x on a daily basis than QQQ, as we will see toward the end of the article.
Potential Q2 surprises
Several key cities in China, most notably Shanghai, have been in lock mode due to the resurgence of COVID cases early in the year. As a result, production at its Shanghai Gigafactory has halted for 22 days (from March 28 to April 19). After the lockdown has ended, TSLA has been restoring the production of its Shanghai factory. According to this report, its Shanghai production has recovered to 70% of its pre-lockdown output level as of May 23. The new development since May 23 could be a source of major surprise during the Q2 earnings report.
My forecast is that the surprise will be on the positive side for two reasons. First, according to the latest data from the China Passenger Car Association (“CPAA”), the supply side has improved significantly since April, and the country’s automobile production capacity to fully recover in the next few months. You can see how miserable the April month is for TSLA in the chart below and see how the May month has recovered almost fully to the level a year ago.
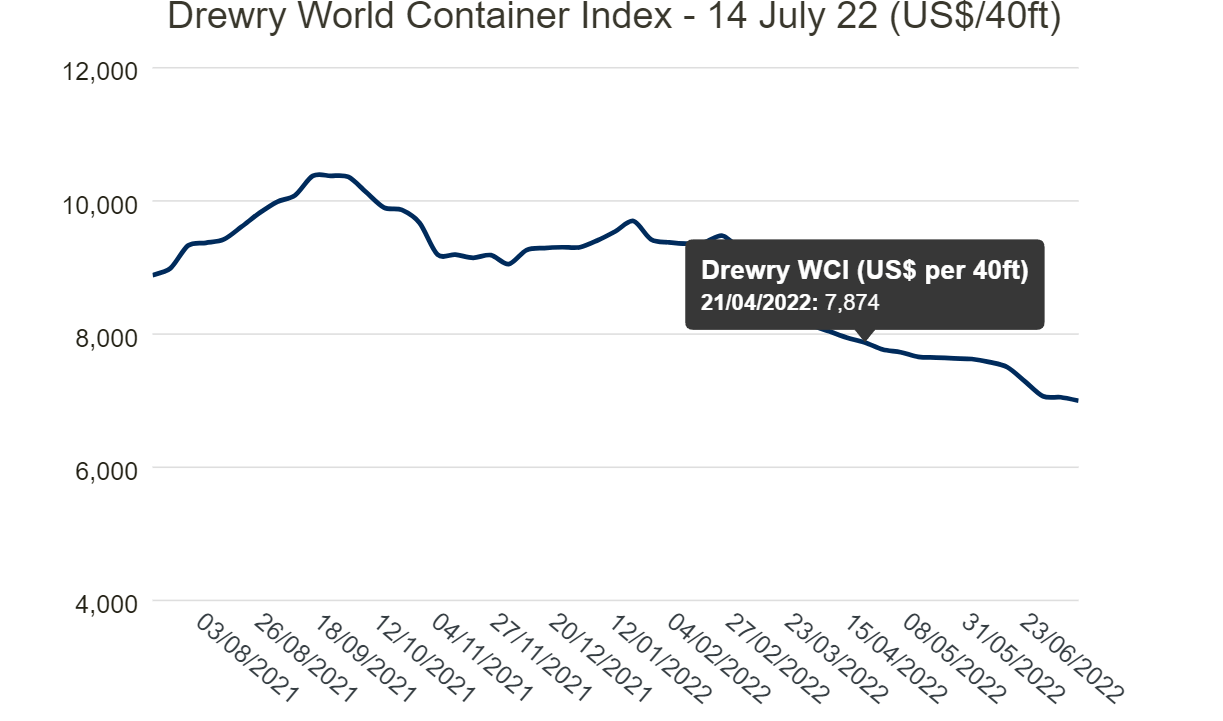
Second, beyond China, there are also signs that the global supply chain congestion is easing. According to Drewry’s data shown in the chart below, the cost peaked above $10k in September 2021 and staged another smaller hike in late 2021. The shipping cost has been keeping declining since then, signaling that the worst has passed. To wit, the composite World Container Index decreased by 0.7% to $6,998 per 40ft container this week. To broaden the view a bit more, when TSLA reported its Q1 earnings back in April, the composite World Container Index stood at $7874. And the current level of $6,998 is about 12% lower.
InsideEVs Drewry’s data 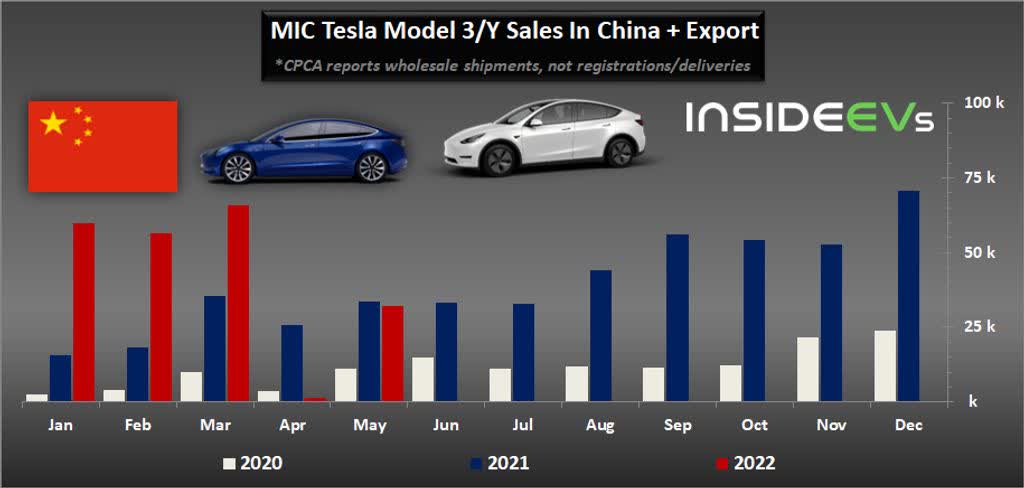
Market kept underestimating TSLA volatility
As aforementioned, even if the above forecasts are correct, the market still could respond to such surprises in either direction. And this is where options may help investors. Buying and holding shares bets on the stock price only. But options give investors an additional knob to control their risks and profits – volatility.
And my view is that the market underestimates TSLA volatility substantially, leading to a mispricing of its options. We will provide detailed numbers in the next section. Here let’s eyeball the data first and see if they pass a common-sense test. As you can see from the chart below, TSLA stock price experienced peak-to-trough fluctuations of 24.6% following the day of its 2021 Q4 ER on Jan 26, then another similarly wide fluctuation of 21.8% on its 2022 Q1 ER on April 20. Besides the earnings surprise, Elon Musk can also find a way to cause large price movements too. His Twitter poll about whether he should reduce his holdings or not in Nov 2021 serves as an example, causing again about 17% price fluctuations in a day.
Such fluctuations are easily 10x more than the average daily fluctuations of QQQ, yet TSLA implied volatility is only about 2x higher than QQQ, as we will see next.
Yahoo Finance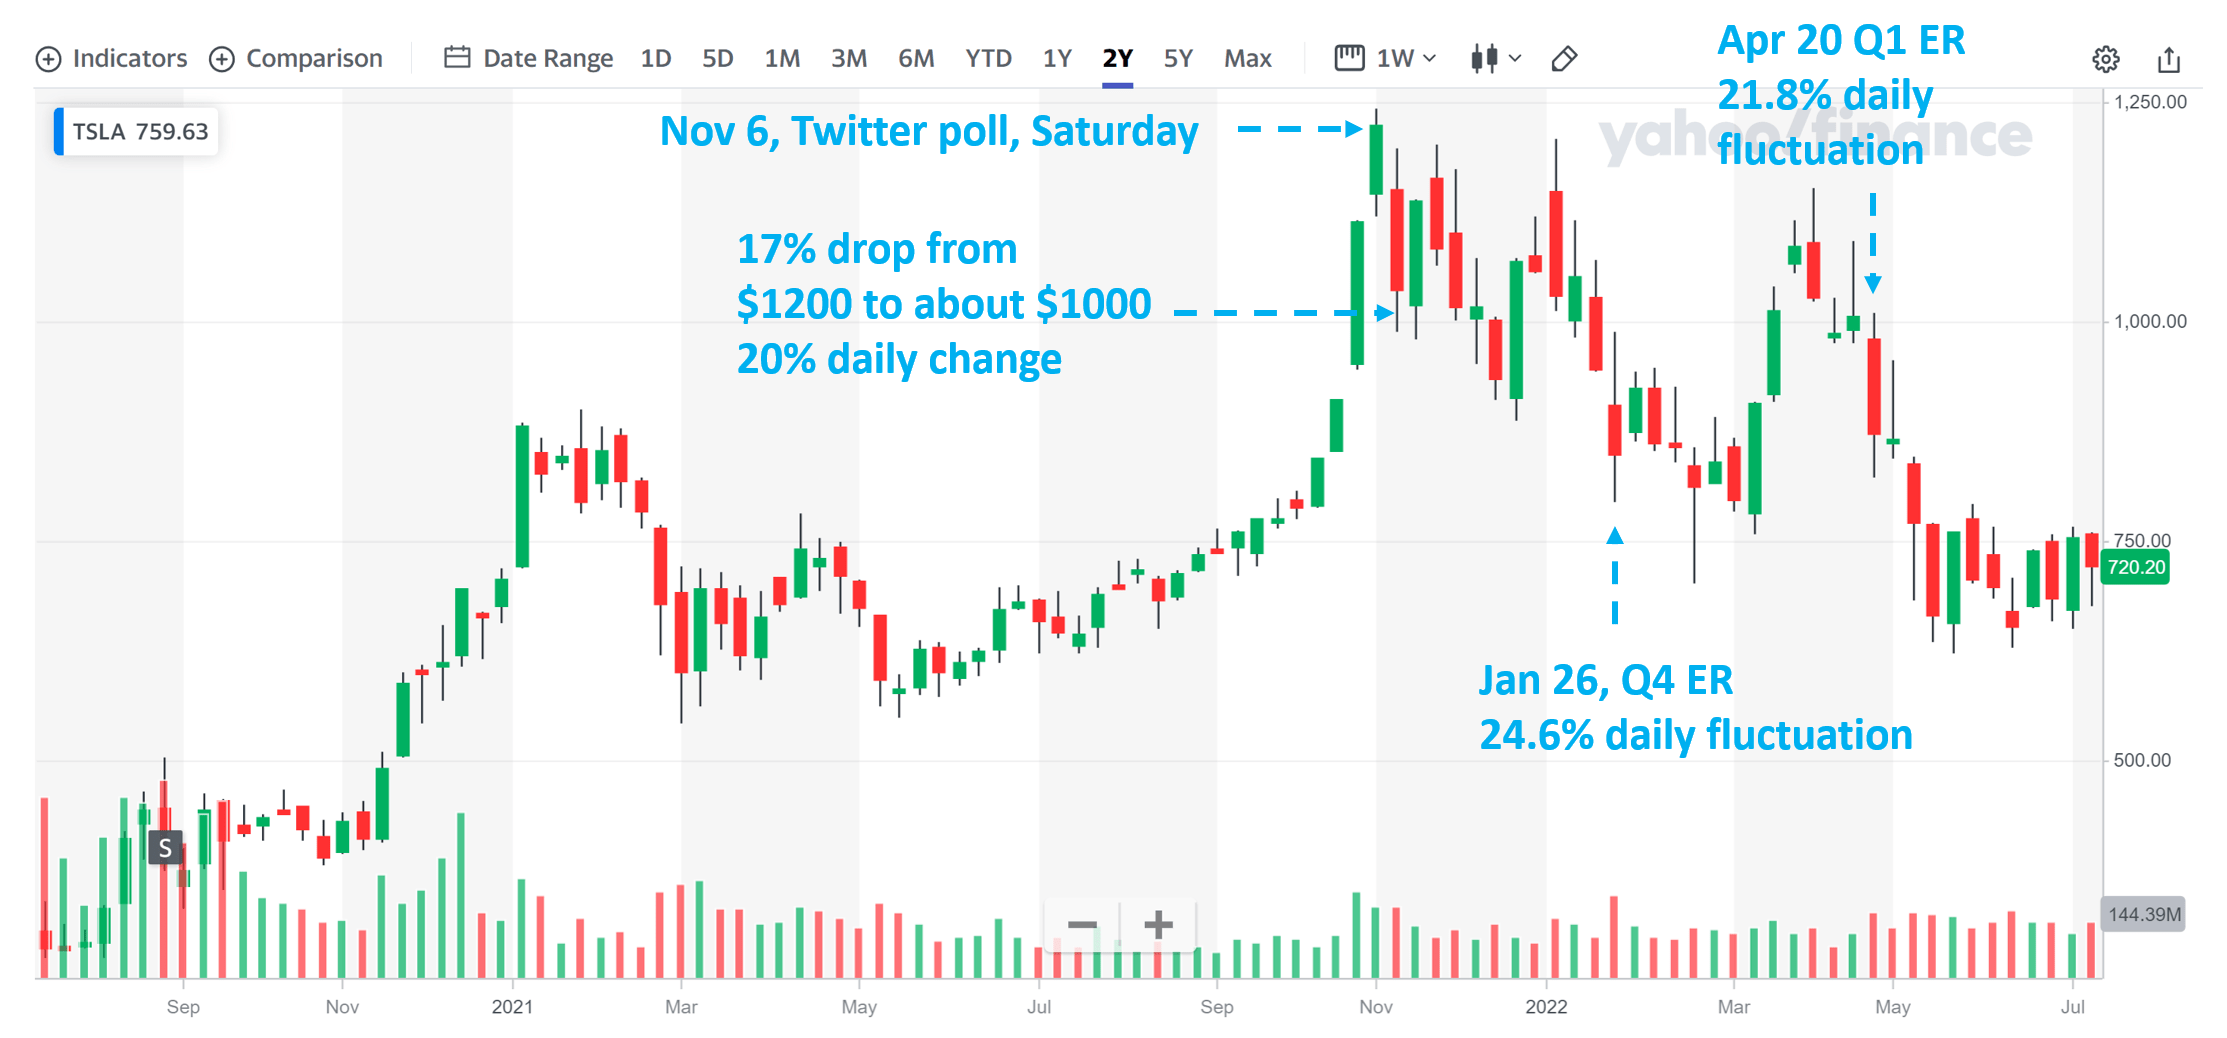
Detailed look at the options
As of this writing, TSLA’s near-the-money options with a $720 strike with an expiry of 1/20/2023 sell between $133 to $125 for calls and puts as you can see from the chart below provided by OIC. You can also see the implied volatility of about ~63%. Again, to me, this is a sizable underestimate.
As of this writing, QQQ’s near-the-money options ($290 strike) with the same expiry sell with an implied volatility of about ~30%. Assuming investors have correctly figured out the implied volatility for QQQ (given its role as a major index), TSLA’s implied volatility is only about 2x higher than QQQ, but its real price fluctuations are much wider, especially during major events like earnings releases as argued above.
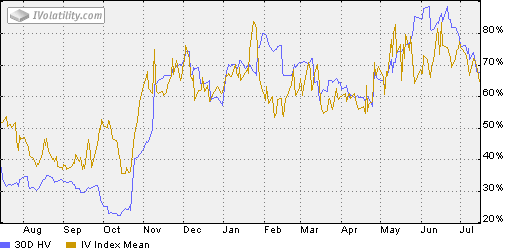
As a matter of fact, TSLA’s implied volatility does not even capture its historical volatility as you can see from the second chart below. Due to the Musk factor alone, I would assume the options market would at least price its implied volatility on par with its historical volatility. Yet, its historical volatilities have surged above 80% several times in the recent past, yet it’s currently priced at an implied volatility of ~60% only.
Source: oic.ivolatility.com Source: oic.ivolatility.com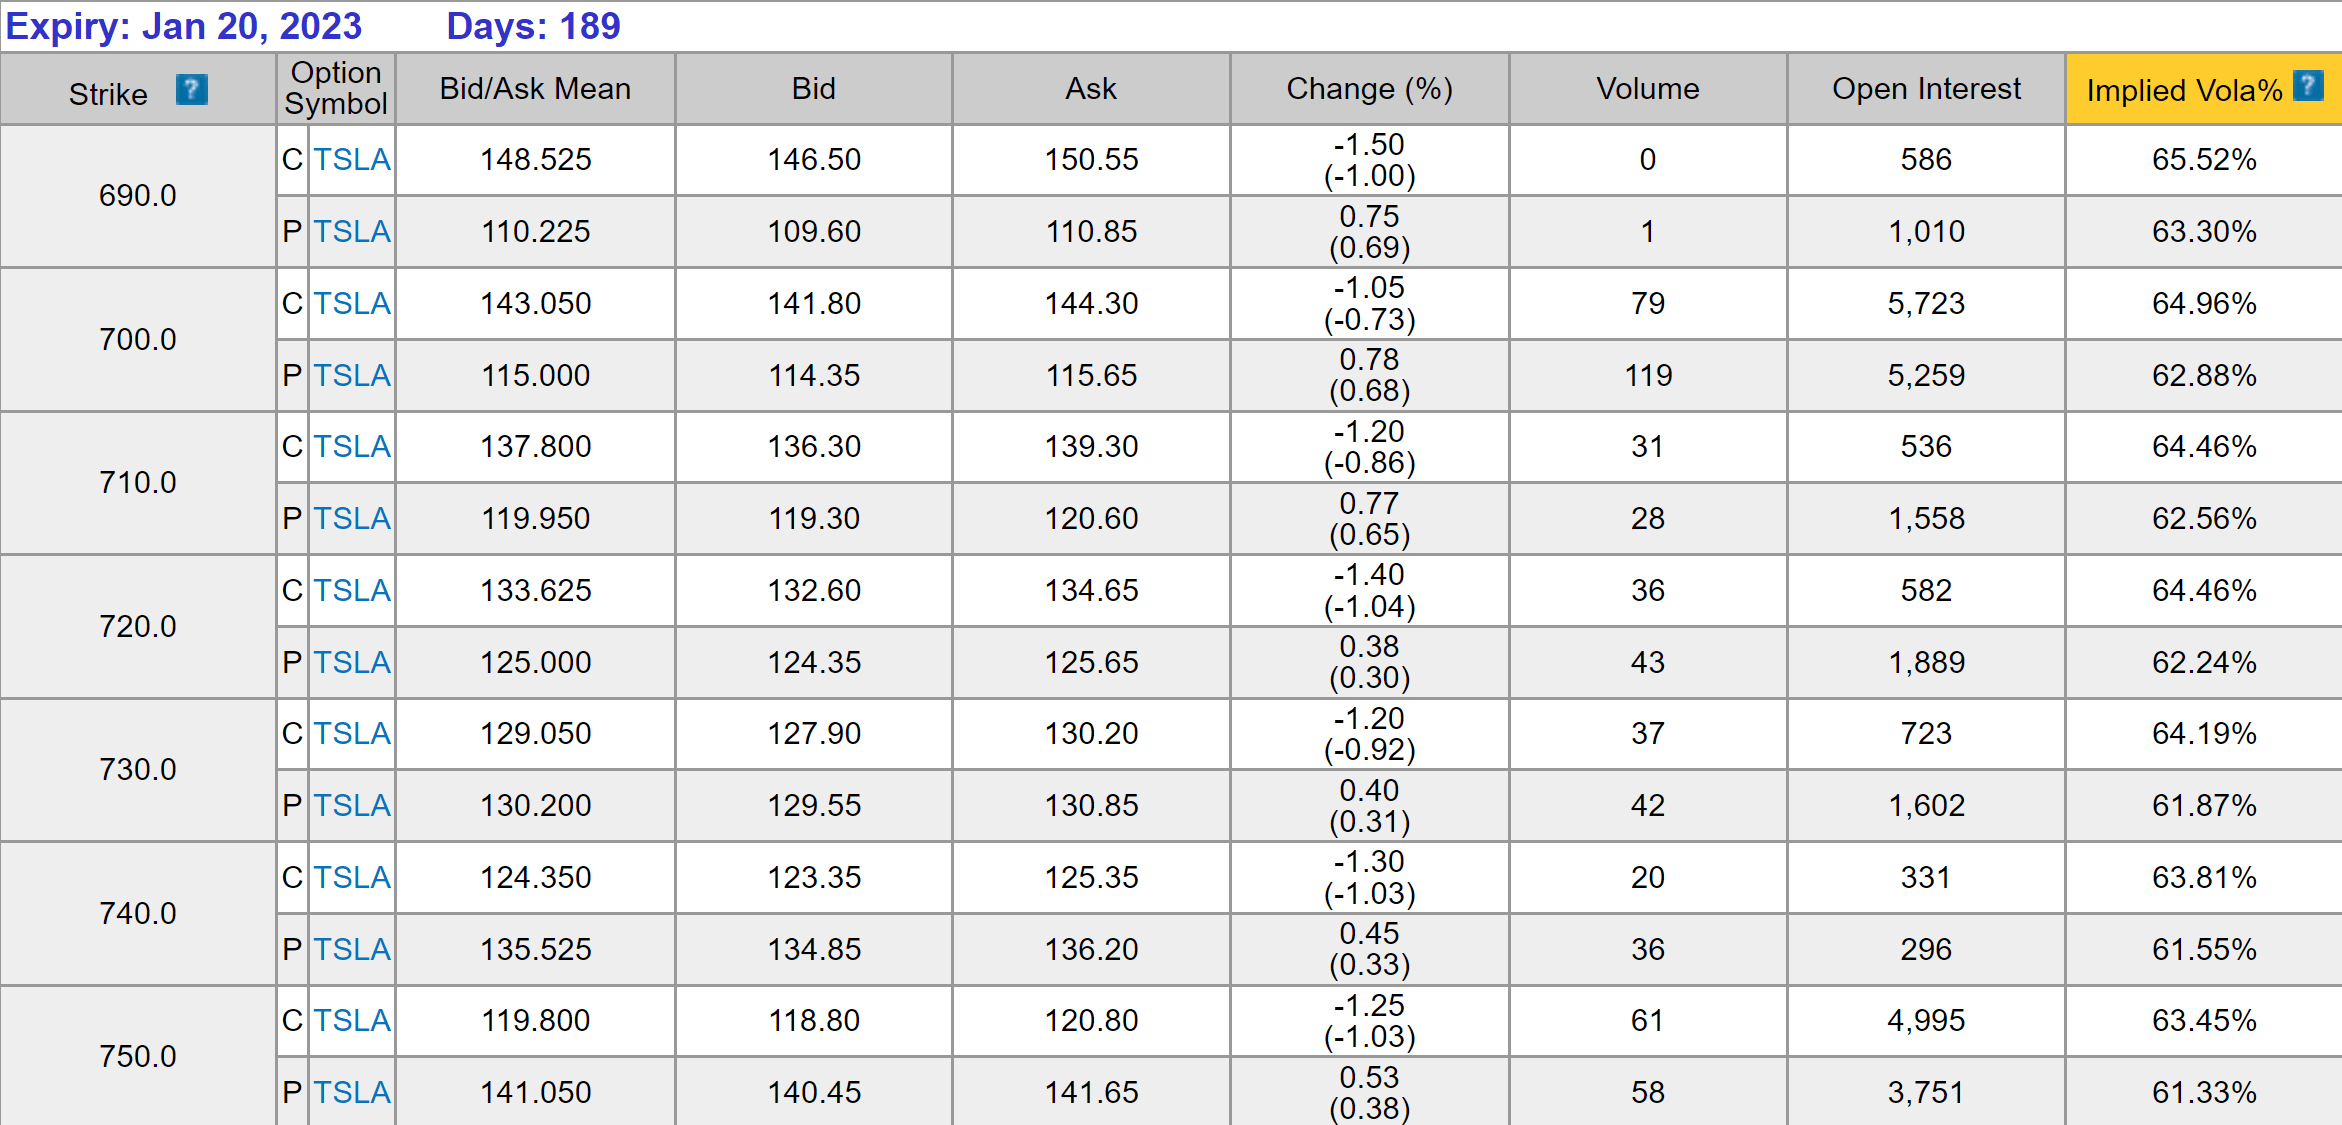
Final thoughts and risks
I see good chances that TSLA can deliver positive surprises during its Q2 earnings report. The main considerations are the recovery on the China front and signs that the global supply chain disruptions are easing. For investors who do not want to bet on the direction of the surprises, but only on the magnitude of the surprises, I see an option play as a viable strategy here given the mispricing of its volatility.
And finally, risks. Given that this article’s focus itself is on the surprises (codeword for uncertainties/risks), I will not ramble about other risks TSLA is facing anymore. I will just emphasize the risks associated with the use of options here. Options (either calls or puts) can limit risks in terms of the absolute dollar amount. But it is riskier in relative terms because it is a leverage play in essence. Actual stock price movements translate into magnified movements in option prices, and you can lose 100%.
Be the first to comment