

Jonathan Kitchen
Alphabet Inc. (NASDAQ:GOOG, NASDAQ:GOOGL) recently reported its Q3 2022 earnings. Currency headwinds, increased headcount, and higher operating costs impacted the company’s revenue growth and profitability.
However, contrary to how the market reacted, Alphabet’s results were decent and reflected the overall weakness of the macroeconomy. While the company is facing short-term headwinds, it is progressing in several key areas, including Google Cloud, YouTube Shorts, and Waymo. Following the company’s sharp selloff post-earnings, I was intrigued to find out what the market had priced in and whether now was an opportunity to build a position in Alphabet. Subsequently, I built a discounted cash flow (“DCF”) model to estimate Alphabet’s intrinsic value today. Please note my valuation estimate is based on a variety of growth assumptions. Subsequently, these may vary from Alphabet’s actual results in the future.
Income Statement
Below is a summary of Alphabet’s historical and projected revenue growth rates (split out by reporting segments) as well as its yearly operating profit and cash flow margins.
Revenue Growth & Margins (OJRB Investment Research)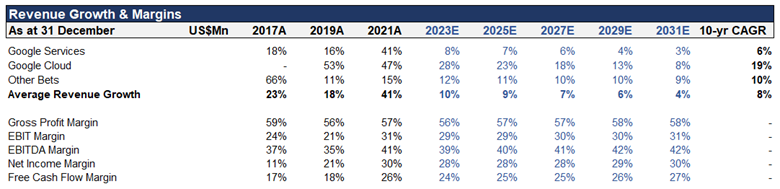
Revenue Assumptions
For Alphabet’s “Google Services,” I have kept revenue growth conservative given that its Search and Network subsidiaries are mature. These businesses were also huge beneficiaries of COVID-19 in 2020/21, hence the recent 30-40% growth rates are unlikely to be sustainable over the next 3-5yrs. Conversely, I expect the growth of “Google Cloud” to remain high, growing at an average of 19% YoY out to 2031. Coming off a low base and operating in a rapidly growing total addressable market (“TAM”), I believe Alphabet’s cloud business has a long growth runway over the next decade.
Margins
I have assumed slightly higher costs and operating expenses in the near term due to: 1.) inflationary pressure – higher input costs and wages; and 2.) high reinvestment as Alphabet continues to scale its Google Cloud and Other Bets Investments. I have broadly increased margins towards the back end of my forecast, with the underlying assumption that operating leverage from these investments (especially Google Cloud) starts filtering through to the bottom line.
Free Cash Flow
Free Cash Flow Calculation (OJRB Investment Research)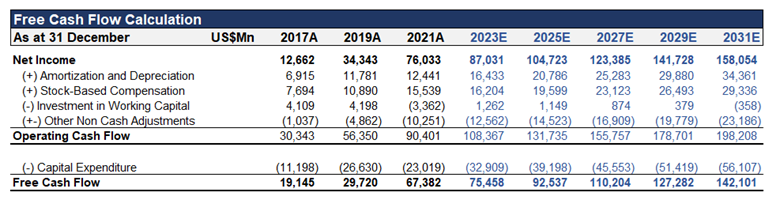
Based on my income statement and balance sheet forecasts, I expect Alphabet to grow its free cash flow (“FCF”) to approximately US$142 billion by 2031 – which reflects an annualized growth rate of 7.75% from its last full year (FY2021). The “Capital Expenditure” line item, includes the purchase of property and equipment and intangible assets. Additionally, I have kept the growth in stock-based compensation (“SBC”) lower than Alphabet’s historical average to ensure my intrinsic value calculation isn’t artificially high.
Discounted Cash Flow Calculations
Below is a summary of my discounted cash flow calculations. In my calculations, I have assumed a 3% terminal growth rate and have incorporated a 10% yearly cost of capital (discount rate).
Discounted Cash Flow (OJRB Investment Research)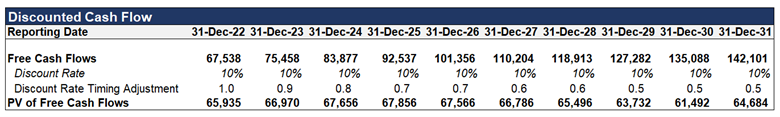
DCF Summary (OJRB Investment Research)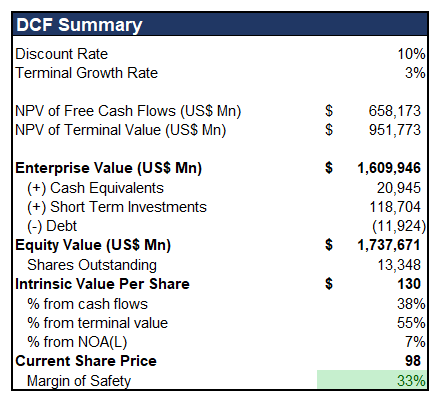
As depicted in the DCF summary table above, I estimate Alphabet’s intrinsic value to be approximately US$130 per share, with a market capitalization of US$1.74 trillion. This implies Alphabet is currently trading at a 33% discount to its fair value.
DFC Sensitivities
Below I have included a “what if” sensitivity table, which provides a universe of valuation outcomes based on changes to my discount rate and terminal value. For example, a 1.5% increase in my discount rate to 11.5%, and a 10% decrease in terminal value would return an expected value per share of approximately US$103.
DCF Sensitivity (OJRB Investment Research)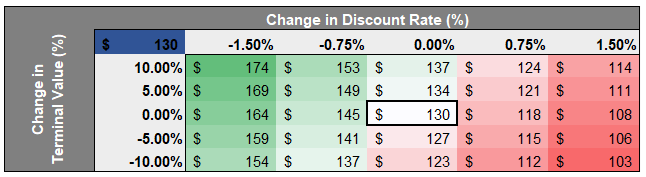
Summary and Closing Thoughts
Based on my calculations, Alphabet looks like a compelling investment opportunity at a market price below US$100 per share. Looking out at the next 6-12 months, however, I expect the share price to continue to face selling pressure, given the slowing macroeconomic environment and cyclical digital advertising sector.
Be the first to comment