


Justin Sullivan
In this article we will examine why there appears to be no end in sight for Tesla’s (NASDAQ:TSLA) share price drop before we move to the technicals to see where the price may be going next and if that will potentially be a bottom.
Tesla stock isn’t having a great run of late touching into the mid $150 region as 2022 trading looks to come to a close.
The Twitter takeover by Tesla CEO Elon Musk has investors nervy about where he is focusing his already tight time schedule and it is reflected in the stock price with my much-coveted Tesla $176 article from April this year now clearly being bypassed for a lower price region.
As competition for the EV market in the US hots up, investors may be swayed to look to other manufactures considered on the rise for a greater portion of the market albeit Tesla clearly remains king with the largest market portion by far.
China also remains an issue with concerns over strict protracted lockdown policies weighing on demand for Tesla vehicles as the new year looms.
We will start the technical analysis by looking into what happened once $176 was achieved and how Tesla very nearly formed a three-wave pattern on the weekly chart suggesting an attempt to breakout higher from that region but as the old saying goes, “nearly didn’t get there”.
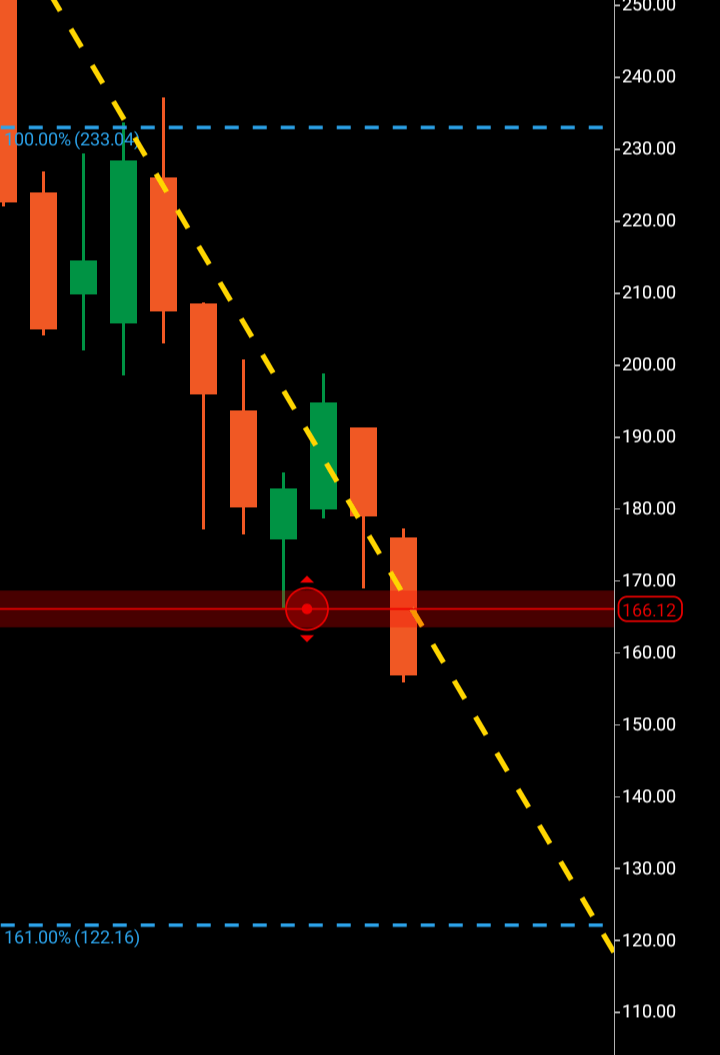
Tesla weekly (C Trader)
We can see above bypassing $176, the stock actually dropped a further ten dollars to $166 before forming two bullish candles from that low which topped out circa $200, additionally a bearish rejection candle was then formed with the following opening week to make its decision, break above $200 or break below $166, the latter was clearly chosen.
So where could this share price be headed next? Now we will move to the monthly chart and delve into the bearish wave structure that has yet to complete.
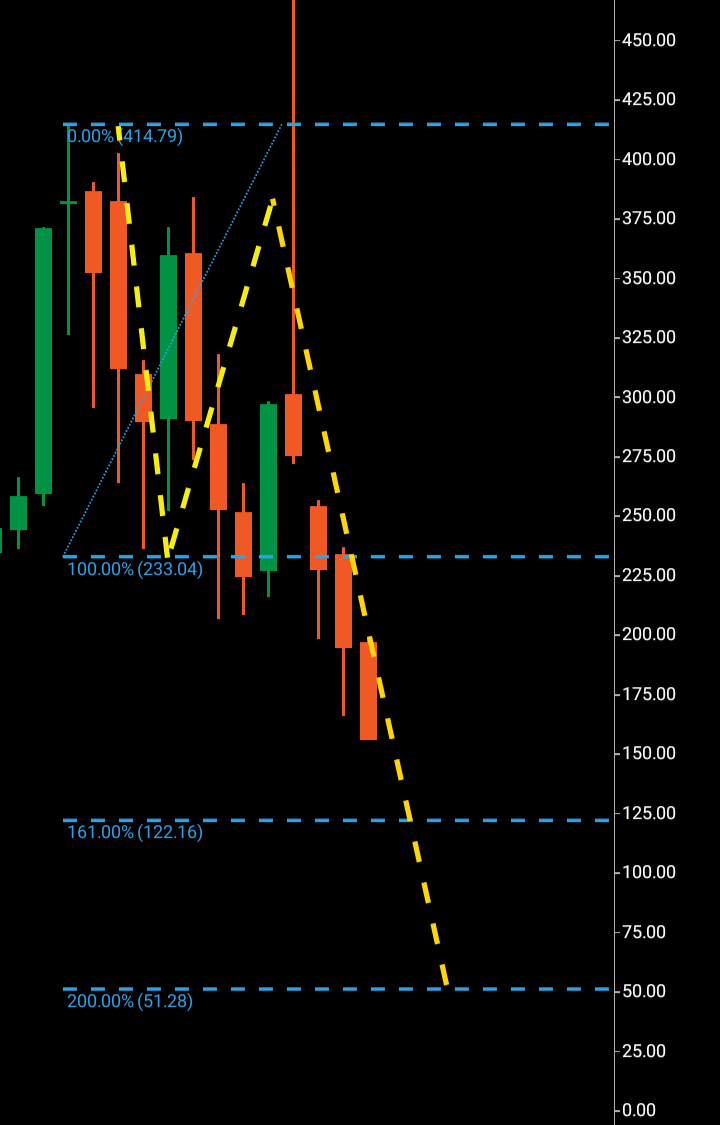
Tesla current monthly chart (C Trader)
We can see the wave one $414 to $233 with the wave two making its way from that price region to circa $390.
The wave three then becomes confirmed with the drop from circa $390 to below the $233 support.
We can see Tesla currently surging it’s way south towards the next technical stop of $122. This is the Fibonacci 161 from the three-wave structure and in bearish cases, equities have been known to turn around at this level, this is one scenario should Tesla arrive at that price region.
The second scenario is that there is no bullish pattern formed if Tesla does get there and looks to then head towards a numerical copy of the wave one and land at $51.
To finalize I would expect Tesla to firstly arrive at $122 within the next 30-90 days where I will be looking for turn around signals by way of a three-wave pattern if this equity reaches that price area. Should no bullish pattern emerge a significant drop it will be for Tesla as all eyes turn to the $50 region.
About the Three Wave Theory
The three-wave theory was designed to be able to identify exact probable price action of a financial instrument. A financial market cannot navigate it’s way significantly higher or lower without making waves. Waves are essentially a mismatch between buyers and sellers and print a picture of a probable direction and target for a financial instrument. When waves one and two have been formed, it is the point of higher high/lower low that gives the technical indication of the future direction. A wave one will continue from a low to a high point before it finds significant enough rejection to then form the wave two. When a third wave breaks into a higher high/lower low the only probable numerical target bearing available on a financial chart is the equivalent of the wave one low to high point. It is highly probable that the wave three will look to numerically replicate wave one before it makes its future directional decision. It may continue past its third wave target but it is only the wave one evidence that a price was able to continue before rejection that is available to look to as a probable target for a third wave.
Be the first to comment