

Pgiam/iStock via Getty Images
Investment strategy
Market prices are being forecast every day by self-protective, disruptive actions taken by Market Makers negotiating big-volume block trades for institutional investors managing their billion-dollar equity investment portfolios.
Records of market outcomes following such daily forecasts make their trends visually followable and their rewards and risk exposures explicit in graphic form. The pictures are the outcomes, not some hoped-for tools to guess at what may happen later. While there are no guarantees of the future, examples in hand are far better than hypotheses of assertion without evidence.
Moreover, the outcomes follow identical strategy disciplines for all stocks, making expectations of forecasts directly comparable. In that way, personal preferences can be carefully followed.
The primary stock of interest in this article is Tesla, Inc. (TSLA).
Company description
“Tesla, Inc. designs, develops, manufactures, leases, and sells electric vehicles, and energy generation and storage systems in the United States, China, and internationally. The company operates in two segments, Automotive, and Energy Generation and Storage. The Automotive segment offers electric vehicles, as well as sells automotive regulatory credits. It provides sedans and sport utility vehicles through direct and used vehicle sales, a network of Tesla Superchargers, and in-app upgrades; and purchase financing and leasing services. The Energy Generation and Storage segment engages in the design, manufacture, installation, sale, and leasing of solar energy generation and energy storage products, and related services to residential, commercial, and industrial customers and utilities through its website, stores, and galleries, as well as through a network of channel partners. The company was formerly known as Tesla Motors, Inc. and changed its name to Tesla, Inc. in February 2017. Tesla, Inc. was incorporated in 2003 and is headquartered in Austin, Texas.”
Source: Yahoo Finance
Yahoo Finance
We start with comparisons of reward prospects and risk exposures
Figure 1
blockdesk.com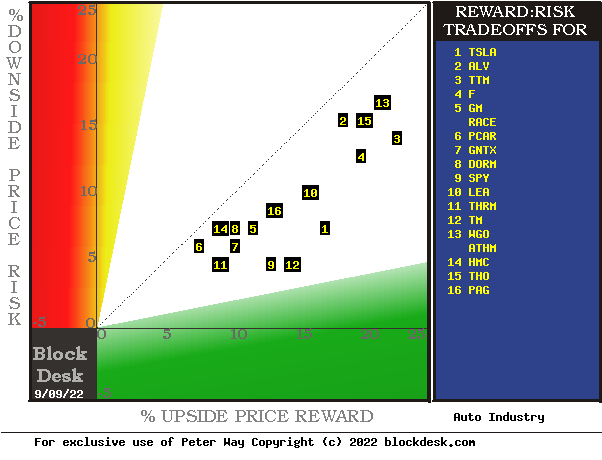
(used with permission)
Expected rewards for these securities are the greatest gains from the current closing market price seen worth protecting short positions. Their measure is on the horizontal green scale.
The risk dimension is of actual price drawdowns at their most extreme point while being held in previous pursuit of upside rewards similar to the ones currently being seen. They are measured on the red vertical scale.
Both scales are of percent change from zero to 25%. Any stock or ETF whose present risk exposure exceeds its reward prospect will be above the dotted diagonal line. Capital-gain attractive to-buy issues are in the directions down and to the right.
Our principal interest is in TSLA at location [1], midway between [12] and [4]. A “market index” norm of reward-risk tradeoffs is offered by SPY at [9]. The most appealing (to own) by this Figure 1 view is TM at location [12] but further examination will show why this may not be so.
Comparing features of alternative investment stocks
The Figure 1 map provides a good visual comparison of the two most important aspects of every equity investment in the short term. There are other aspects of comparison which this map sometimes does not communicate well, particularly when general market perspectives like those of SPY are involved. Where questions of “how likely” are present in other comparative tables, like Figure 2, may be useful.
Yellow highlighting of the table’s cells emphasizes factors important to securities valuations and the security TSLA, most promising of near capital gain as ranked in column [R]. Red cell fills indicate inadequate proportions of essential performance competitive requirements, as in [H], [L-N] and [T].
Figure 2
blockdesk.com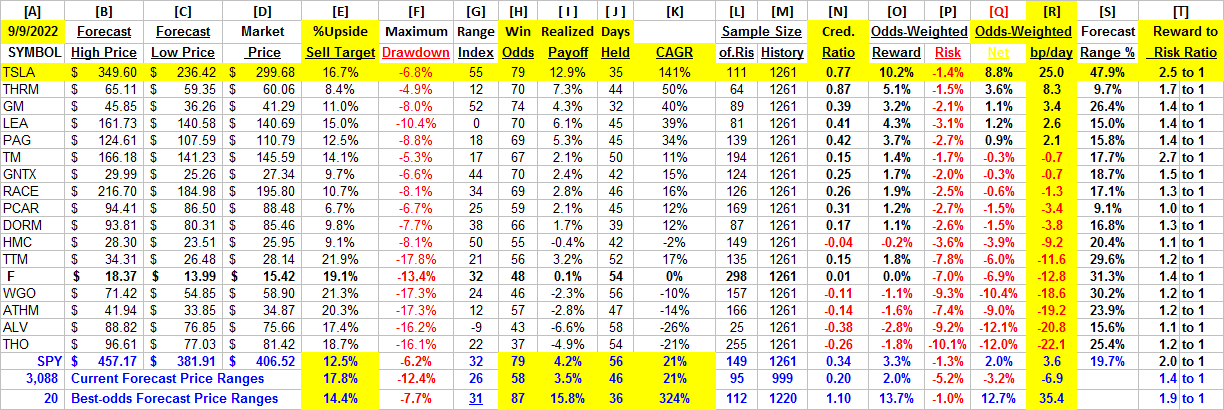
The price ranges implied by the day’s transactions activity are in columns [B] and [C], typically surrounding the day’s closing price [D]. They produce a measure of risk and reward we label the Range Index [G], the percentage of the B to C forecast range which lies between D and C.
Today’s Gs are used for each stock’s past 5-years of daily forecast history [M] to count and average prior [L] experiences. Fewer than 20 of Gs or a shorter history of Ms are regarded as statistically inadequate.
[H] tells what percentage of the L positions were completed profitably, either at range-top prices or by market close above day after forecast close price entry costs. The Net realization of all Ls is shown in [I].
[I] fractions get weighted by H and 100-H in [O, P, & Q] appropriately conditioned by [J] to provide investment ranking [R] in compound annual growth rates [CAGR] units of basis points per day.
Additional market perspective is provided by the 3,000+ securities for which price range forecasts are available. They currently suggest that while market recovery is underway, it is still far from generally attractive.
On the other hand, R column scores for TSLA and the top 20 forecast population support the primary candidate’s competitive capability. Toyota’s (TM) prospects fall far short of the leader, TSLA.
Recent trends of price range forecasts for TSLA
Figure 3
blockdesk.com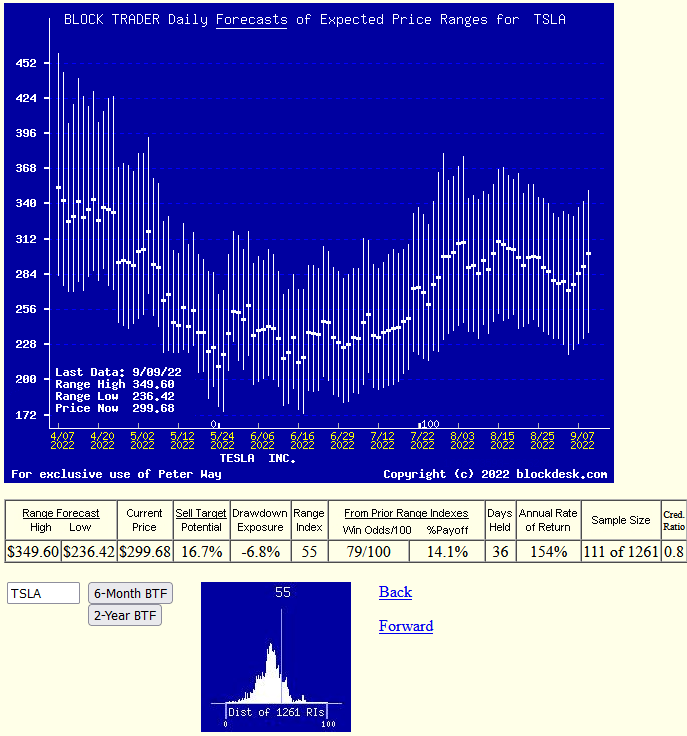
(used with permission)
This is NOT a typical “technical analysis chart” of simple historical (only) observations. Instead, it pictures the daily updated Market-Maker price range forecasts implied by live real-capital commitments in real time, adjusted for the recent stock split.
Its communicative value is present here by visual comparisons at each forecast date of the proportions of upside and downside price change expectations by the market-making community, as influenced by the actions of an interested and involved big-$ institutional investing community.
Those forecasts are typically resolved in time horizons of less than a half year, and often in two months or shorter. This one states that of the 111 prior forecasts like today’s, nearly 80 of every 100 were profitable, completed in 36 market-days (7 weeks) profitably at average +18% gains, a CAGR rate of 154%. No promises, just fun with history.
Conclusion
Comparison of the performances of near-term Market-Maker forecasts for Tesla, Inc. with similar forecasts of other technologically-active securities pursued by investor referencing, it seems clear that this stock can be an attractive investment choice for investors pursuing near-term capital gain strategies.
Be the first to comment