

jozzeppe/iStock via Getty Images
In this modern era where the economy is globalized, and a large population is constantly on the move, it’s important to make sure that the environment you are in is clean. And by clean, I mean truly sanitized. The COVID-19 pandemic made this point unbelievably clear. Well, one company that does focus on providing products and other solutions aimed at ensuring cleanliness is Tennant Company (NYSE:TNC). Despite experiencing some pain because of the COVID-19 pandemic, the company has shown signs of a nice rebound. However, the most recent financial performance covering the 2022 fiscal year of the business has hurt shareholders to some degree. But even if management’s forecasts for the year turn out to be accurate, shares look attractively priced at this time, both on an absolute basis and relative to similar firms. Due to these factors, I’ve decided to rate the company a solid ‘buy’ for now, reflecting my belief that the company’s shares are likely to outperform the broader market moving forward.
A niche business
According to the management team at Tennant Company, the company’s emphasis is on providing and servicing products that are used primarily in the maintenance of non-residential services. This sounds rather vague, so we should dig into it a bit deeper. Management describes the products and solutions they offer as mechanized cleaning equipment that are used for both industrial and commercial use. They also offer detergent-free and other sustainable cleaning technologies, aftermarket parts and consumables, equipment maintenance services, and repair services. Business solutions like financing, rental and leasing programs, and even machine-to-machine asset management solutions, are all offered too.
The company’s portfolio of offerings can be used in a variety of environments, such as retail establishments, distribution centers, factories and warehouses, public venues, office buildings, schools, hospitals, and so much more. These products are commonly sold under brand names like Tennant, Nobles, IRIS, IPC, and others. The significant portfolio of products the company has, and the various use cases have allowed its customer base to grow to more than 40,000 globally, with customers spread all across the globe. That doesn’t change the fact, however, that in the 2021 fiscal year, 60.4% of the company’s revenue came from the Americas. 30.4% was attributable to Europe, the Middle East, and Africa, all combined. And the remaining 9.2% can be chalked up to the Asia Pacific region. What’s really great about the company is that it does seem to have a large portion of its revenue attributable to activities that should be recurring in nature. Parts and consumables sales, for instance, accounted for 22.9% of overall revenue last year. Specialty surface coatings comprised a further 0.1%, while services and other miscellaneous activities were responsible for 14.7% of sales.
Author – SEC EDGAR Data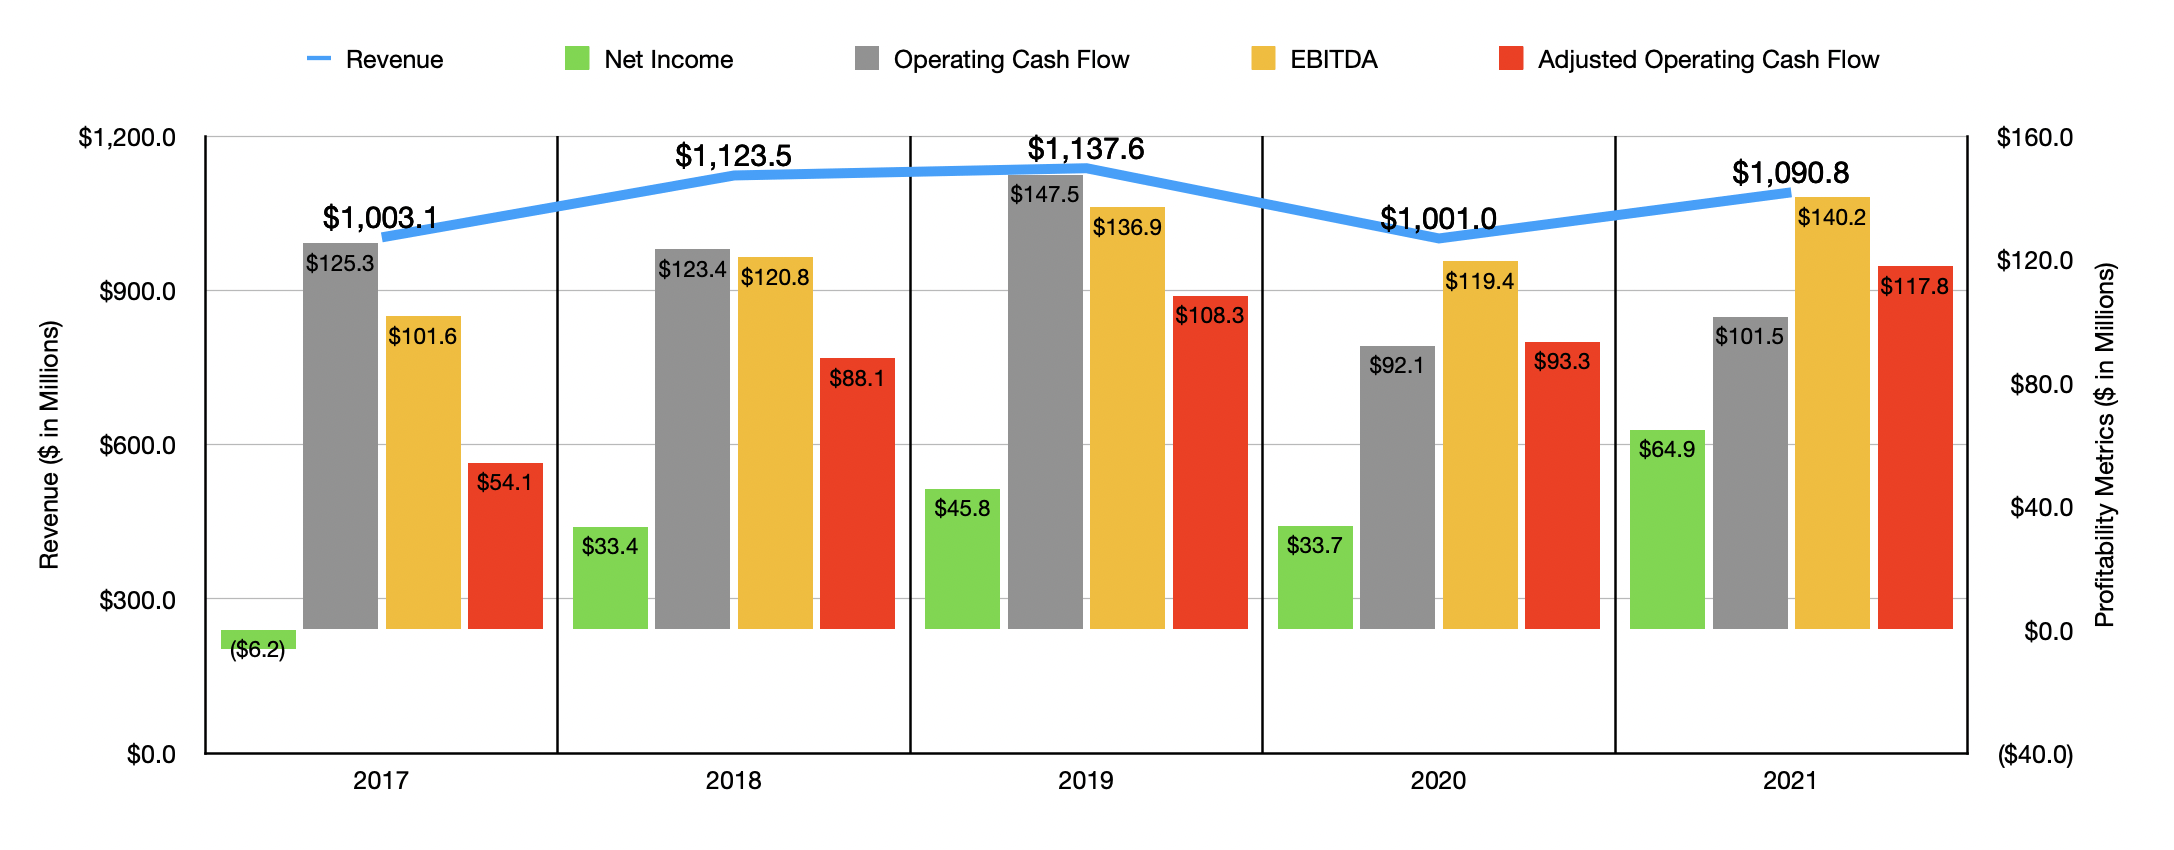
In the years leading up to the COVID-19 pandemic, Tennant Company did a solid job growing its top line. Revenue rose from $1 billion in 2017 to $1.14 billion in 2019. The COVID-19 pandemic pushed revenue down to $1 billion again in the 2020 fiscal year. But this decline was short-lived, with sales climbing to $1.09 billion in 2021. Profitability has followed a similar trajectory. For instance, the company went from generating a net loss of $6.2 million in 2017 to generating a profit of $45.8 million in 2019. The profit was slightly lower at $33.7 million in 2020. But in 2021, profits shot up to $64.9 million. Other profitability metrics have followed a similar trajectory. After seeing operating cash flow peak at $147.5 million in 2019, it plummeted to $92.1 million in 2020 before recovering slightly to $101.5 million last year. If we were to adjust for changes in working capital, however, the 2021 fiscal year would be the all-time high for the business, with the metric totaling $117.8 million. This compares to the $93.3 million seen in 2020 and the $108.3 million seen in 2019. Meanwhile, the EBITDA of the business has also steadily risen over the years. In 2017, it was just $101.6 million. By 2021, it hit an all-time high of $140.2 million.
Author – SEC EDGAR Data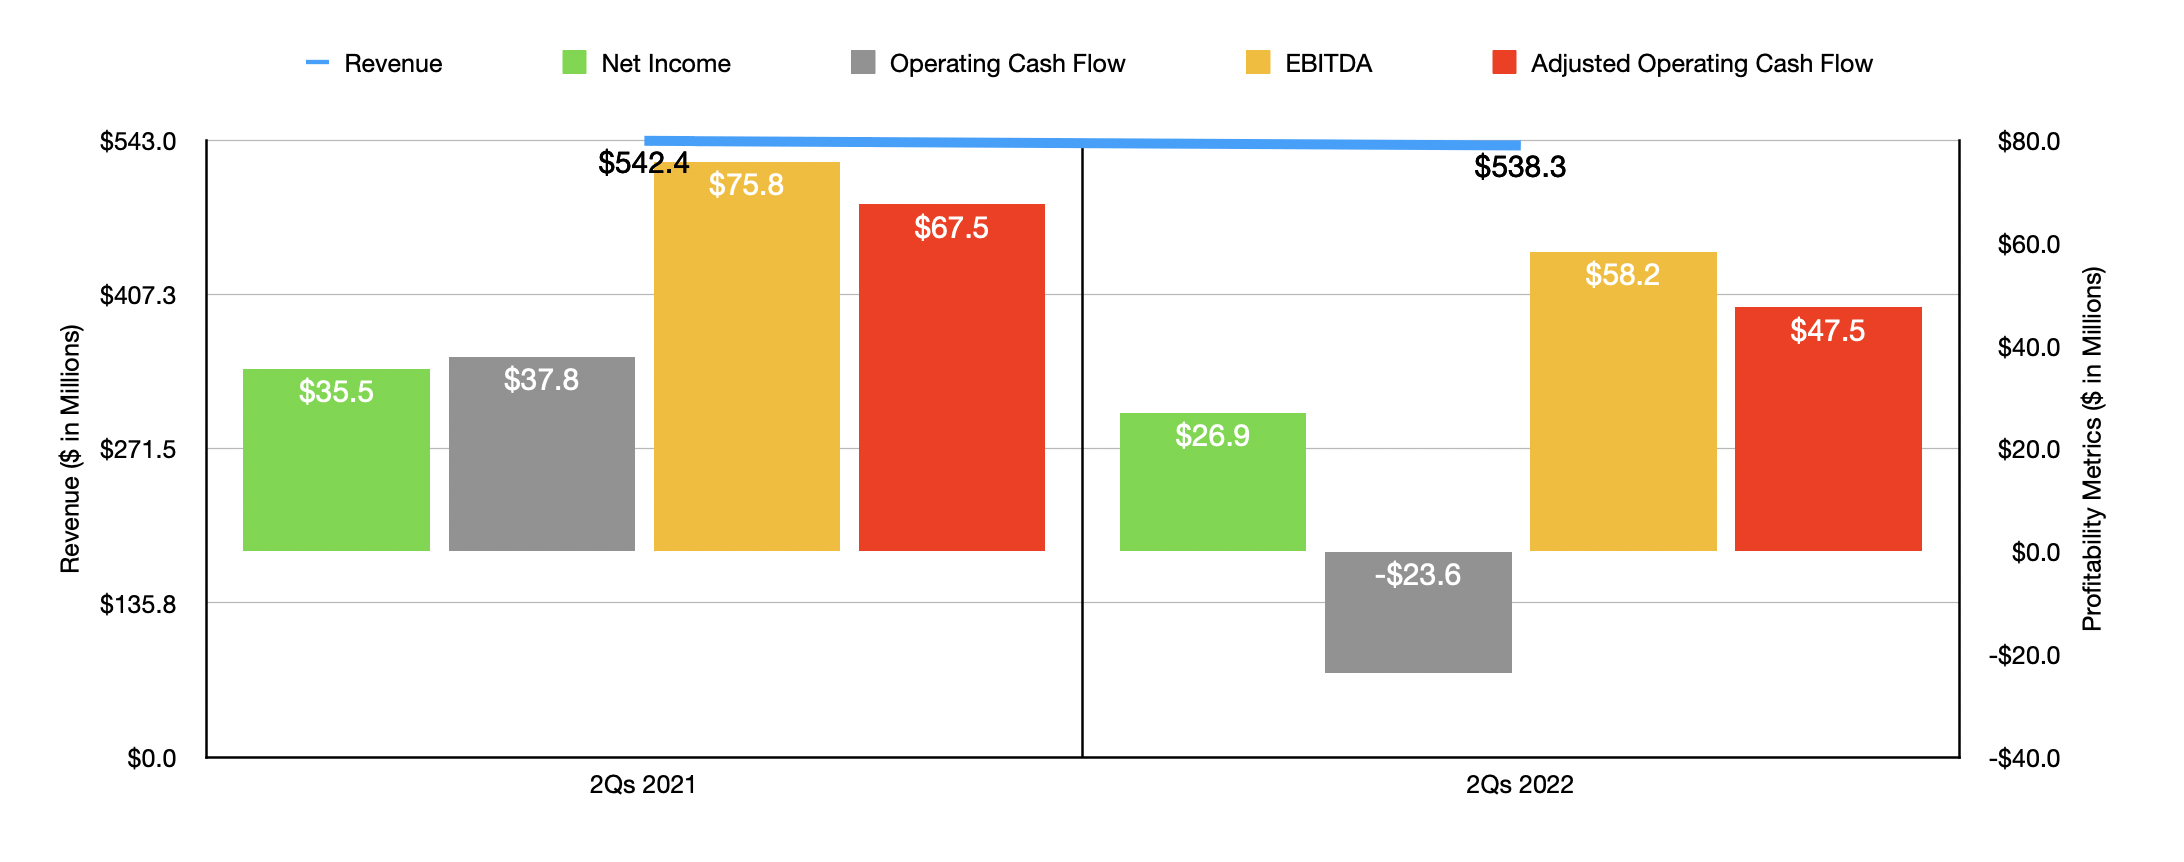
When it comes to the 2022 fiscal year, financial performance has been somewhat mixed. For the first half of the year as a whole, revenue of $538.3 million came in slightly below the $542.4 million reported the same time one year earlier. But in the second quarter of the year alone, sales of $280.2 million were slightly above the $279.1 million reported one year earlier. While the picture for revenue is fairly consistent, profitability has been all over the map. For the first half of 2022, the company generated a net profit of $26.9 million. This was down from the $35.5 million experienced the same time last year. Operating cash flow went from $37.8 million to negative $23.6 million. If we adjust for changes in working capital, it would have plunged by $20 million from $67.5 million to $47.5 million. Meanwhile, EBITDA for the company also deteriorated, dropping from $75.8 million to $58.2 million.
Author – SEC EDGAR Data
Despite these troubles, management has some pretty high hopes for the current fiscal year. They are anticipating revenue of between $1.125 billion and $1.17 billion. At the midpoint, that would translate to a year-over-year increase of 5.3%. This should be driven by organic revenue growth of between 6% and 10%. Earnings per share should be between $3.65 and $4.25. At the midpoint, that would translate to net income of $73.8 million. Meanwhile, EBITDA should come in at between $140 million and $155 million. That would represent a new all-time high for the business. No guidance was given when it came to operating cash flow. But if we assume that it should increase at the same rate that EBITDA should, then we should anticipate a reading this year of roughly $123.9 million.
Author – SEC EDGAR Data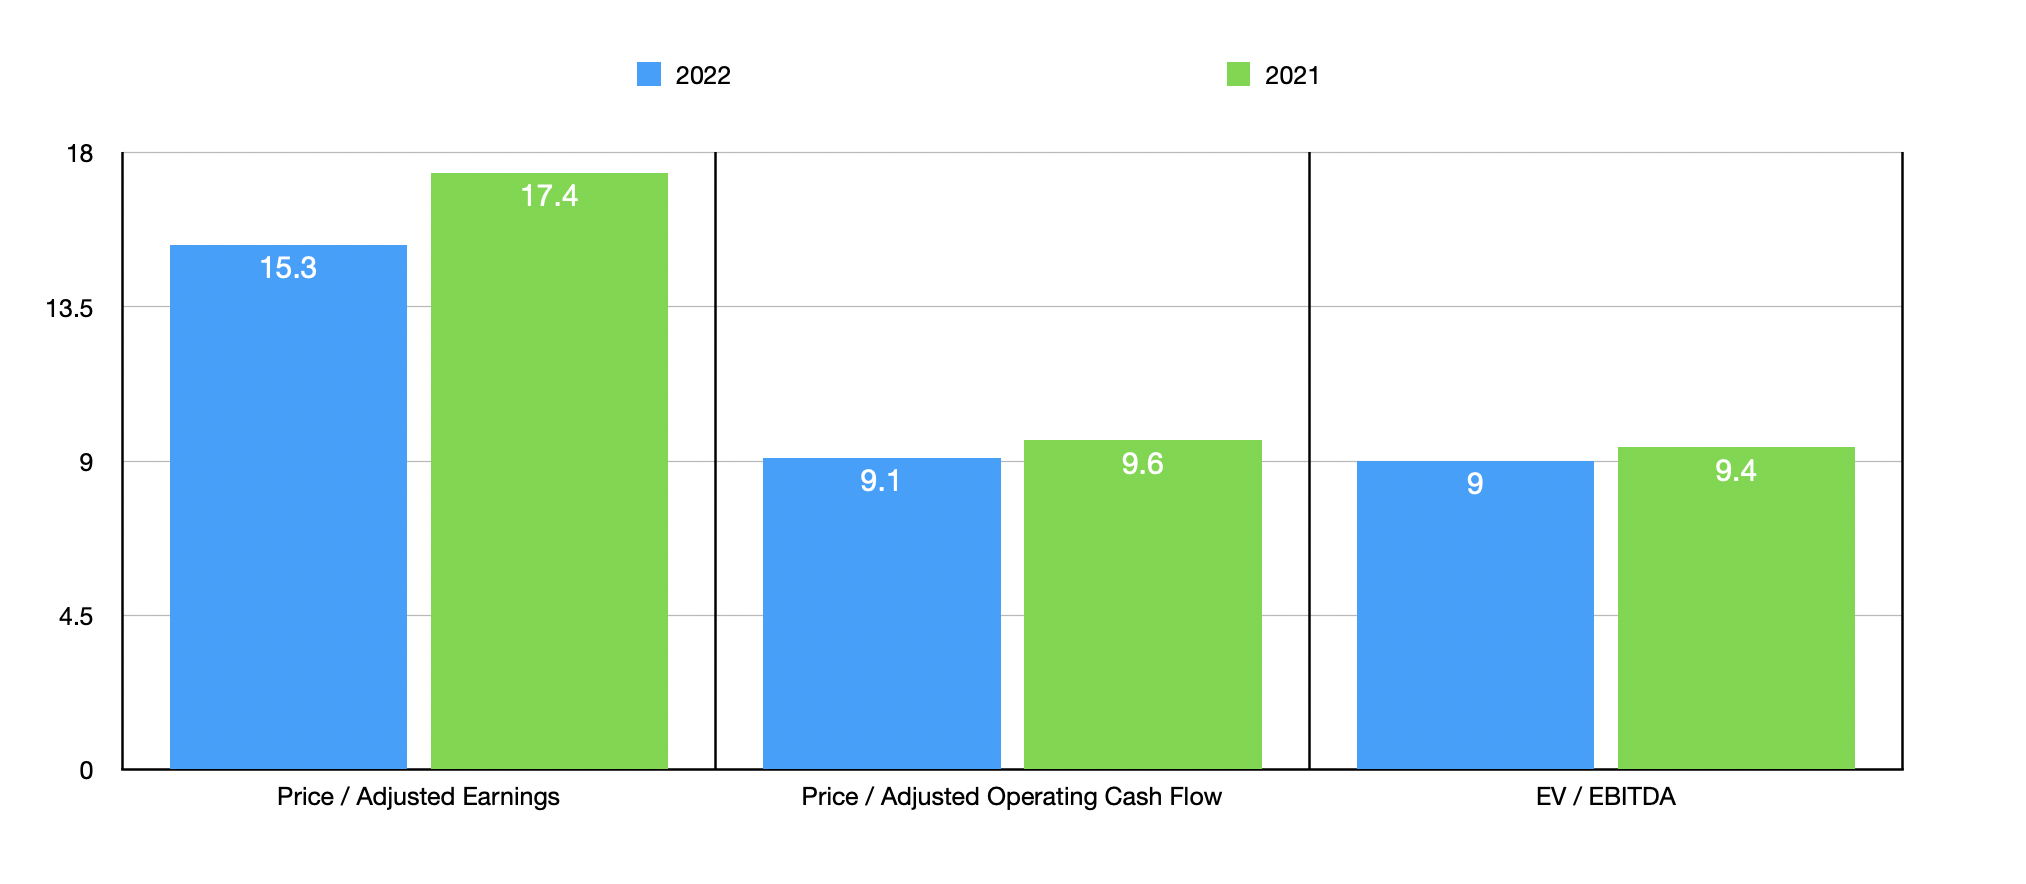
Given these numbers, the company is trading at a forward price to earnings multiple of 15.3. That’s down from the 17.4 reading that we would get using data from 2021. The price to adjusted operating cash flow multiple is 9.1. That’s down from the 9.6 that we get using data from last year. Meanwhile, the EV to EBITDA multiple should come in at 9 even. That stacks up against the 9.4 figure that we get using last year’s results. As part of my analysis, I also compared the company to five similar firms. On a price-to-earnings basis, these companies ranged from a low of 16.2 to a high of 116.3. Using the price to operating cash flow approach, the range was from 12.9 to 149.5. And using the EV to EBITDA approach, the range was between 9.1 and 68.3. In all three scenarios, Tennant Company was the cheapest of the group.
| Company | Price / Earnings | Price / Operating Cash Flow | EV / EBITDA |
| Tennant Company | 15.3 | 9.1 | 9.0 |
| Columbus McKinnon (CMCO) | 18.3 | 18.3 | 9.7 |
| Proto Labs (PRLB) | 42.8 | 15.8 | 12.4 |
| Emerson Tool Group (EPAC) | 91.5 | 28.9 | 22.2 |
| Standex International (SXI) | 16.2 | 12.9 | 9.1 |
| Energy Recovery (ERII) | 116.3 | 149.5 | 68.3 |
Takeaway
All the data right now suggests to me that the financial performance of Tennant Company is mixed and is likely to stay that way for the foreseeable future. From an earnings perspective, shares are definitely not undervalued. But compared to cash flow and EBITDA, the company seems to be a solid prospect. Add on top of this the fact that it is cheaper than the peer group that I looked at, and I see no reason why it shouldn’t be rated a solid ‘buy’ right now.
Be the first to comment