

Michael Vi
Introduction
My thesis is that Tencent (OTCPK:TCEHY) should improve communication with investors by doing a better job of summarizing developments with their listed investments and their operating segments. Berkshire Hathaway (BRK.A) (BRK.B) is a good role model in this regard with the annual letters and quarterly 13F filings. I like the way Berkshire CEO Buffett talks about the biggest investments in the annual letters to shareholders. It is also nice that Berkshire shows the investments in quarterly 13F filings. This type of communication is even more important at Tencent where they do special dividends like the recent distribution of JD (JD) shares.
The government in China has been forcing changes on internet platforms so companies have to be careful about the type of communication they have with investors. A July 12th Bloomberg article by @luluyilun talks about the fact that Chairman Pony Ma has been able to hang on to his position while peers have stepped down:
So far, Ma has avoided a fate that befell many of his peers. Jack Ma, the founder of Alibaba Group Holding Ltd., relinquished his corporate duties in 2019 and has essentially gone into hiding. He was joined by the heads of Pinduoduo Inc. and JD.com Inc., the two biggest online shopping companies in China after Alibaba. The chief executive officers of TikTok’s parent company and its main rival each stepped down last year.
Given these considerations, investors should not expect Chairman Ma to provide more information in his Chairman’s statements in the annual reports. However, there are other people in the company who should step up and help give investors a clearer picture of Tencent on a summary level – perhaps VP James Mitchell on the investment side.
At the time of this writing, 100 RMB is about $15.
JD Investment
The 2021 annual report says Tencent used to hold about 529 million shares of JD which represented about 17% of outstanding shares and had a valuation of about RMB 118.5 billion. Seeing as the cost of this investment was only RMB 20.9 billion, things worked out extremely well for Tencent. The annual report goes on to say that Tencent’s ownership of JD was expected to be reduced from 17% to 2.3% once a distribution to Tencent shareholders was complete. The Chairman’s statement in the annual report says the number of class A shares in the distribution were approximately 457 million. In the 1Q22 call, VP James Mitchell said the amount of JD that was distributed directly to Tencent shareholders came out to about $16 billion at the time.
Investors shouldn’t have to piece together various parts of the annual report and the 1Q22 earnings call to get a full picture of the JD distribution. Instead, management should summarize the key points in a brief letter.
Overall Investments
As WeChat was getting off the ground, Chairman Ma worked with competitors and invested in them. The above Bloomberg article from July 12th talks about these early days:
Also around this time, Ma made a crucial decision to open up Tencent’s software platforms and resources to outside developers. He suggested Tencent should become almost like a utility, a part of the internet’s infrastructure. He chose to invest in, instead of compete with, startups – some 800 in total. Tencent handed over its search engine to a rival, Sogou Inc., in return for a stake. Over the next decade, WeChat transformed into the digital equivalent of electricity or water.
The experience and insight that Tencent has from many years of investing is remarkable. I wish managers like VP Mitchell could summarize the past and present investments in a format that is less scattered.
Listed investments dropped RMB 376.8 billion from RMB 982.8 billion in 4Q21 to RMB 606 billion in 1Q22 as stock quotes of these listed investments fell. Again, per the March 25th special dividend filing and other documents, we know RMB 102,451 million was distributed to shareholders in 1Q22 from the sale of JD shares. As such, we expected the value of listed investments to be RMB 102.5 billion lower from 4Q21 to 1Q22. The bigger issue seems to be that price quotes of listed investments fell dramatically from the end of December to the end of March. However, management doesn’t do a good job describing the various components of this fall.
The loss in value of listed investments over multiple quarters is substantial, falling from RMB 1,446 billion in 2Q21 to RMB 606 billion in 1Q22. Using an exchange rate of RMB 100 for $15, it is mind boggling that Tencent’s listed investments fell from $217 billion in 2Q21 down to $91 billion in 1Q22; that’s a difference of $126 billion. We need to be able to hit the side of a barn in terms of the breakdown between selling investments like JD stock and recording investments at lower values. The “other gains, net” line on the income statement is key in this regard but management should clarify it in paragraph form outside of the financial statements:
Listed investments (Author’s spreadsheet)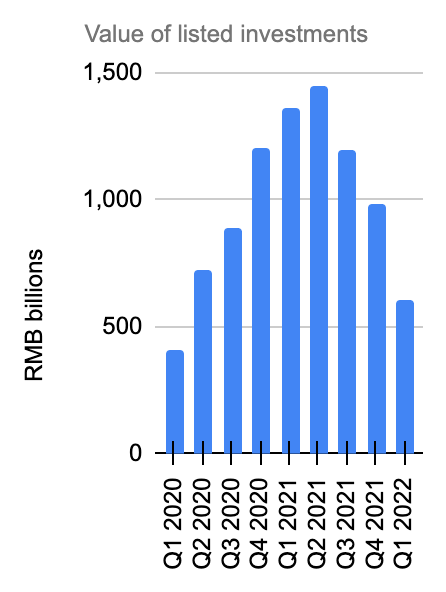
A January SC 13D filing states that Tencent sold 14,492,751 Sea Ltd (SE) ADSs at a price of US $207.00 per ADS which is a total consideration of close to $3 billion. In the 1Q22 call, there was a question about the decline of listed investments. VP James Mitchell started by talking about the JD distribution we discussed above. He then talked about other factors including the $3 billion disposition of Sea Limited. He also talked about disposing a couple billion dollars of stakes in other companies:
We disposed of a US $3 billion stake in another company and the proceeds of that then partially being used for buybacks of our own stock. And we also disposed of a couple of billion dollars of stakes in other companies. So all-in during the first quarter, if you compare the capital, we sort of raised from divestments and distributions, it was about four times bigger than the capital we put to work investing in other companies. When we do those divestments and distributions then it’s inevitable and natural and desirable that the value of our portfolio that remains is diminished by the divestments and distributions.
In the 1Q22 call, VP Mitchell goes on to say that they continue to be active with divestments as they weigh the way in which the market changes as interest rates rise. Still, he points out that opportunities continue:
We also are a company that generates very substantial free cash flow. We’re a company by virtue of our position, we have insight into emerging technology trends among consumers, among enterprises. And we see new opportunities, interesting opportunities emerging, or sometimes we see old opportunities, which we’re familiar with from previous [experience] – re emerging as valuations decline. So we’re being very selective. We’re being very disciplined both in terms of investing carefully and also divesting where necessary, but we continue to find opportunities and we continue to put capital to work against those opportunities.
A January Financial Times article showed Tencent’s Asian tech investments along with a footnote that Tencent was in the process of divesting shares in JD and Sea Ltd. Instead of relying on external publications like the Financial Times, it would be nice if investors could get updated graphs or tables like this from Tencent now that the JD and Sea Ltd positions have been reduced:
Tencent’s investments (Financial Times)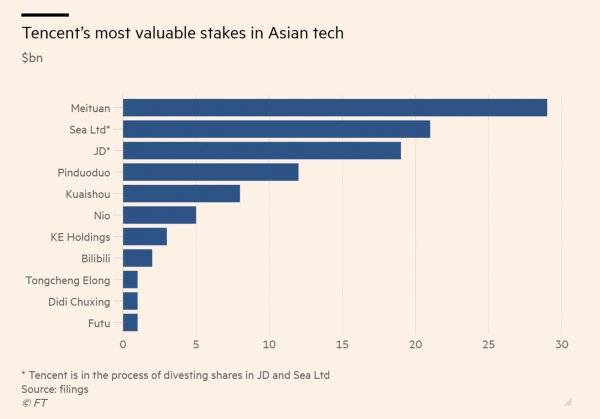
Rather than having to piece things together from SC 13D files, SC 13G files, earnings calls and external sources like the Financial Times, investors should be able to get summary information about listed investments in the equivalents of 13F filings.
Per the numbers above, the value of listed investments with today’s exchange rate is about $91 billion. Management doesn’t tell us much about the value of unlisted investments and I’m guessing it is in the range of $40 to $50 billion. As such, my valuation range for investments is about $130 to $140 billion.
General 1Q22 Operating Developments
The July 12th Bloomberg article above talks about the way Tencent’s operating segments are key for folks in China:
I hailed a taxi, listened to Taylor Swift, booked movie tickets to see Spider-Man, and then paid the taxi driver. At the diner, I scanned a QR code and perused the menu. We ordered, ate, drank, paid the bill, and hardly interacted with the waiter. On my way back, I booked a flight and hotel for my next trip and scrolled the latest news and celebrity gossip. All this time, I never left WeChat.
During the 1Q22 call, VP Mitchell answered a question from Alicia Yap about covid’s impact on Tencent, saying substantial pain was felt in Shanghai while the Shenzhen province recovered quickly from a March outbreak. However, little information about the impact from covid was given to investors apart from the fact that the consequences vary by geography.
1Q22 revenue came in at RMB 135.5 billion which was flat relative to the RMB 135.3 billion from 1Q22. The online advertising segment fell by RMB 3.8 billion from RMB 21.8 billion in 1Q21 to RMB 18 billion in 1Q22. However, the fintech and business services segment increased by RMB 3.8 billion from RMB 39 billion in 1Q21to RMB 42.8 billion in 1Q22. The decline in advertising revenue and the increase in fintech revenue are a wash on the top line but they hurt gross profit because the advertising revenue segment has a higher gross margin. As such, the overall gross profit was down 9% year-on-year to RMB 57 billion. The May 2022 corporate overview shows that free cash flow (“FCF”) continues to fall but management doesn’t shed much light on how investments in covid, regulatory challenges, investments in income statement lines and other considerations factor into this decline. Also, management doesn’t present a detailed picture of what we should see from a FCF perspective moving forward.
Online Advertising
The online advertising segment and the VAS segments are especially important from a revenue perspective because they have higher gross margins than the fintech segment so they are crucial drivers of gross profit. Citing QuestMobile, CIW shows that Tencent had 39.5% of mobile app usage time share in China in December 2020 and 35.7% in December 2021. This is consistent with Tencent’s May 2022 corporate overview where they say 35% of time spent on apps in China is captured by Tencent apps. The corporate overview also says that Tencent has 11% of the online advertising market share in China. The 1Q22 announcement says the following about the advertising segment:
Revenues from Online Advertising decreased by 18% to RMB 18.0 billion for the first quarter of 2022 on a year-on-year basis, reflecting weak demand from advertiser categories including education, Internet services and eCommerce, plus regulatory changes impacting the online advertising industry itself, partly offset by solid demand from the FMCG category, as well as our consolidation of Sogou’s advertising revenue.
It’s nice that weak demand from education, Internet services and e-commerce was mentioned along with regulatory challenges but it would be more helpful if the weight of each component was addressed.
Looking at the quarter over quarter revenue drop of RMB 3.8 billion in the 1Q22 presentation, we see that RMB 2.8 billion of the loss came from the social & others segment while RMB 1 billion of the loss came from the media segment:
Online ads (1Q22 presentation)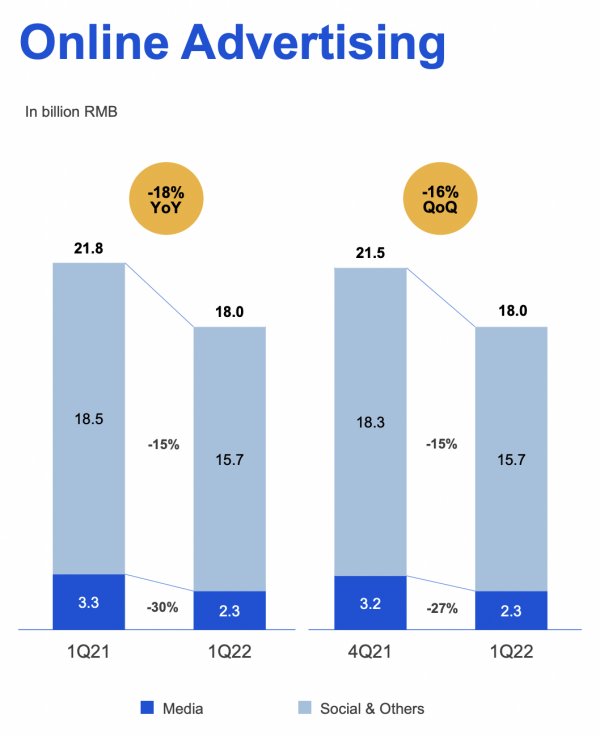
We see that mobile ad network revenue from social & others dropped severely because of weak demand and regulatory changes. I wish management would talk more about the weight of regulation changes and demand changes:
Ad considerations (1Q22 presentation)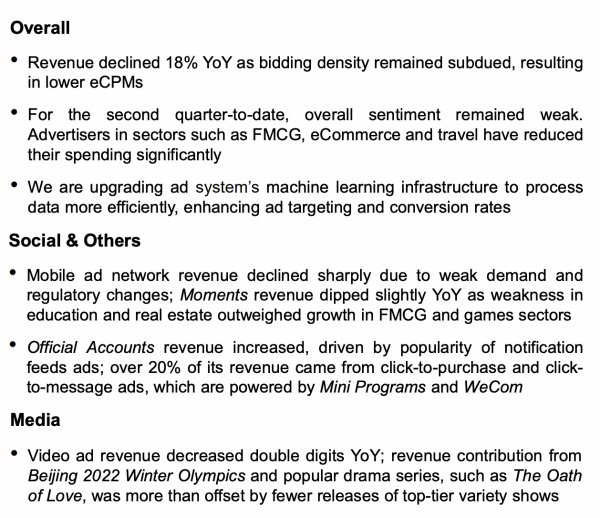
In the 1Q22 call, VP Mitchell called out subdued bidding density and lower eCPMs while discussing the advertising declines. On the regulatory side, he noted that restrictions on flash screen ads hurt revenue. He also mentioned that there were fewer releases of top-tier variety shows on the media advertising side.
A June 2022 Insider Intelligence article talks about the regulation portion of the decline by citing the Data Security Law (“DSL”) and the Personal Information Protection Law (“PIPL”). Tencent wasn’t the only company impacted by this from an advertising revenue perspective in the second half of 2021 as Alibaba (BABA), Baidu (BIDU) and ByteDance also saw declines.
I am optimistic that Tencent can turn things around with advertising in the second half of 2022 given what Chairman Ma said in the 2021 annual report about adapting to changes and upgrading solutions:
We expect our advertising business to resume growth in late 2022, as we adapt to the new environment and further upgrade our advertising solutions.
Regarding the upgrade of ad solutions mentioned by Chairman Ma, VP Mitchell gave some specifics in the 1Q22 call, saying machine learning continues to improve and process data more efficiently. I’d like to see Tencent reveal even more specifics about the future prospects in this key segment:
For the second quarter to date, advertising categories such as FMCG eCommerce and travel have scaled back their spending due to the COVID situation and attend to supply chain disruptions. We continue to invest in our advertising system, and are upgrading our machine learning infrastructure to process data more efficiently. The upgrade should ultimately enable us to enhance our targeting and thus conversion rates for advertisers.
In summary, I wish management would list the top 3 reasons for 1Q22 ad declines by dollar weight and talk about how things should turn around in the near future.
Valuation
As the world keeps moving online, I like prospects for companies that can use data and AI in China or the U.S. The World Bank shows that GDP numbers have been rising rapidly during the digital age in China and the U.S. while the numbers have been fairly flat in Europe:
China GDP (The World Bank)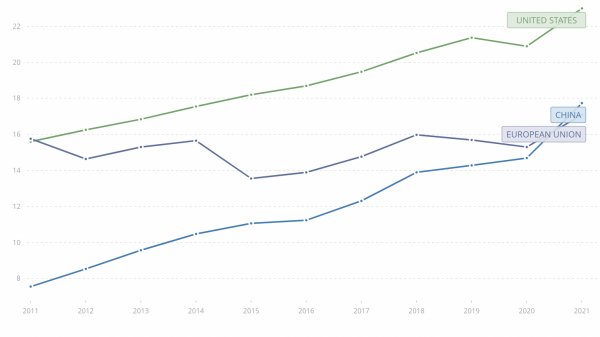
I am optimistic that online advertising companies in China and the US will continue to flourish in the decade ahead; things could get even more interesting in this area as the metaverse develops. This is one of the reasons why I own Tencent, Alibaba, Alphabet (GOOG) (GOOGL), Meta (META) and Amazon (AMZN). The Insider Intelligence article mentioned earlier shows that Tencent and Alibaba are 2 of the companies in China that should have more than $10 billion in ad revenue for 2022:
China digital ad spend (Insider Intelligence)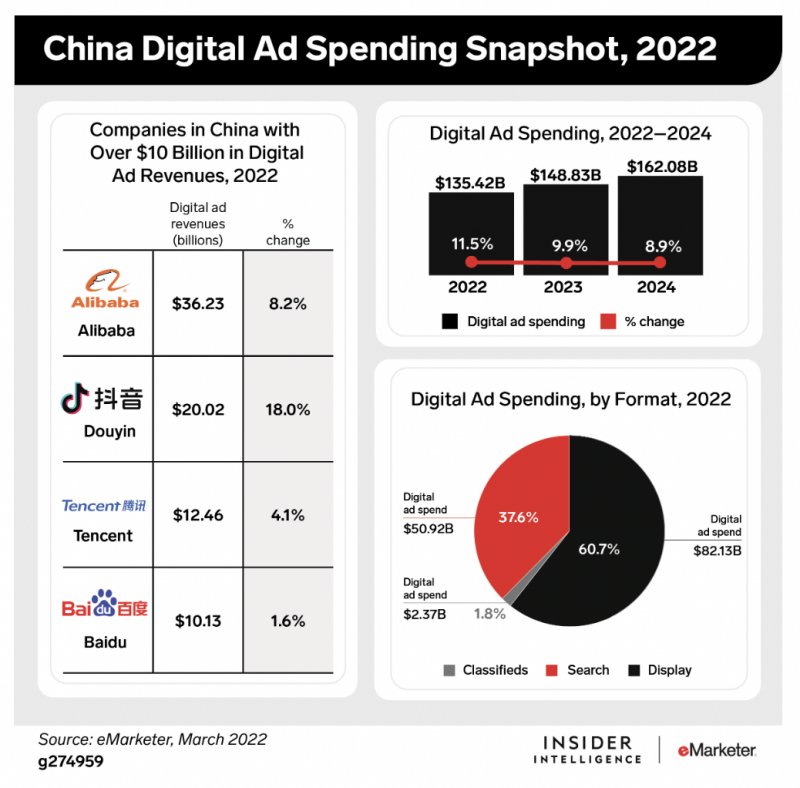
I like to compare the overall revenue and gross profit for Tencent to the overall revenue and gross profit for Alibaba and Meta. All 3 companies have grown rapidly over the years. Tencent’s gross profit has climbed from RMB 18,207 million in 2012 to RMB 314,174 million in 2021 for a CAGR of a little over 37%. Alibaba’s F-1 filing shows that they had gross profit of RMB 24,798 million through March 2013. We see 9 years later in the 4Q22 release that they had annual gross profit of RMB 313,612 million through March 2022 for a CAGR of nearly 33%. Meta has a gross profit CAGR of 43% in the same duration. Meta’s numbers are almost completely from digital advertising whereas Tencent and Alibaba have substantial revenue and gross profit from other segments:
Tencent revenue & gross profit (Author’s spreadsheet)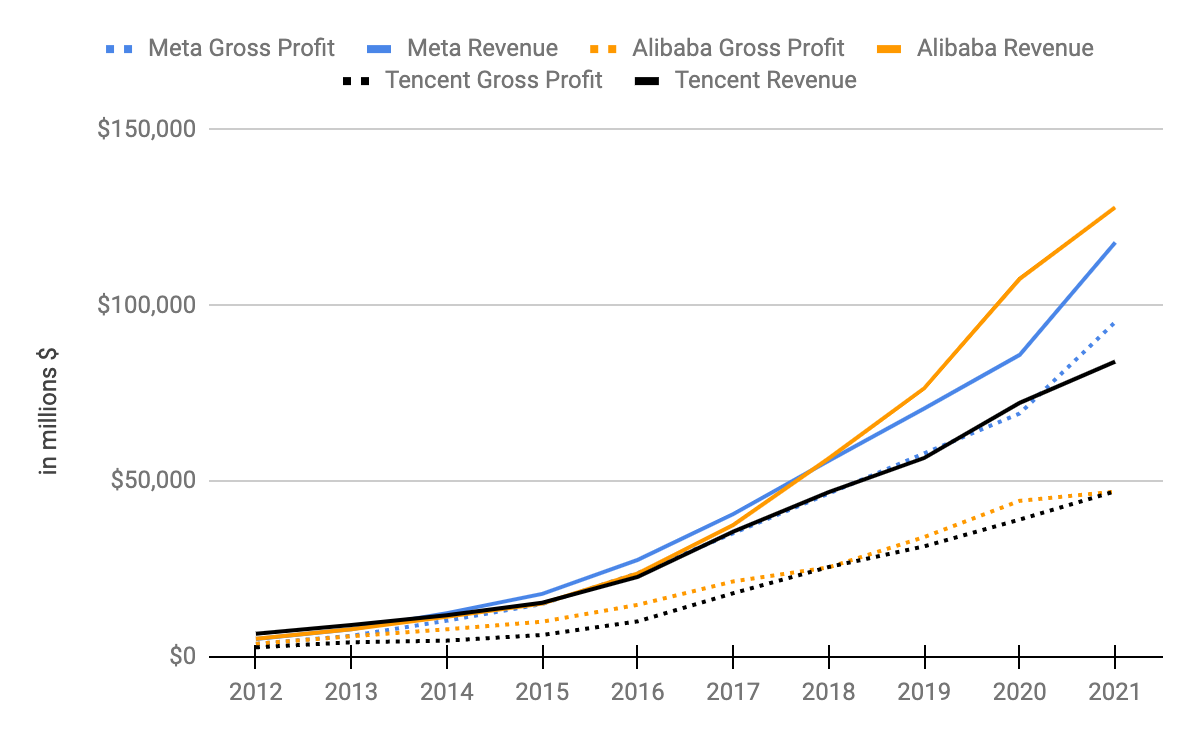
*The Alibaba numbers are shifted 3 months forward through March instead of going through December.
I like to think about the number of employees at the companies above. In the 1Q22 call, we learned that Tencent has 116,000 employees. Meta’s 1Q22 10-Q says they have 77,805 employees. Per Alibaba’s 4Q22 release, they have 254,941 employees.
The May 2022 corporate overview shows how revenue has grown nicely in recent years, especially with the fintech and business services segment:
Segment revenue (May 2022 corporate overview)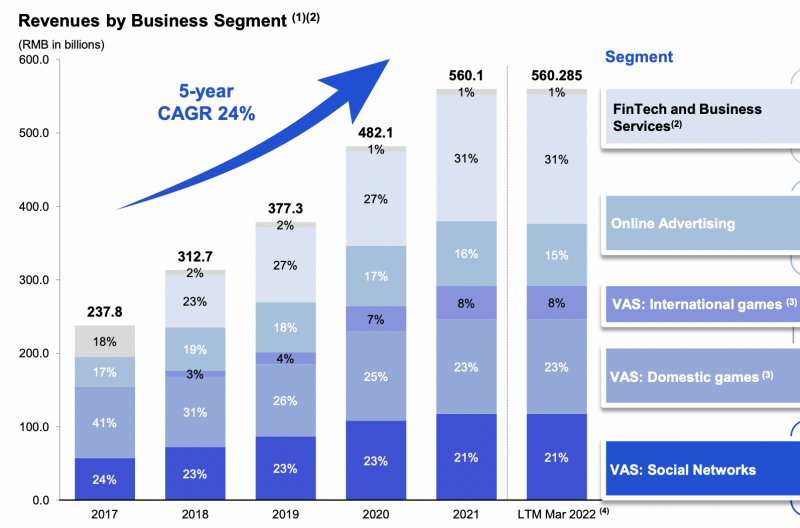
Overall gross margins fell from 46.3% in 1Q21 to 42.1% in 1Q22. Part of this was from value added services where they dropped from 55.1% to 50.4%. Another part of the decline was online advertising where gross margins dropped from 45.1% to 36.7%. The only segment that has seen gross margins increase from 1Q19 to 1Q22 is fintech where they went from 28.5% to 31.6%. VAS and online advertising saw margins fall from 57.6% and 41.9% to 50.4% and 36.7%, respectively:
Gross margins (1Q22 presentation)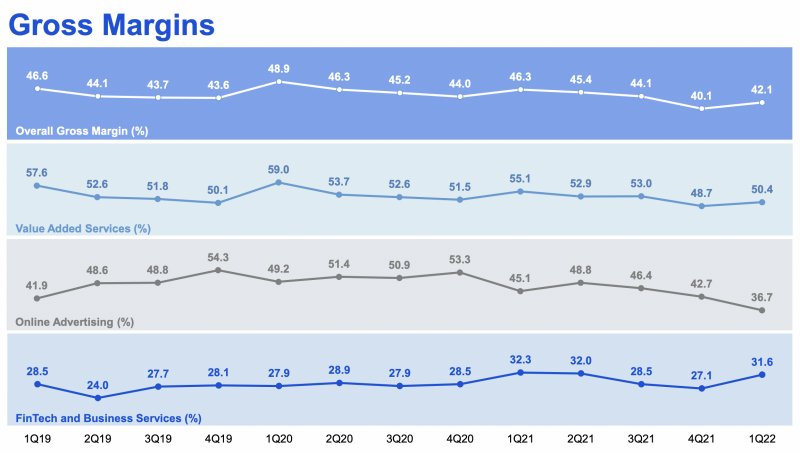
Gross profit growth looked decent in 2021 except for the advertising segment whose annual gross profit fell from RMB 42,260 million to RMB 40,594 million:
Gross profit (Author’s spreadsheet)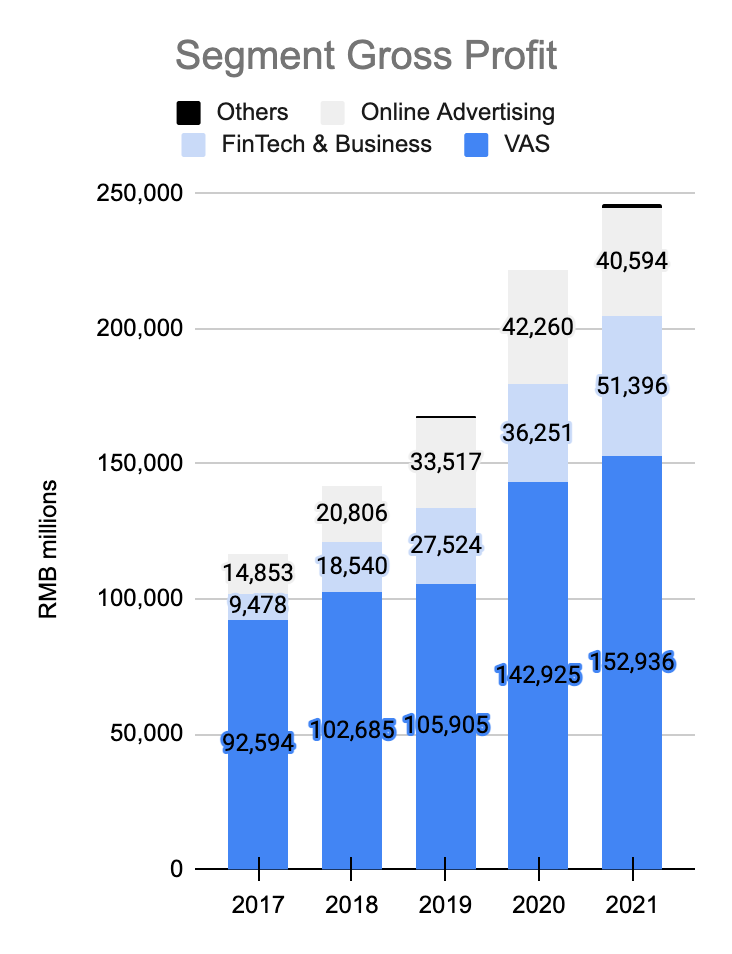
The 4Q21 presentation shows how management arrives at the RMB 108.1 billion free cash flow (“FCF”) figure for the 2021 year. They start with RMB 175.2 billion operating cash flow before subtracting RMB 31.2 billion capex paid, RMB 30.8 billion media content and RMB 5.1 billion lease liabilities:
FCF (4Q21 presentation)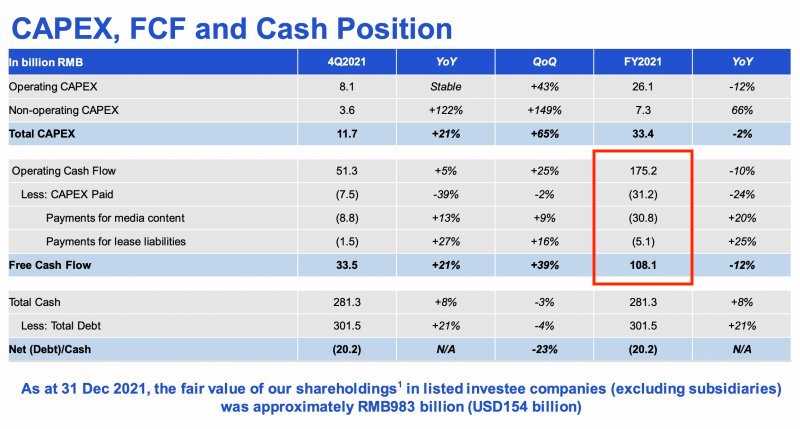
The May 2022 overview shows that trailing-twelve-month (“TTM”) FCF got worse in 1Q22, falling to RMB 90.1 billion:
Cash generation (May 2022 Corporate Overview)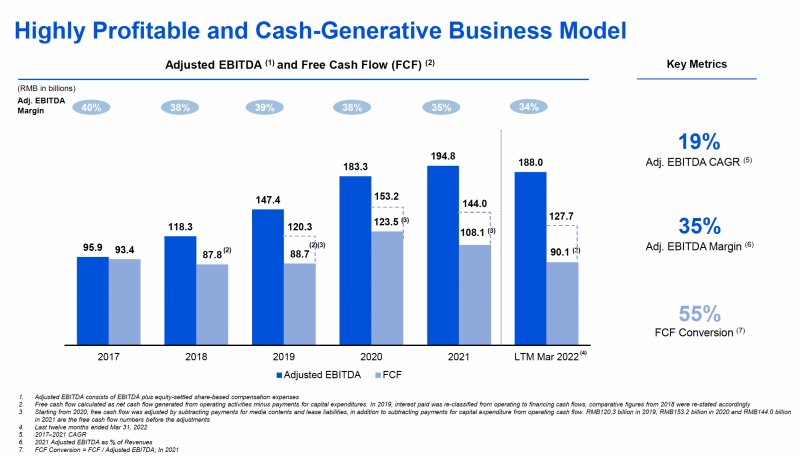
Footnotes #2 and #3 clarify that FCF in light blue is not as flat as it looks when we use more of an apples to apples comparison with the dotted lines:
2. Free cash flow calculated as net cash flow generated from operating activities minus payments for capital expenditures. In 2019, interest paid was reclassified from operating to financing cash flows, comparative figures from 2018 were restated accordingly
3. Starting from 2020, free cash flow was adjusted by subtracting payments for media contents and lease liabilities, in addition to subtracting payments for capital expenditure from operating cash flow. RMB 120.3 billion in 2019, RMB 153.2 billion in 2020 and RMB 144.0 billion in 2021 are the free cash flow numbers before the adjustments
I treat stock-based compensation like a cash expense so that consideration alone lowers my estimates of FCF. However, I also think there are growth investments in capex that raise my estimates of FCF and these considerations largely offset each other. In the past under a lower interest rate environment, I thought Tencent’s segments could be worth 25 to 30x FCF but that is no longer the case today.
Tencent has some nascent businesses that don’t yet contribute meaningful amounts of FCF so looking at overall valuation through a FCF lens alone is incomplete. I think the operating segments are worth about 19 to 20x FCF. Again, TTM FCF is RMB 90.1 billion and this comes to about $13.5 billion with today’s exchange rate. Using multipliers, we get a range of $257 billion to $270 billion.
Given the insight Tencent has from collecting vast amounts of data, I think they can deploy future earnings effectively to make additional home run investments like the one they had with JD. It is very subjective as to what this is worth in today’s dollars but I’m guessing it is in the range of $20 to $30 billion.
I value Tencent as follows:
$130 to $140 billion Investments
$257 to $270 billion Operating businesses
$20 to $30 billion Efficacy of deploying earnings
——————————————–
$407 to $440 billion
The 1Q22 announcement says there were 9,538 million weighted shares during the period. Multiplying this by the July 12th ADR price of $42.48 gives us a market cap of about $405 billion. In my book, the enterprise value (“EV”) is $18 billion more than the market cap. Looking at long term debt and leases, we have debt of RMB 148,467 million + notes payable of RMB 135,465 million + lease liabilities of RMB 17,981 million for a sub total of RMB 301,913 million. Regarding current debt and leases, we have RMB 21,656 million debt + RMB 9,515 million notes payable + RMB 5,927 million lease liabilities for a sub total of RMB 37,098 million. We also have non-controlling interests of RMB 67,418 million. Partially offsetting this sum of RMB 406,429 million, we have cash and equivalents of RMB 188,826 million + term deposits of RMB 82,604 million + financial assets at fair value of RMB 11,742 million + other financial assets of RMB 1,568 million for a sum of RMB 284,740 million. This means EV is about RMB 121,689 million or $18 billion more than the market cap. Management subtracted interest payments when calculating FCF above so I think it makes more sense to compare FCF to the market cap than the EV.
The market cap is slightly under my valuation range so I think the stock is reasonably priced.
Be the first to comment