


Eoneren
Investment summary
We are neutral Teleflex Incorporated (NYSE:TFX) shares given the balanced risk/reward calculus in the investment debate. Whilst the name presents with desirable characteristics in terms of profitability and free-cash conversion, valuations are stretched to the downside, and we observe a lack of risk premia to harvest from the name. With investors rewarding idiosyncratic investment factors in FY22, the question remains if TFX can re-rate and offer long-term upside capture. By our estimation, the market has yet to turn a corner with TFX. We rate neutral PT $192–$235.
Exhibit 1. TFX 6-month price action
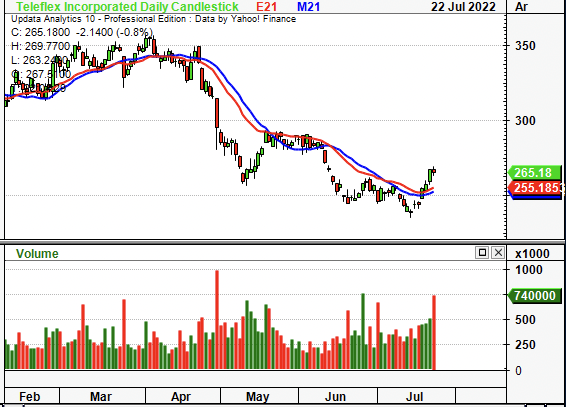
Data: Updata
Market factors – exposure to alternative premia
The resilience of corporate earnings to economic downturn is a key factor in navigating the forward investment landscape. The market is doing a good job in sifting through the stock universe and rewarding those names with idiosyncratic risk premia that is uncorrelated to the benchmark, punishing those with high-correlation and low resilience. As investors look to construct portfolios in H2 FY22, they should be looking to step up in quality, liquidity and resiliency. This includes winding back budgeting to equity risk and seeking out more alternatives-like exposure (low equity beta, in particular). Hence, we need to evaluate TFX on market, fundamental, valuation, technical and portfolio factors.
In that vein, TFX has lost strength relative to the sector since March FY22, although the trend had been in situ since mid FY21. Despite its reduction in covariance to the benchmark, it still has a remarkably high equity beta at 83%, as seen on the chart below. These are undesirable characteristics that investors aren’t paying a premium for in FY22. Instead, pundits are seeking high-quality offerings that offer uncorrelated equity return. As such, this is a key risk investors must consider.
Exhibit 2. Relatively high covariance structure whilst weakening against the benchmark
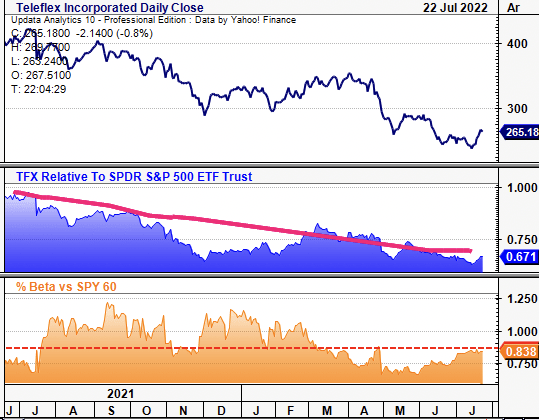
Data: Updata
These trends are carried over against the medical devices and health care equipment sector, as seen below. This is important, as TFX is now softening whilst the wider segment has caught a bid since late June. Moreover, it is highly correlated to the sector, seen below, and hence should be at least performing on par. This is not the case, however. This points to the fact investors are rewarding very specific factors in FY22, despite TFX’s performance on a fundamental level (discussed below). Nevertheless, we aren’t attracted to the risk-premia on offer here.
Exhibit 2. Bifurcating to the downside against the medical devices sector whilst highly correlated
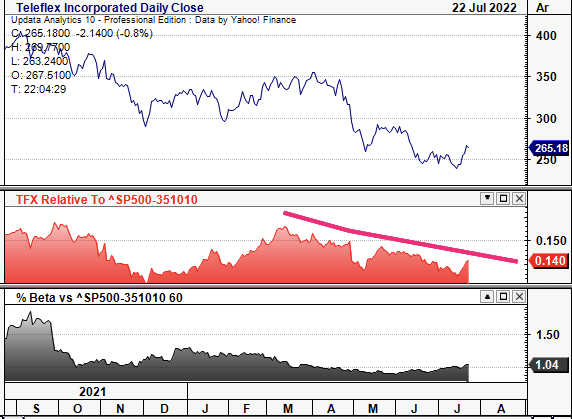
Data: Updata
Fundamental factors balance the risk/reward calculus
Recently, TFX demonstrated that its UroLift System, indicated for treatment of enlarged prostate, has shown positive results. However, the market was agnostic to the update, illustrating this may have already been priced in.
TFX has demonstrated steady quarterly operating performance from FY15 to date, as seen in Exhibit 3. It printed sales of $881 million in Q1 FY22, an ~8% YoY gain, but down sequentially from $1.04 billion. Gross margins came in at ~54%, down~100bps sequentially and in line with the previous year. Meanwhile, quarterly FCF has been seasonal but grown geometrically at CAGR ~8% over the past seven years to date. It printed FCF of ~$45 million net of dividends in Q1 FY22, down from $228 million the prior quarter. Investors currently realise a 3.3% yield on this.
Moreover, quarterly operating profit came in flat YoY at $146 million on Q1 FY22, in line with historical averages. It has held operating profit between $150 million to $271 million throughout the pandemic, on an above-average margin of 19.1%.
Exhibit 3. Quarterly operating performance has been steady and seasonal, investors realize ~3% FCF yield
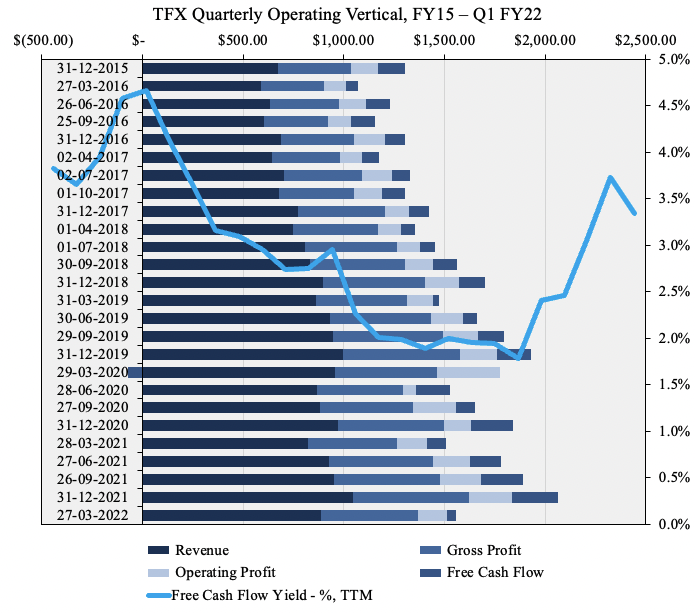
Data & Image: HB Insights
Moreover, profitability factors stand out for TFX as an insulating factor. ROA and ROIC have averaged ~12% and respectively on a quarterly basis since FY15. Each of these have levelled off to ~8% each since FY20. These are in fact desirable characteristics in the current regime. TFX compounds capital at a 7-year average of 12%, whereas its current WACC is ~9.2%. This ~300bps spread above the cost of capital is conducive to generating cash flows in a higher-rates regime. Moreover, the ROICC/WACC ratio is 1.3x, said otherwise, average ROIC covers the cost of capital ~1.3x.
Exhibit 4. Profitability continues to be a standout for TFX and adds bullish symmetry to risk/reward
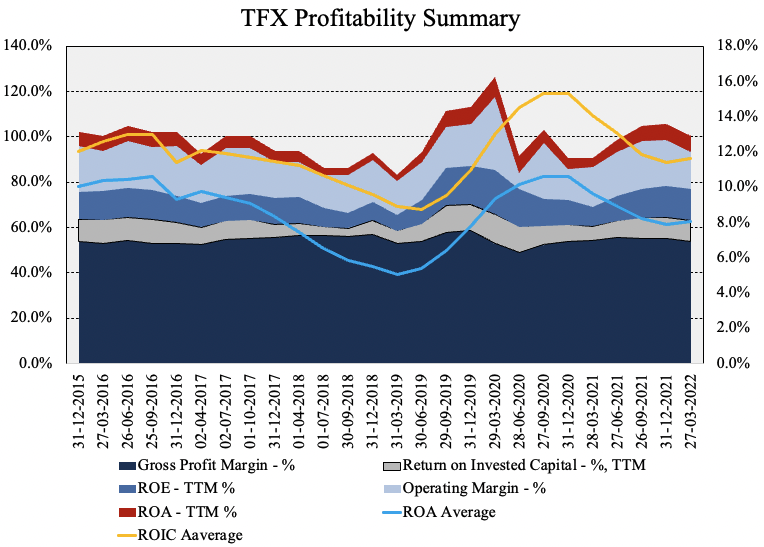
Data: HB Insights, TFX SEC Filings
Valuation
Shares are trading at ~26x P/E and ~21x FY22 earnings estimates. It also trades at an average discount of ~1% to key multiples in the GICS peer group, as seen below. In particular, it offers a 2.4% premium in forward earnings estimates, suggesting the market expects an above-industry performance from the company. Shares are also priced at ~21x TTM FCF, whilst trading at 3.3x book value.
Exhibit 5. Multiples & Comps
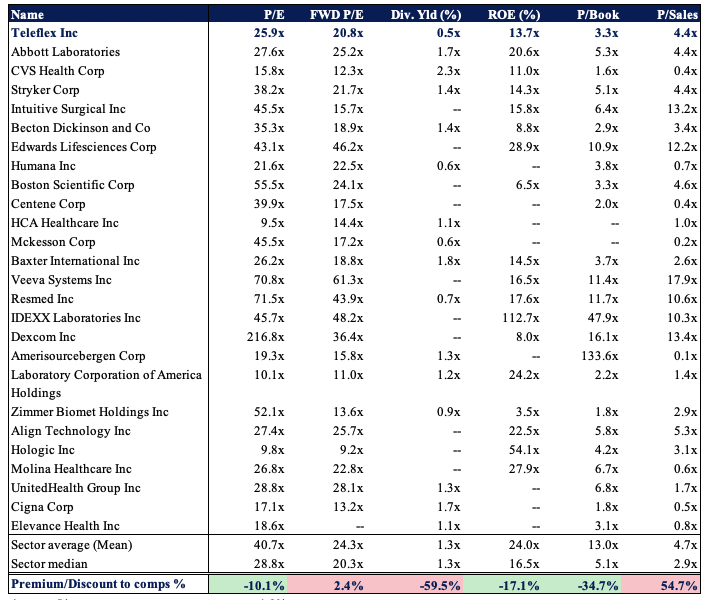
Data: HB Insights
The stock has de-rated after peaking in mid-2020, as seen in Exhibit 6. Moreover, the company’s bottom-line fundamentals appear to be leading it lower based on this chart. To illustrate, it has delivered a 24% total return since FY17, however, in the same time, FCF and book-value multiples have slipped heavily into the red. It has clipped ~9.2% off its P/FCF rating and ~23% off its P/Book rating in this period, as seen below.
Exhibit 6. TFX de-rating substantially of FY19–F20 highs at FCF & book value levels
Now trades back in line with FY17 multiples. Question is, is this time for entry, or a warning sign?
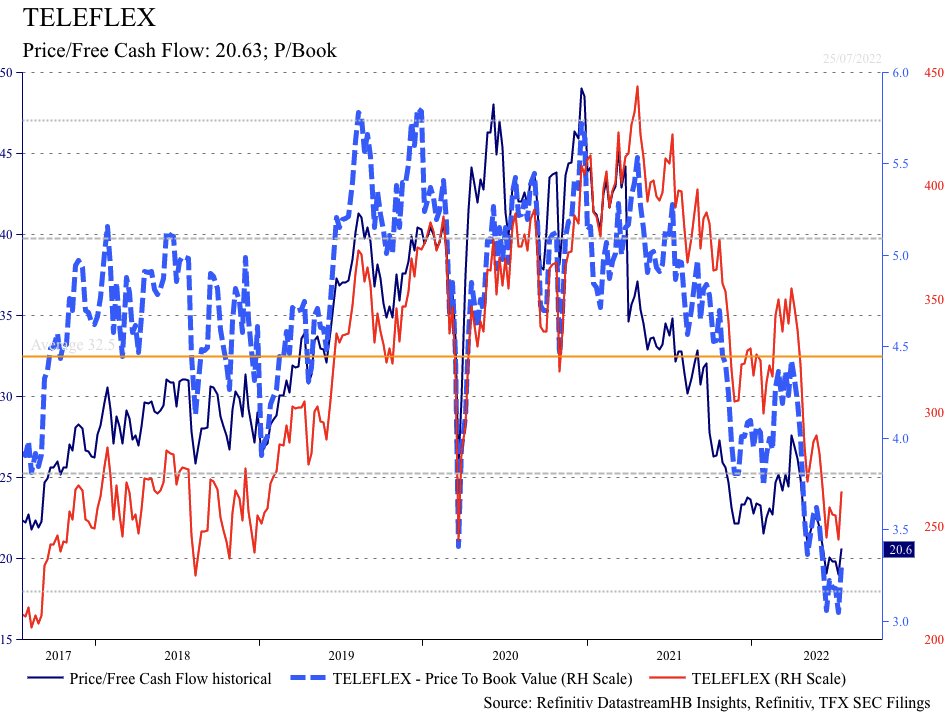
Data: HB Insights, Refinitiv
At 3.3x book value and 2.75x EV/book we are paying $354 and $296 respectively, if we were to “pay” that amount. This illustrates that TFX is ~13%–35% overvalued relative to equity value right now. As such, we price TFX at $192–$230.
This leaves us with little margin of safety to play with at the equity level, which one portion of what we define as tangible value. TFX also realizes a 13% cash ROE from FCF, well above industry peers. However, that is TFX’s return on equity, not ours. We would pay ~2.75x book value, pushing our ROE[FCF] down to ~5%. The equity duration on this stretches out to over 15 years, as seen below, and well beyond our holding period.
Exhibit 7.
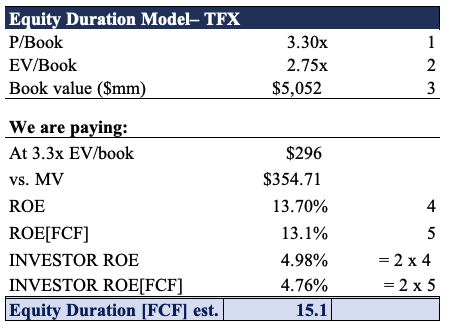
Data: HB Insights Estimates
Technical factors
On the daily point and figure chart there is heavy downside pressure although price targets are top-heavy at $282-$321. However, price action appears bearish from the presence of several outer resistance lines.
Exhibit 8. Downside pressure, price targets still pointing to sideways action
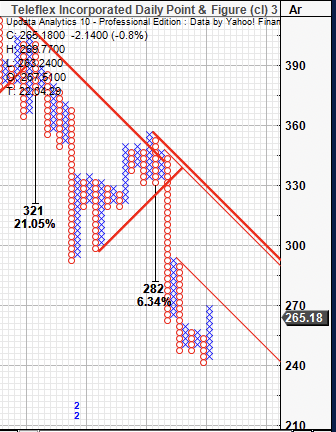
Data: Updata
Moreover, tracing the downside leg in April down to the low in July we can see the stock has just begun to retrace the move. It appears too early to guide directionally at this point, and we await further price action to confirm the trend.
Exhibit 9.
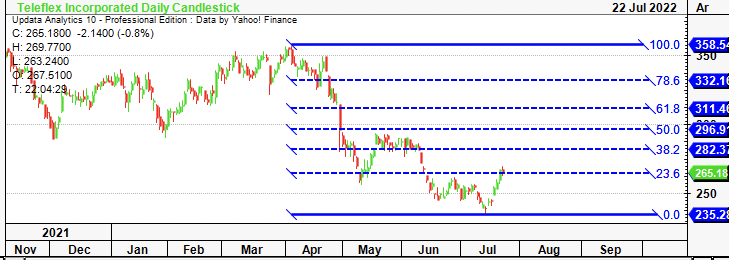
Data: Updata
In short
TFX presents with robust fundamentals that look set to stand up well in the forward looking regime. However, when building out the investment case, there’s a lack of flesh to put on the skeleton. The stock has de-rated substantially since mid-2020 and now trades back in line with FY17 multiples. It is also weakening against the sector, whilst other names within the medtech universe look poised to outperform the benchmark in H2.
Alas, we price the stock at $192-$230, believing it to be overvalued in the double digits. For any point of entry, we’d be seeking a sharp pullback to these levels for a small position to control risk.
Be the first to comment