

bloodua
Introduction
The Bermuda-based Teekay Tankers Ltd. (NYSE:TNK) released its third-quarter 2022 results on November 3, 2022.
Important note: This article is an update of my article published on July 5, 2022. I have been following TNK on Seeking Alpha since 2021.
1 – 3Q22 Results Snapshot
The company posted an adjusted quarterly income of $1.70 per share or $57.91 million. The results were better than expected due to the higher spot tanker. The net income was $68.05 million compared to a loss of $52.06 million a year ago.
TNK 3Q22 highlights (TNK Presentation)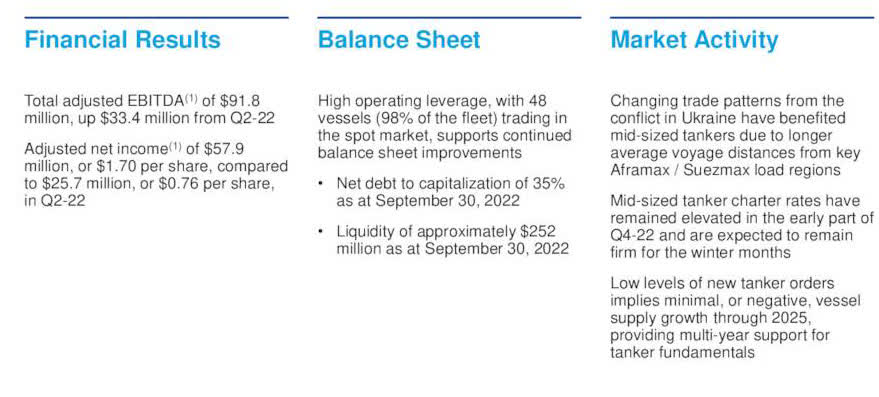
CEO Kevin Mackay said in the conference call:
Our improved results quarter-over-quarter were primarily due to higher spot tanker rates. In a counter seasonally strong market, we benefited from having 98% of our fleet in the spot market, which in turn enabled us to reduce our net debt to capitalization to 35% at the end of the quarter and to increase our liquidity to more than $250 million. The strong charter market for mid-sized tankers is being driven by both tanker market fundamentals and geopolitical factors.
2 – Stock Performance
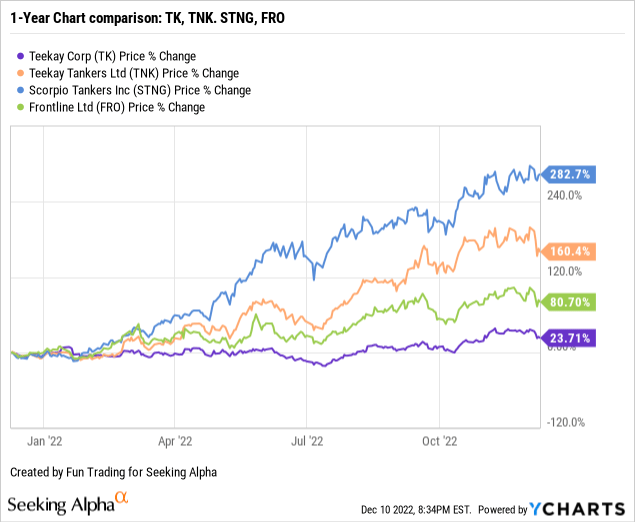
As shown below, TNK has fared very well in 2022 but is far behind Scorpio Tankers. TNK is up 160% on a one-year basis.
3 – Investment Thesis
The investment thesis for TNK is always a laborious exercise due to the inherent extreme volatility of the Tanker industry. This fact will never go away.
However, looking at the performance of a few tanker companies since the start of 2022, we can see that the industry has done very well.
The company indicated that the average mid-sized spot tanker rates were the highest for a third quarter since 2008. This increase was driven primarily by the impact of the ongoing Ukraine conflict. The midsize tankers segment benefitted the most due to disruptions in oil trading patterns.
TNK rates analysis (TNK Presentation)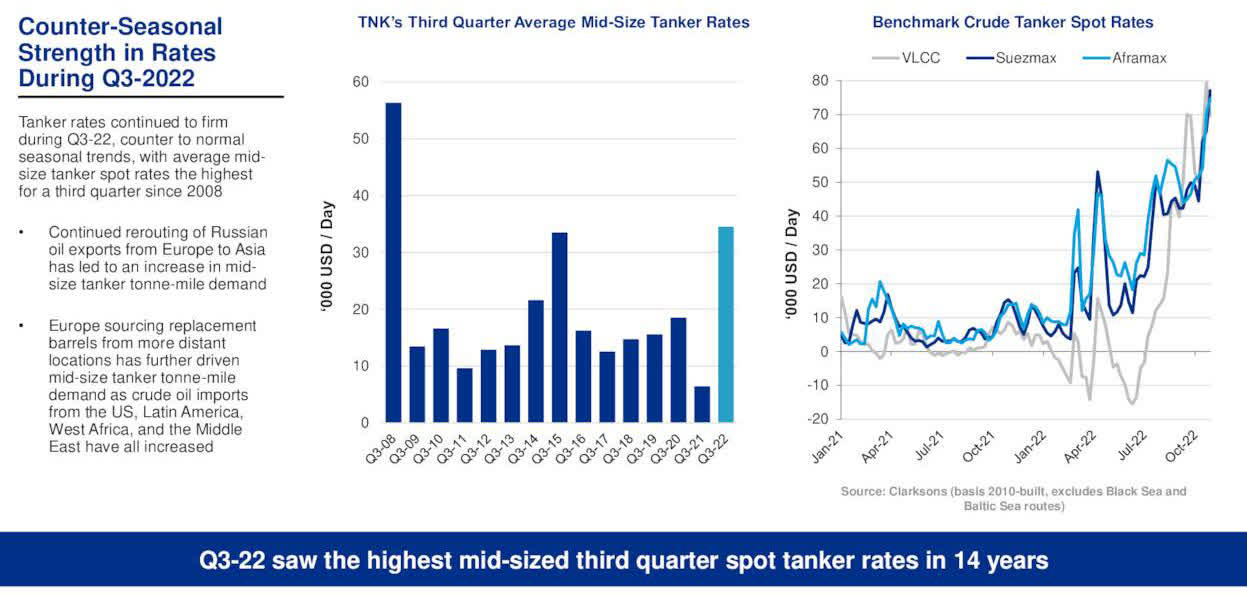
TNK operates primarily in this segment and saw an increase in ton-mile demand, pushing higher rates, with several new long-haul routes replacing shorter ones.
Large crude tankers are now raking in earnings of more than $100,000 per day, while time-charter rates are at their highest since the storage-driven spike of early 2020. However, perhaps the stars of the show have been older Aframaxes, 15-year-old vessels that have doubled in value in 2022, with some remarkable short-term asset plays being executed. Most in demand has been the Ice-class tonnage for lifting Russian crude.
CEO Kevin Mackay said in the conference call:
Mid-sized tanker voyages have materially lengthened as a result of the conflict in Ukraine, driving up charter rates that are expected to stay strong throughout the winter months. At the same time, the continued absence of new tanker orders means that we expect to see minimal or even negative fleet supply growth through 2025.
The fourth quarter-to-date rates are improving, moving into a seasonally stronger quarter. Based on approximately 43% and 38% of spot revenue days booked, Teekay Tankers’ fourth quarter-to-date Suezmax, Aframax, and LR2 bookings averaged roughly $40,000, $36,600, and $44,700 per day, respectively. These higher rates were approximately 3 times higher than last year’s fourth-quarter spot rates.
TNK Spot rate 3Q22 (TNK Presentation)
Because most of the company’s vessels are trading in the spot market, TNK is well-positioned to generate strong cash flow in 4Q22 and 2023.
In 3Q22, TNK completed the sale of three vessels built in 2004 and 2005 for approximately $44 million. It includes one 2005-built Aframax sold for roughly $15 million and two other vessels that were previously announced.
However, as we can see above, TNK is highly specialized. It raises stock volatility and mandates a trading strategy adapted to the challenge. As a reminder, the company is not paying a dividend, hence not offering any incentive to keep a long-term investment. As an example, SFL corp. (SFL) which owns a tankers segment and is paying a yield of 9.68%.
In short, the 2023 tankers market looks good for TNK, but most of the positive has already been factored into the stock price.
Thus, I recommend short-term trading LIFO and taking advantage of the wild swings while keeping a small long-term position for a final payday.
TNK – The Raw Numbers: Third Quarter Of 2022 And Financials History
| Teekay Tankers | 3Q21 | 4Q21 | 1Q22 | 2Q22 | 3Q22 |
| Total Revenues in $ Million | 115.89 | 160.31 | 174.02 | 242.39 | 279.39 |
| Net Income in $ Million | -52.06 | -39.81 | -13.94 | 28.55 | 68.05 |
| EBITDA $ Million | -18.31 | -5.77 | 18Cash | 61.86 | 102.60 |
| EPS diluted in $/share | -1.54 | -1.17 | -0.41 | 0.83 | 1.98 |
| Operating cash flow in $ Million | -38.40 | -23.21 | -14.67 | 16.52 | 46.32 |
| CapEx in $ Million | 7.93 | 6.28 | 4.07 | 3.34 | 4.10 |
| Free Cash Flow in $ Million | -46.33 | -29.48 | -18.74 | 13.18 | 42.22 |
| Total Cash $ Million | 60.72 | 50.57 | 18.37 | 66.27 | 78.01 |
| Total Debt (including current) In $ Million | 631.3 | 634.4 | 607.20 | 618.40 | 564.20 |
| Shares Outstanding (Diluted) in Million | 33.90 | 33.90 | 33.91 | 34.20 | 34.38 |
Source: Teekay Tankers release
Note: More data are available to subscribers only.
Analysis: Revenues, Earnings Details, Free Cash Flow
1 – Operating revenues were $279.39 million in 3Q22
TNK Quarterly Revenues history (Fun Trading)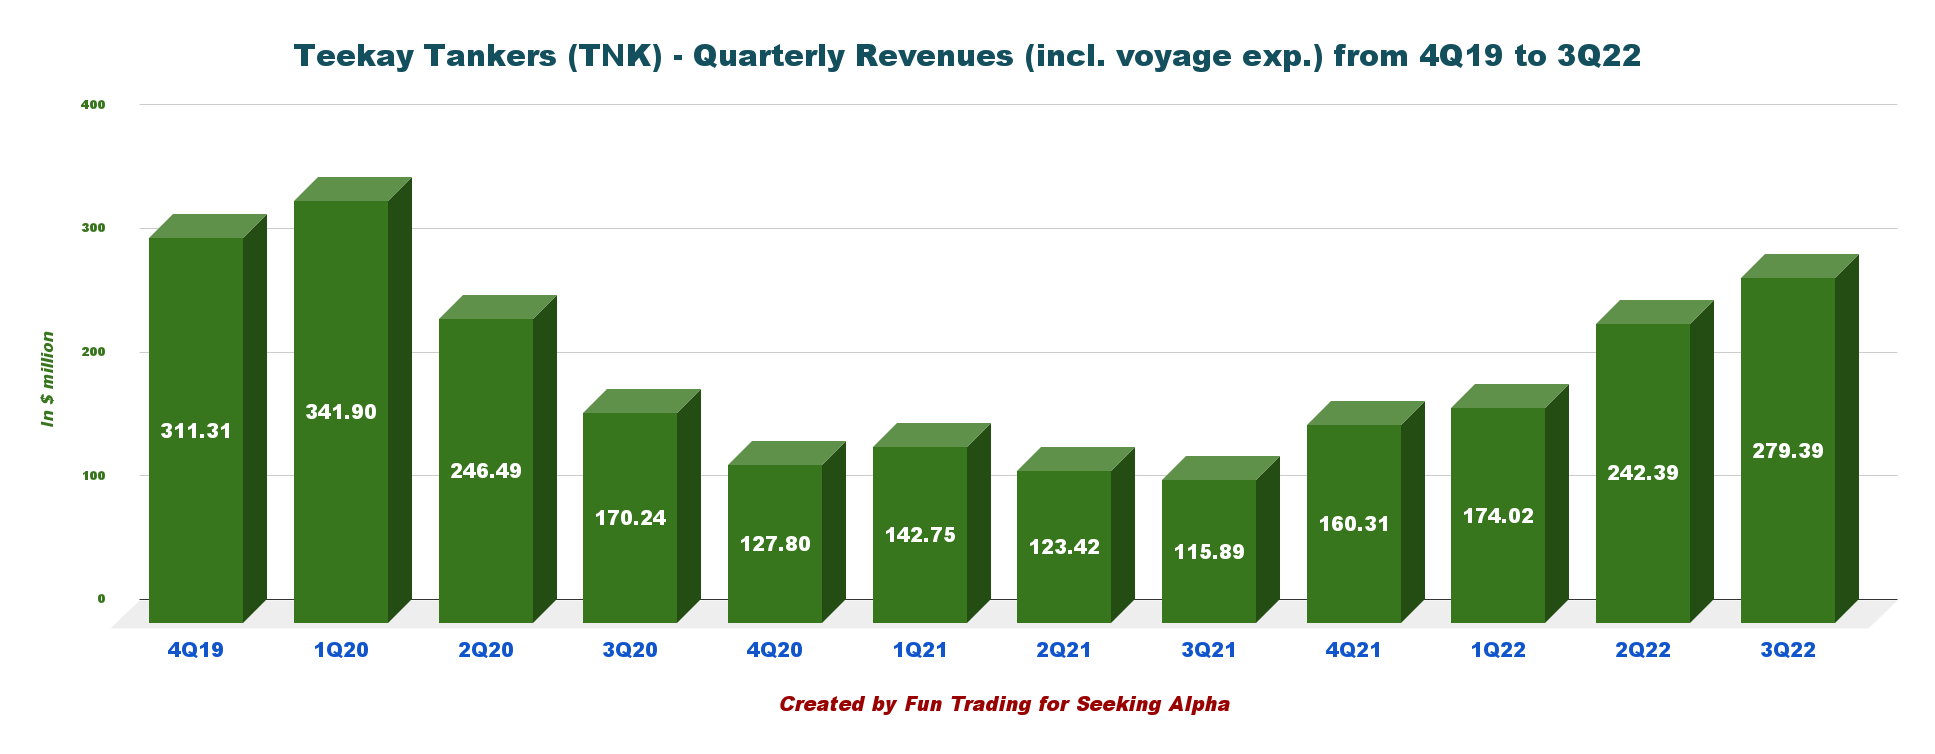
Teekay Tankers announced a total adjusted net income of $57.91 million, or $1.70 per share, during the third quarter, increasing from $25.66 million, or $0.75 per share, in the second quarter of 2022. Revenues were $279.39 million in 3Q22, up from $115.89 million in 3Q21.
The better quarterly results were primarily due to higher average spot tanker rates in the third quarter of 2022. In the press release:
Spot tanker rates have continued to improve. The Company has secured strong fourth quarter-to-date spot rates of $40,000 per day for the Suezmax fleet, $36,600 per day for the Aframax fleet, and $44,700 per day for the LR2 fleet. Quarter to-date rates are approximately two to three times higher compared to last year’s fourth quarter rates.
TNK Rate pr (TNK Press release)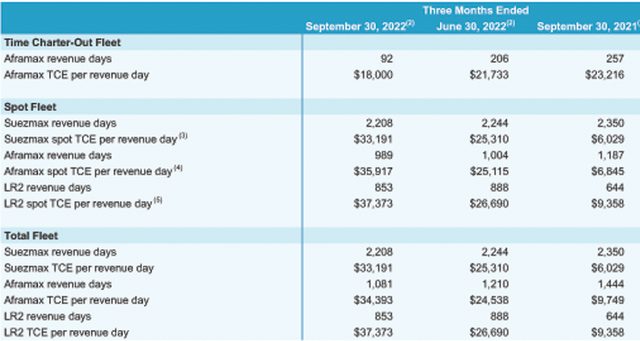
2 – Free cash flow was $42.22 million in 3Q22
TNK Quarterly Cash versus Debt history (Fun Trading)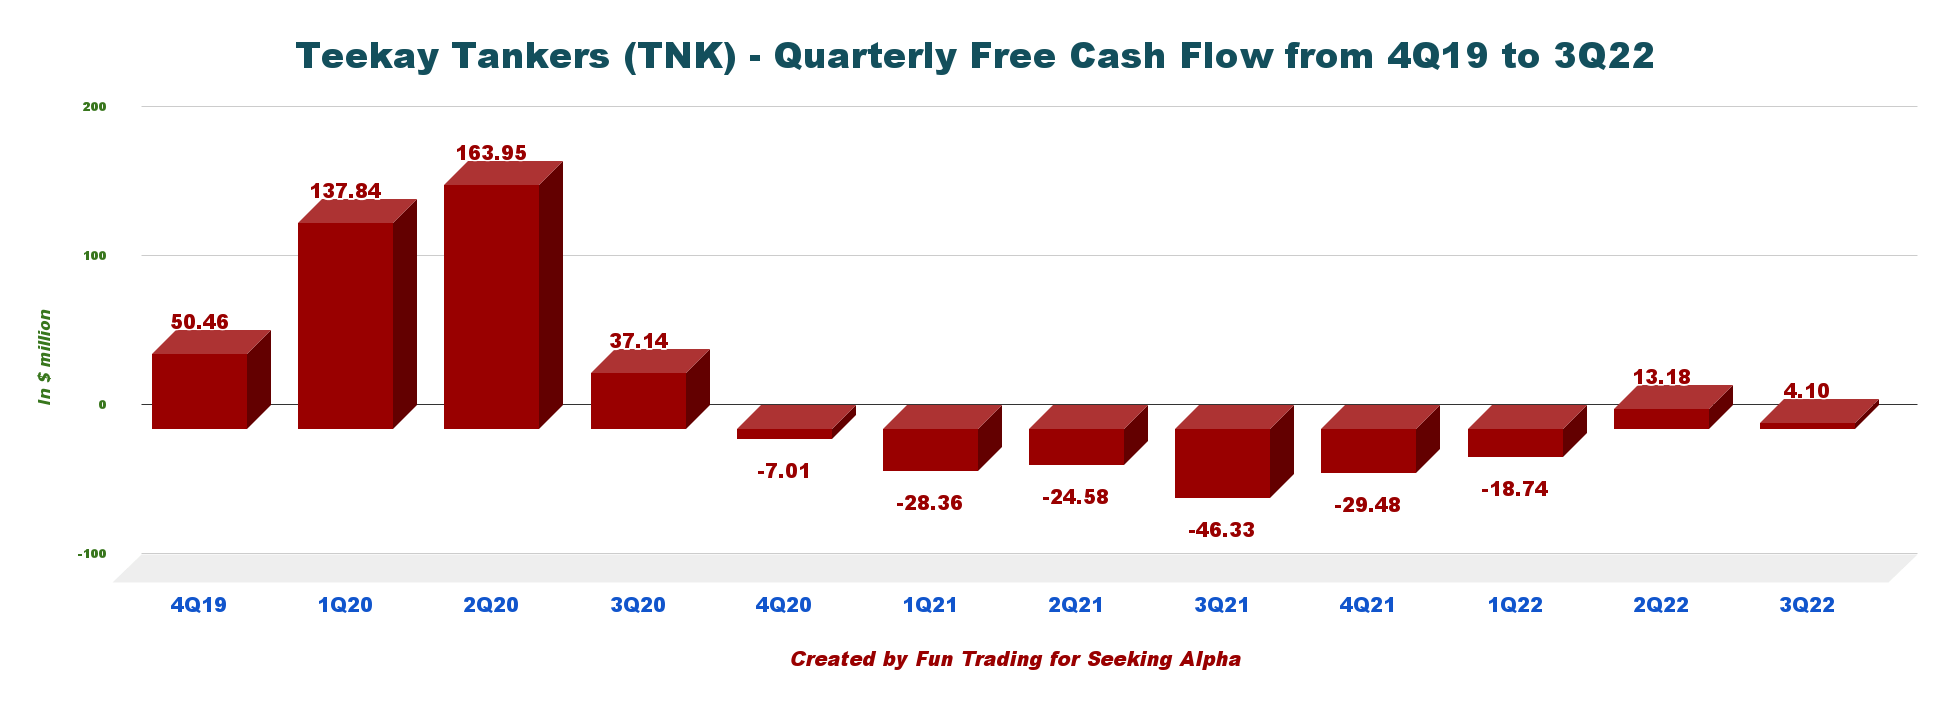
Note: Free cash flow is cash from operations minus CapEx.
Trailing 12-month free cash flow was $7.18 million, with a quarterly free cash flow of $42.22 million in 3Q22. Free cash flow improved significantly this quarter from a loss of $46.33 in 3Q21.
3 – Debt Analysis
TNK Quarterly Cash versus Debt history (Fun Trading)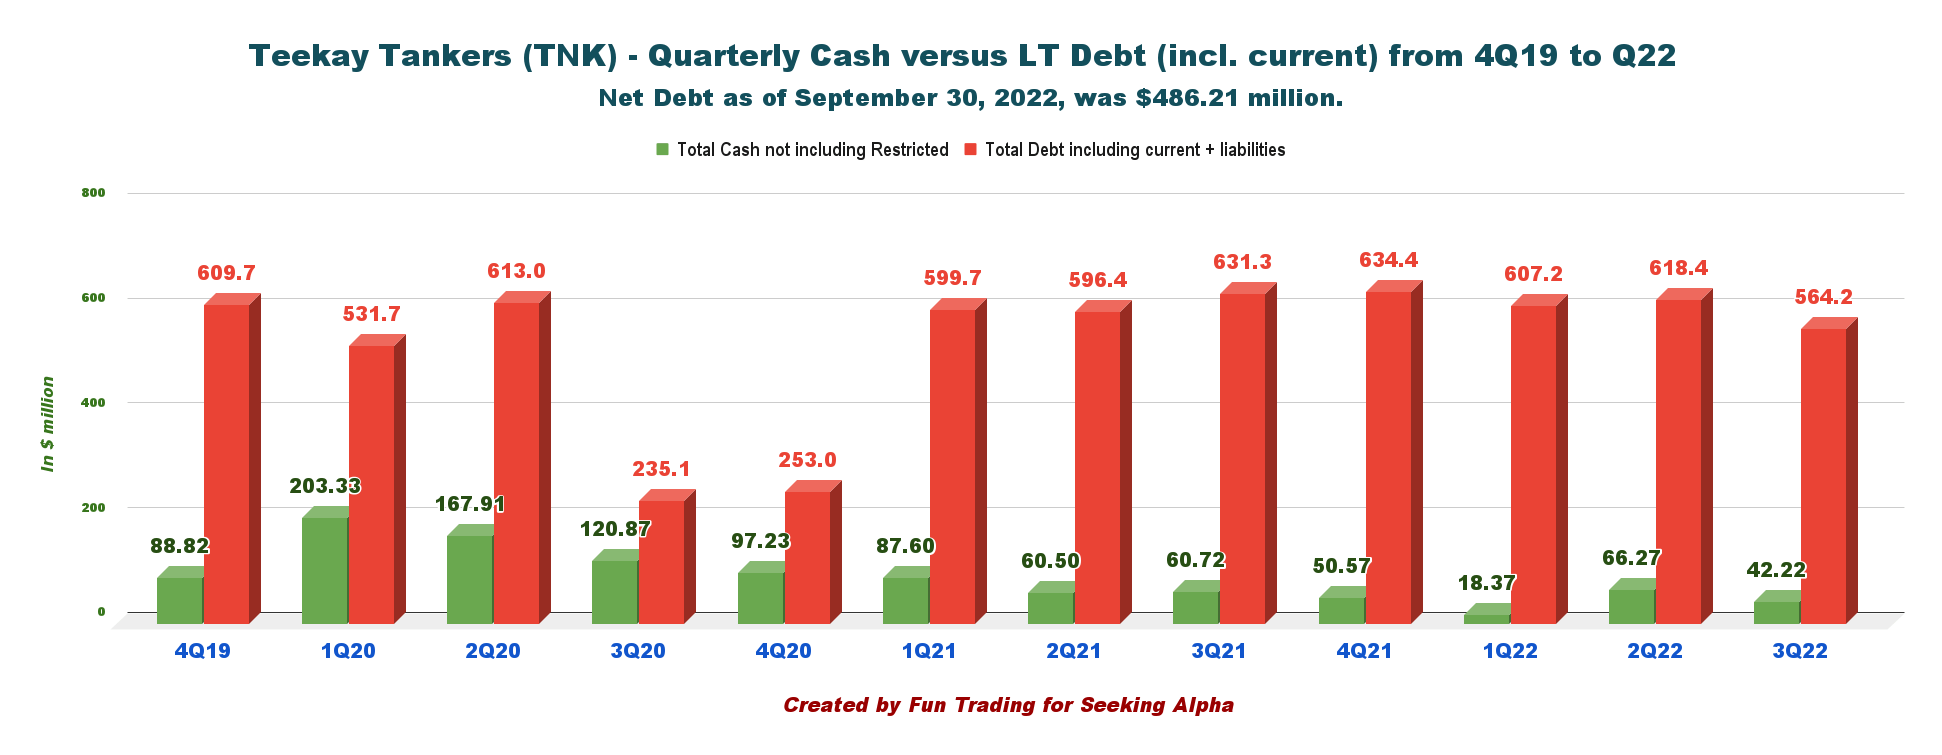
Net debt is $486.21 million in 3Q22, including current and long-term obligations related to finance leases.
As of September 30, 2022, the company had total pro forma liquidity of $252.0 million (comprised of $78.0 million in cash and cash equivalents and $174.0 million in undrawn capacity from its credit facilities).
High operating leverage and strong spot tanker rates resulted in strong cash flows in the quarter supporting the Company’s debt reduction efforts. The Company’s net debt(2) decreased from the prior quarter by $66 million to $486 million.
4 – Fourth Quarter Of 2022 – Outlook
The company expects an increase in revenues of 140 net revenue days in 4Q22. Also, a slight increase in total revenues.
TNK 4Q22 outlook (TNK Presentation)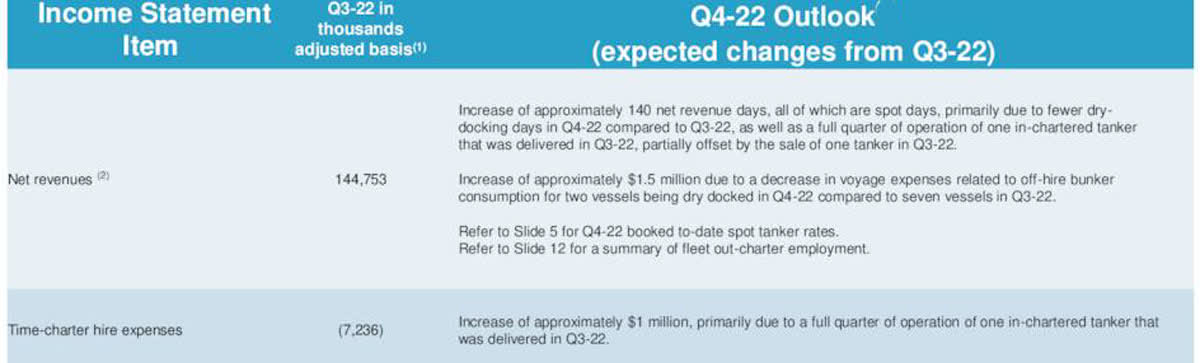
Technical Analysis And Commentary
TNK TA chart short-term (Fun Trading StockCharts)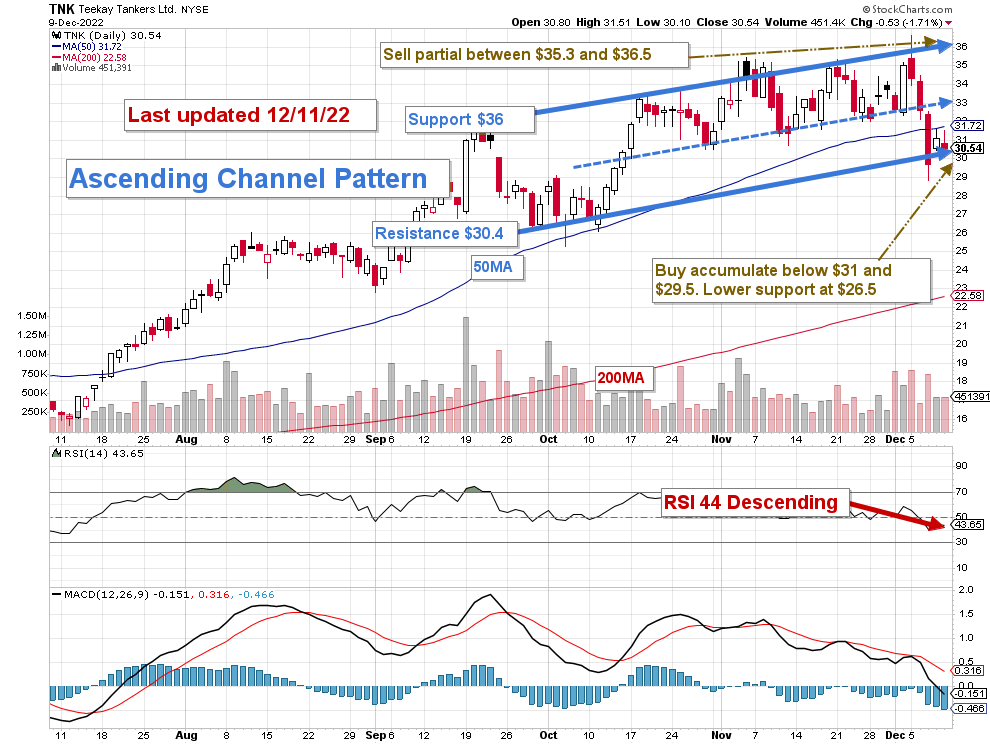
TNK forms an ascending channel pattern with resistance at $36 and support at $30.4. Ascending channel patterns are short-term bullish moving higher within an ascending channel, but these patterns often form within longer-term downtrends as continuation patterns.
The strategy has not changed since my preceding article, and it is what I promote in my marketplace, “The Gold and Oil corner.”
The basic strategy is to take profits between $35.3 and $36.5 and accumulate again between $29.5 and $31 with potential lower support at $26.5.
The short-term trading strategy is to trade LIFO about 65%-70% of your position and keep a small core long-term amount for a much higher payday that could be in the $40s. However, I think the stock is now showing a high valuation.
Warning: The TA chart must be updated frequently to be relevant. It is what I am doing in my stock tracker. The chart above has a possible validity of about a week. Remember, the TA chart is a tool only to help you adopt the right strategy. It is not a way to foresee the future. No one and nothing can.
Author’s note: If you find value in this article and would like to encourage such continued efforts, please click the “Like” button below as a vote of support. Thanks.
Be the first to comment