

Key Talking Points:
- CAC 40 bounces off strong support
- IBEX 35 runs into another key Fibonacci level

Recommended by Daniela Sabin Hathorn
Get Your Free Equities Forecast
CAC 40 bounces off strong support
The CAC 40 has opened slightly higher today as global stocks bounce back from a sell-off rally seen on Monday as headlines about the health crisis took center stage in the absence of any positive news to keep last week’s momentum going.
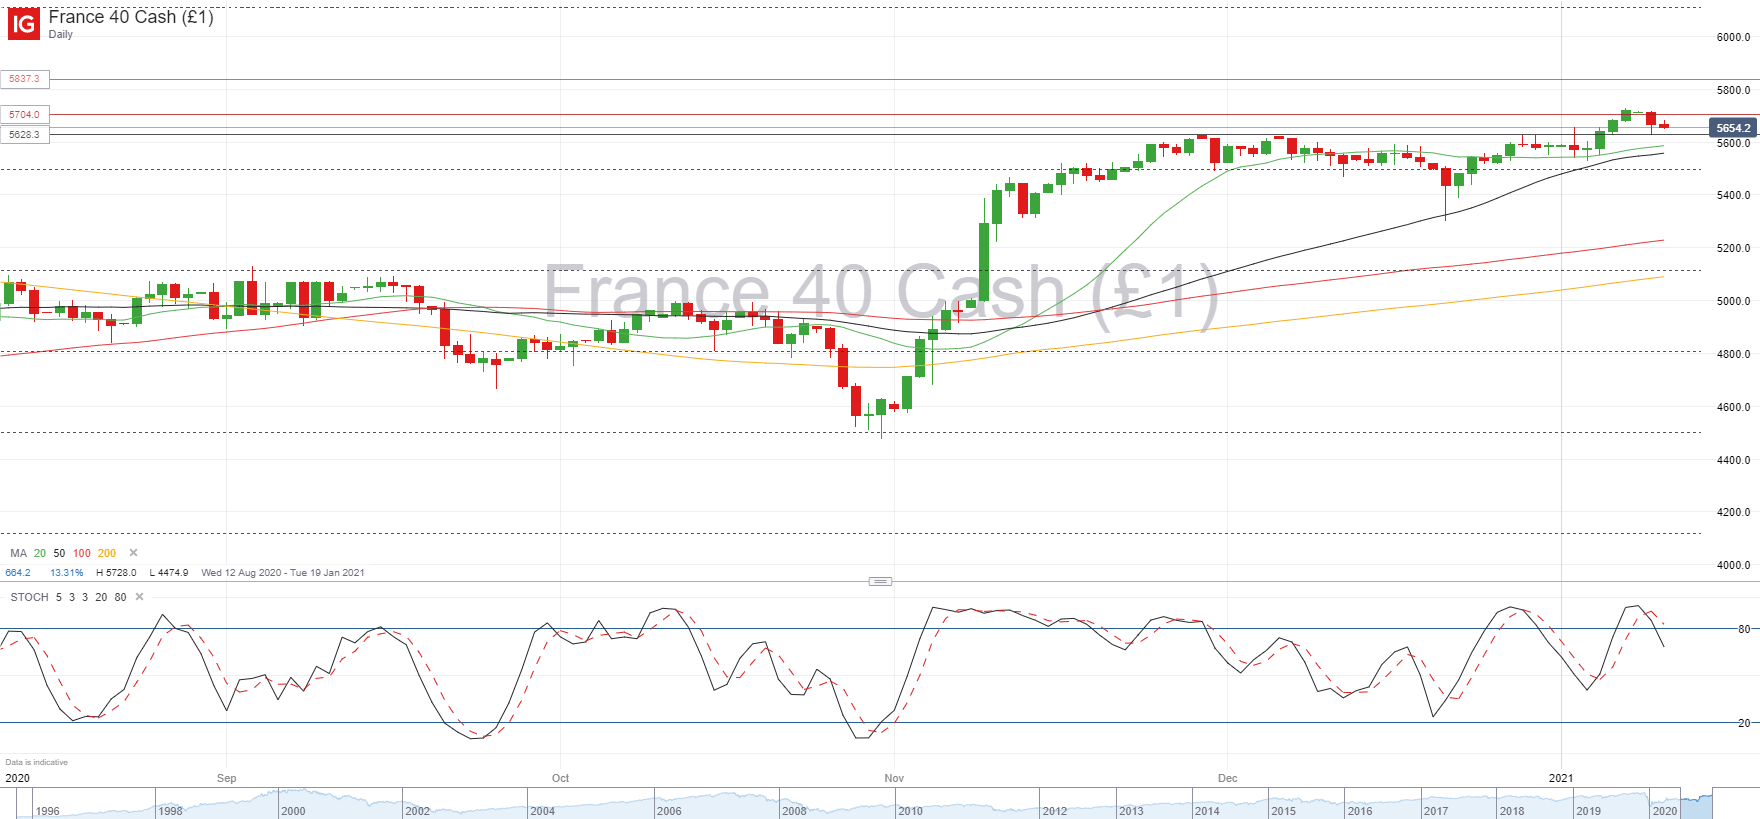
Equities have been looking vulnerable in recent days so yesterday’s pullback was no surprise, but we’re starting to visualize a phase of unclear direction as sentiment weighs on either side. What we did see yesterday is confirmation of short-term support at 5,628 an area I had previously pointed out because it had been a strong resistance in the attempt to push higher back in November/December.
The CAC also managed to break above the resistance area I had pointed out at 5,705, but yesterday’s correction has left the current price below this level again, meaning it could well serve as key resistance in the next few days. If broken, buyers will be looking for a next leg higher in the attempt to recover the coronavirus losses since early March, so a break above 6,000 is the medium-term objective, but selling pressure may increase around the 5,830/40 area.
To the downside, a break below short-term support at 5,628 could see further selling pressure breaking below the 5,600 mark, at which point the 76.4% Fibonacci at 5,495 come into play.
CAC 40 Daily chart
| Change in | Longs | Shorts | OI |
| Daily | 19% | -6% | 3% |
| Weekly | -9% | -8% | -8% |
IBEX 35 runs into another key Fibonacci level
The IBEX 35 is trading with caution this morning after being unable to break a key resistance after last week’s catch up rally. The Spanish index was rejected at the 61.8% Fibonacci level at 8,450 after seeing a 4.8% surge in the latter part of last week, in an attempt to catch up to its European counterparts.
As I’ve mentioned for several months, Fibonacci levels are a key tool to measure the progress of one asset to another, which has been an efficient way of comparing the recovery of different indices from the falls seen back in March. The IBEX has been lagging its European counterparts since the recovery seen in the summer, during which the index was unable to break the 8,000 level.
Looking at current price action, I wouldn’t be surprised if we see sideways consolidation in the next few days as the index attempts to build up buyer support for the next leg higher. Breaking the 61.8% Fibonacci is not going to be easy if we base it off how price behaved at the previous Fibonacci levels, reinforced by the fact that price has already been rejected once.
Therefore, I expect 8,450 and 8,000 to be the short-term resistance and support levels and also the upper and lower bounds of a sideways range. That said, a break above the upper limit may be met with further resistance at 8,625, whilst a break below the lower limit may be met with buyer support at 7,640.
IBEX 35 Daily chart

Learn more about the stock market basics here or download our free trading guides.
— Written by Daniela Sabin Hathorn, Market Analyst
Follow Daniela on Twitter @HathornSabin
Be the first to comment